
Since 1900 the global average surface temperature has risen by roughly 1.2 °C, a change documented by multiple long‑term data sets and linked to growing concentrations of greenhouse gases.
Quick Answer
Earth’s mean surface temperature increased about 1.2 °C (2.2 °F) between 1900 and the early 2020s. The warming is driven primarily by human emissions of carbon dioxide, methane, and other greenhouse gases that trap infrared radiation in the troposphere. This modest‑looking rise already alters weather patterns, accelerates ice loss, and raises sea level. While the overall trend is clear, uncertainties remain in regional variations, climate sensitivity, and future emission pathways.
Key Takeaways
- Global mean temperature has risen ~1.2 °C since 1900, based on instrumental records and satellite data.
- Human‑generated greenhouse gases are the dominant cause, with CO₂ accounting for roughly three‑quarters of the forcing.
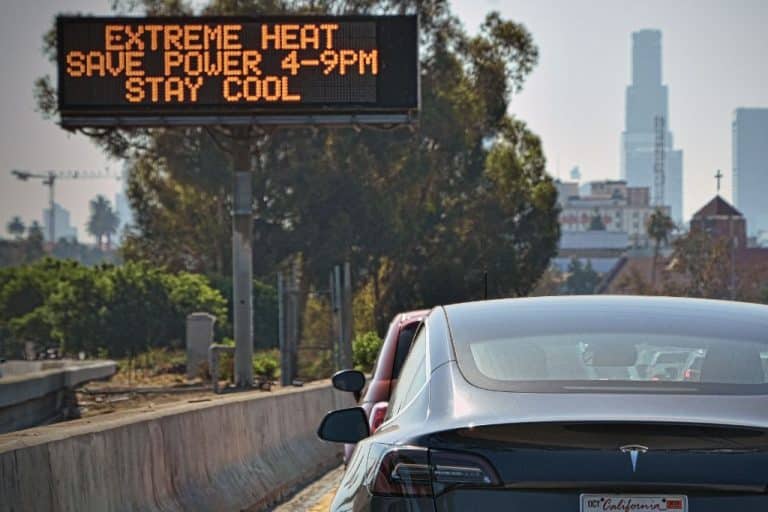
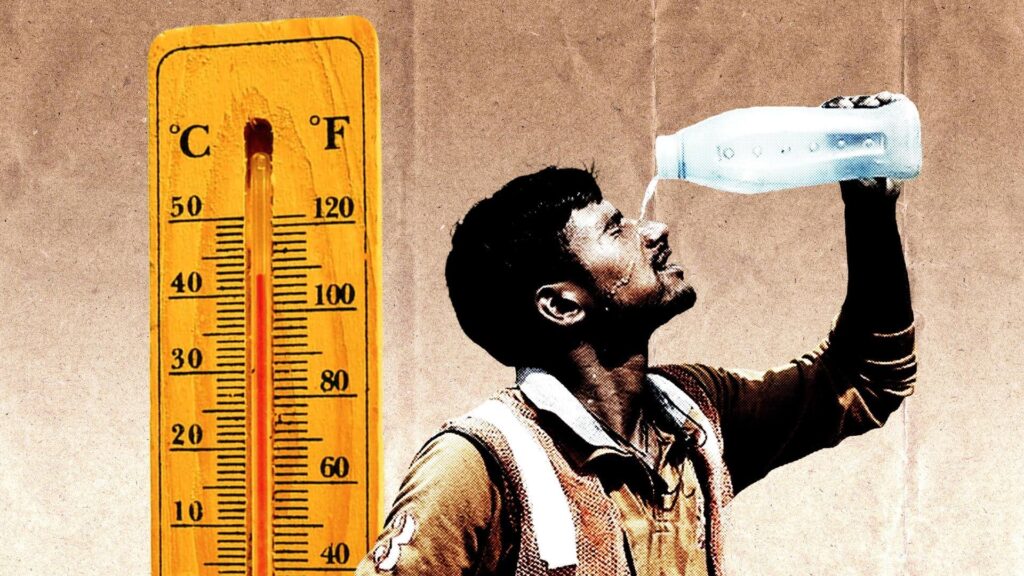
- Observed impacts include shrinking polar ice, rising sea level, and more frequent extreme heat events.
- High‑confidence findings are supported by the IPCC, NASA, NOAA, and peer‑reviewed assessments.
- Uncertainties focus on regional climate responses, feedback strength, and long‑term carbon cycle behavior.
- Effective responses combine mitigation of emissions, adaptation of vulnerable systems, and equitable policy design.
What Is How Much Earth’s Temperature Has Changed Since 1900?
The phrase refers to the difference between the global average surface temperature measured around the turn of the 20th century and the average temperature of the most recent decade (2010‑2019). It is expressed as an anomaly relative to a baseline period, typically 1901‑1930, and is derived from land‑based thermometers, ocean buoys, and satellite microwave sounding units. This metric differs from short‑term weather fluctuations because it reflects long‑term climate trends.
How Does It Work?
1. Greenhouse‑Gas Radiative Forcing
Greenhouse gases absorb outgoing infrared radiation and re‑emit it in all directions, including back toward Earth’s surface. This process reduces the net loss of heat to space, creating a positive radiative forcing that raises surface temperatures.
2. Energy Balance Adjustment
The climate system seeks a new equilibrium. As forcing increases, oceans absorb excess heat, the atmosphere warms, and the cryosphere (ice and snow) melts, further decreasing the planet’s albedo and amplifying warming.
3. Feedback Mechanisms
Key feedbacks include water‑vapour amplification (warmer air holds more moisture, a potent greenhouse gas), ice‑albedo feedback, and changes in cloud cover. These feedbacks can accelerate or moderate the primary warming signal.
What Does the Evidence Show?
Multiple independent lines of evidence converge on the ~1.2 °C figure:
- Instrumental records: Global land‑air temperature series compiled by the Met Office Hadley Centre (HadCRUT5) and NOAA show a rise of 1.14 °C from 1900 to 2021.
- Satellite observations: The University of Alabama in Huntsville (UAH) lower‑troposphere dataset records a 1.25 °C increase over the same period, confirming the surface trend from space.
- Reanalysis products: ERA5 (ECMWF) integrates observations with models and indicates a comparable warming magnitude.
- Attribution studies: The IPCC Sixth Assessment Report (2021) attributes >95 % of the warming since the mid‑20th century to anthropogenic greenhouse‑gas emissions.
These datasets are cross‑validated, and their agreement is considered strong evidence of a real, global-scale temperature increase.
Main Causes or Drivers
Human‑Induced Greenhouse Gases
CO₂ concentrations rose from ~290 ppm in 1900 to 419 ppm in 2022, a 44 % increase measured by the Mauna Loa Observatory. Fossil‑fuel combustion, cement production, and land‑use change are the primary sources.
Methane and Other Gases
Methane (CH₄) levels doubled from ~750 ppb to 1,900 ppb, driven by agriculture, natural‑gas systems, and waste management. Nitrous oxide (N₂O) and fluorinated gases also contribute to radiative forcing.
Land‑Use Change
Deforestation reduces carbon uptake and alters surface albedo, especially in boreal and tropical regions, adding a secondary but measurable warming effect.
Natural Variability (Limited Role)
Volcanic eruptions and solar irradiance fluctuations cause short‑term temperature swings, but their net contribution to the century‑scale trend is small compared with anthropogenic forcing, as shown in IPCC assessments.
Environmental and Human Impacts
Environmental Impacts
- Arctic sea‑ice extent has declined ~40 % since 1979 (NASA, 2023).
- Glaciers worldwide have lost ~267 Gt of ice per year on average between 2003‑2019 (IPCC, 2021).
- Global mean sea level rose about 20 cm from 1900 to 2020, driven by thermal expansion and ice melt.
- Heat‑related stress on ecosystems shifts species ranges toward poles and higher elevations.
Human Health and Social Impacts
- Heat‑related mortality increases by an estimated 0.5 % per 0.1 °C rise in extreme‑heat days (WHO, 2022).
- Changes in precipitation patterns affect water security for over 2 billion people.
- Agricultural yields for staple crops such as wheat and maize show sensitivity of −6 % to −10 % per °C of warming in many regions.
Economic and Infrastructure Impacts
- Coastal flooding threatens assets worth an estimated $1 trillion annually under current warming rates.
- Increased frequency of extreme storms raises insurance losses and reconstruction costs.
Regional Differences
Warming is not uniform. High‑latitude regions have warmed roughly twice as fast as the global mean, a phenomenon known as Arctic amplification. Conversely, some tropical ocean basins exhibit slower surface warming but experience stronger marine heatwaves. Land areas, especially in the Northern Hemisphere, show larger temperature anomalies than oceans because of lower heat capacity.
What Scientists Know With High Confidence
- Global average surface temperature has risen ~1.2 °C since 1900.
- Human emissions of CO₂, CH₄, and N₂O are the dominant cause of the observed warming.
- Warming has led to measurable ice loss, sea‑level rise, and increased frequency of extreme heat events.
- Satellites, surface stations, and ocean buoys provide consistent, independent confirmation of the trend.
What Remains Uncertain
Key uncertainties involve the magnitude of climate feedbacks—especially cloud responses—and the rate at which the deep ocean will absorb excess heat. Regional projections for precipitation and extreme‑event frequency vary among models, limiting precise local risk assessments. Improved observations in data‑sparse regions such as the high Arctic and parts of Africa are needed to reduce these gaps.
Common Misconceptions
Misconception: A 1.2 °C rise is too small to matter.
Reality: Even a fraction of a degree shift can move climate zones, increase heat‑related mortality, and accelerate ice melt, because many Earth systems are highly sensitive to temperature.
Misconception: Recent warming is just a short‑term cycle.
Reality: Multiple, independent long‑term records (instrumental, satellite, proxy) show a persistent upward trend that exceeds natural variability.
Misconception: Only industrialized nations cause the warming.
Reality: While per‑capita emissions are higher in affluent countries, cumulative global emissions drive the trend; emerging economies also contribute increasingly.
Solutions and Limitations
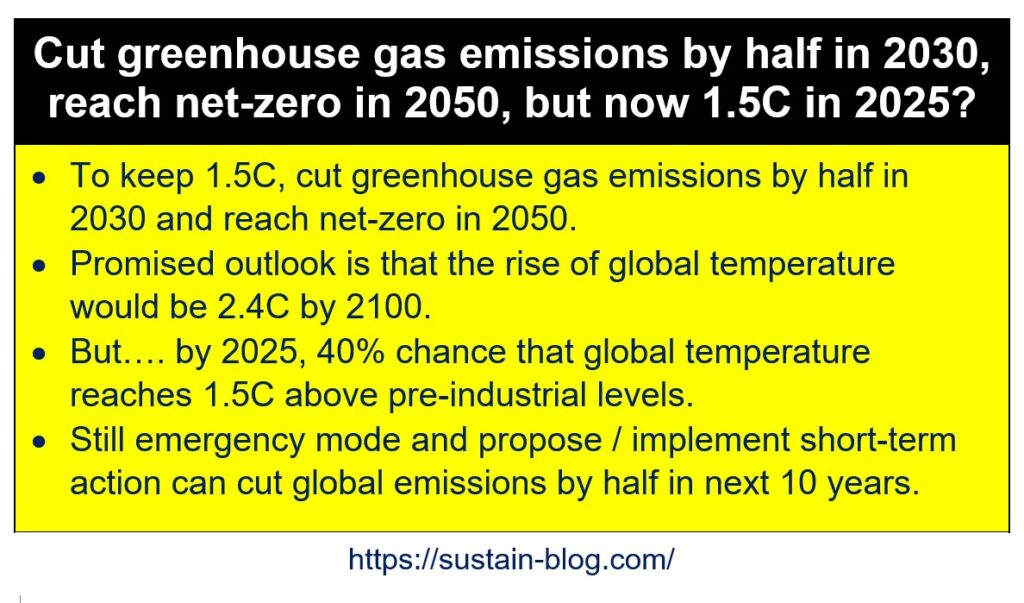
Mitigation strategies focus on reducing CO₂ and CH₄ emissions through renewable energy deployment, energy efficiency, and land‑use management. Limitations include technology cost, grid integration challenges, and the need for policy frameworks. Adaptation measures—such as flood defenses, heat‑action plans, and climate‑resilient agriculture—address unavoidable impacts but require substantial investment and coordination. Nature‑based solutions (e.g., restoring wetlands) provide co‑benefits but cannot replace deep emission cuts.
What Individuals, Communities, and Governments Can Do
What Individuals Can Do
- Reduce personal carbon footprints by improving home energy efficiency, using public transit, and choosing lower‑carbon diets.
- Support climate‑focused policies through voting, advocacy, and community engagement.
- Participate in local resilience projects such as tree planting, heat‑wave preparedness, and water‑conservation programs.
What Communities and Organizations Can Do
- Develop climate‑action plans that set measurable emission‑reduction targets.
- Invest in green infrastructure—cool roofs, permeable pavements, and renewable micro‑grids.
- Partner with indigenous groups to integrate traditional ecological knowledge into adaptation strategies.
What Governments Can Do
- Implement carbon pricing mechanisms that internalize the social cost of emissions.
- Set ambitious renewable‑energy standards and phase out coal subsidies.
- Fund research on climate feedbacks, improve monitoring networks, and support vulnerable populations.
Closing Synthesis
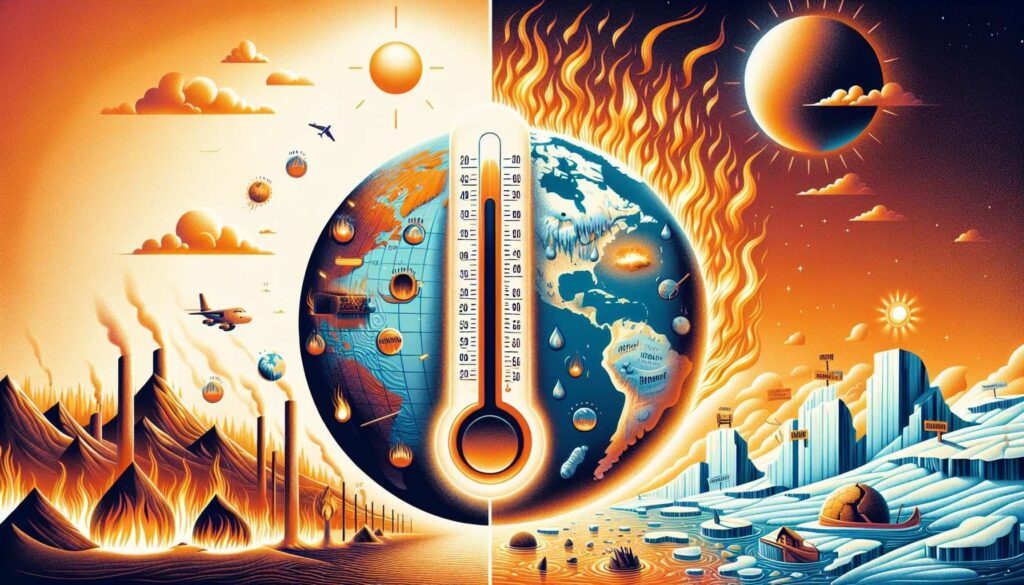
The ~1.2 °C increase in global temperature since 1900 is a well‑documented, high‑confidence finding that stems largely from human‑generated greenhouse gases. This warming already reshapes ice sheets, sea levels, ecosystems, and human societies, with impacts differing across regions. While uncertainties persist in feedback strength and regional projections, the core conclusion—that rapid, anthropogenic warming is underway—is robust. Effective responses require a blend of deep emissions cuts, targeted adaptation, and equitable policies that recognize both the science and the social dimensions of climate change.
Frequently Asked Questions
How much has the global average temperature increased since 1900?
The global average surface temperature has risen about 1.2 °C (2.2 °F) from the early 20th century to the early 2020s, as shown by instrumental records and satellite observations.
What is the main cause of the temperature rise since 1900?
Human emissions of greenhouse gases—especially carbon dioxide from fossil‑fuel combustion and land‑use change—are the dominant driver, accounting for more than 95 % of the observed warming.
Which regions have warmed the most since 1900?
High‑latitude areas, particularly the Arctic, have warmed roughly twice as fast as the global average, a pattern known as Arctic amplification, while tropical oceans warm more slowly but experience stronger marine heatwaves.
What are the most certain impacts of the observed warming?
High‑confidence impacts include shrinking polar ice, rising sea level (about 20 cm since 1900), increased frequency of extreme heat events, and measurable shifts in ecosystem distributions.
What actions can governments take to address the temperature increase?
Governments can implement carbon pricing, set renewable‑energy targets, phase out coal subsidies, fund climate research, and develop adaptation plans that protect vulnerable communities and infrastructure.






Leave a Comment