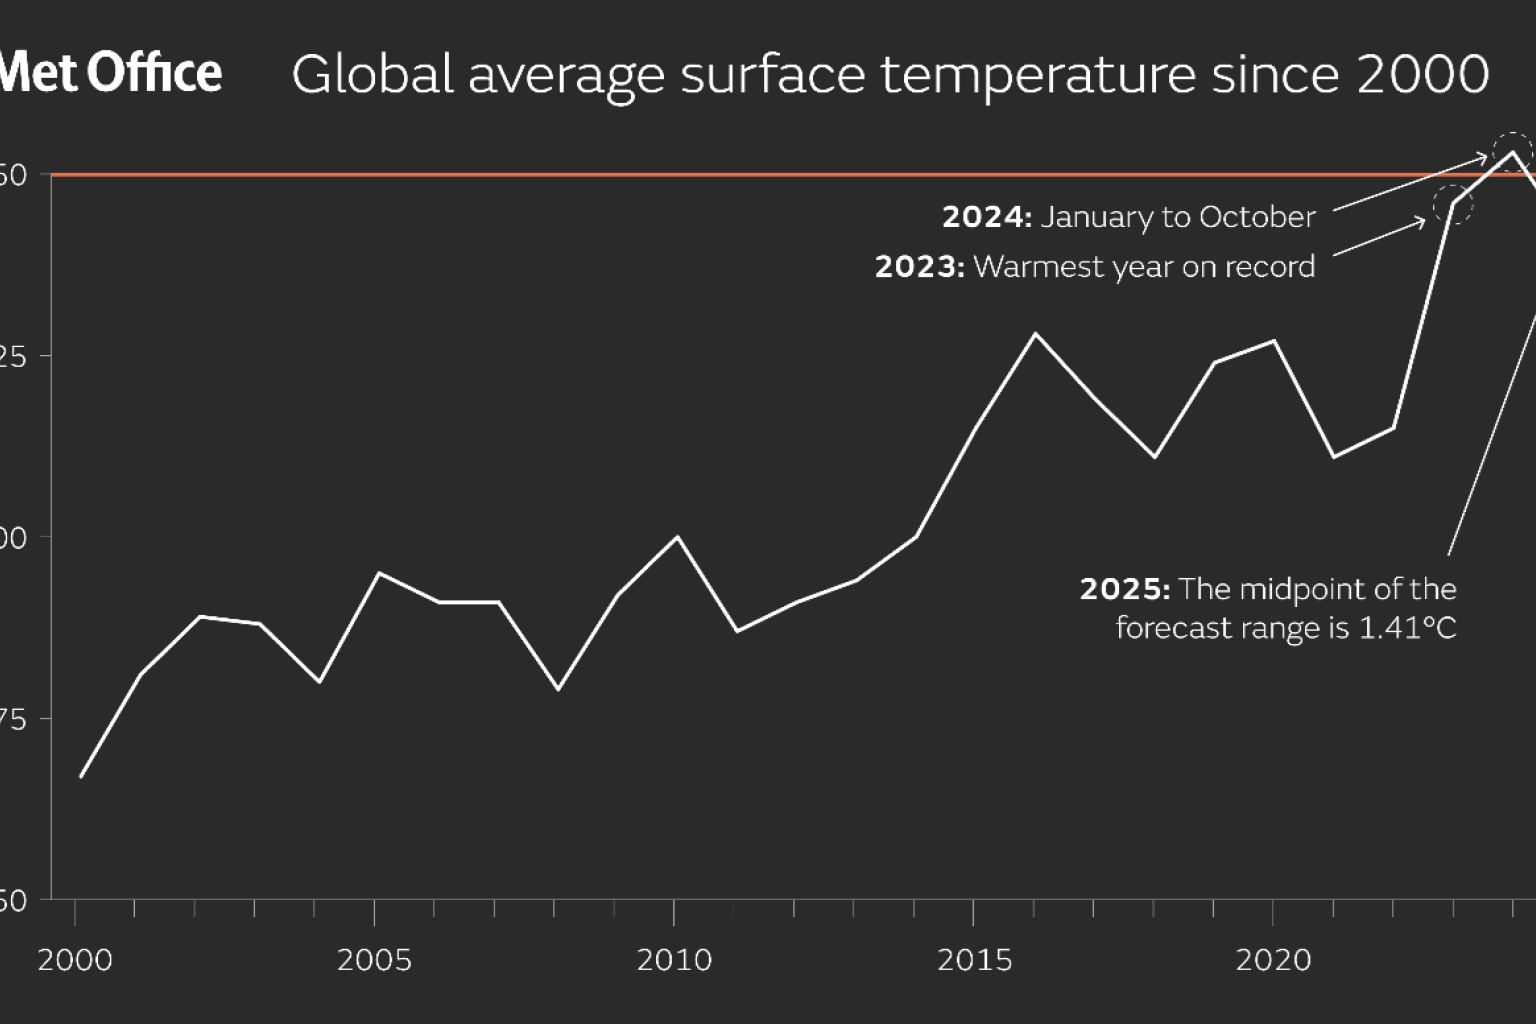
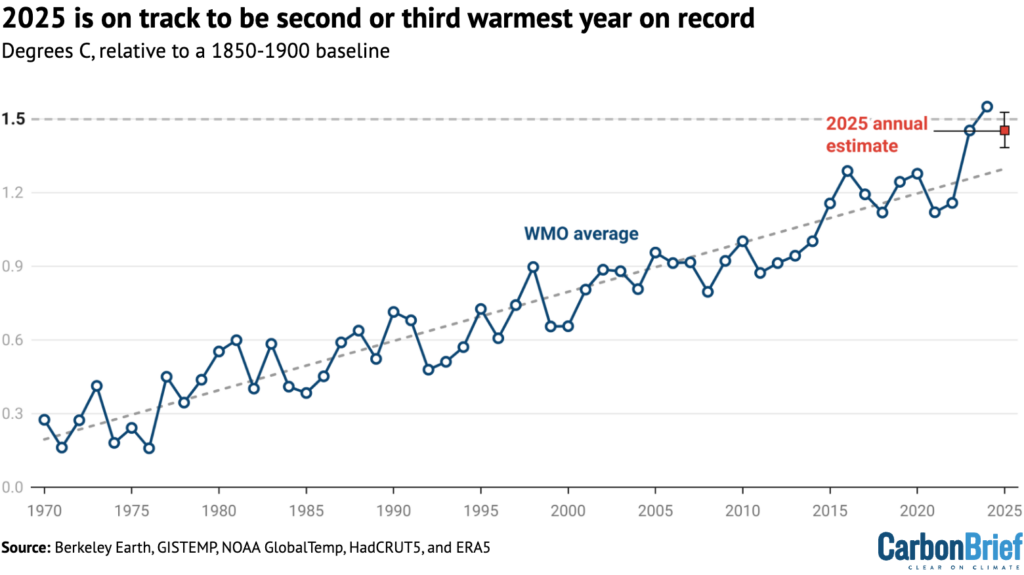
The World Meteorological Organization projects that 2025 will rank among the three warmest years since records began, highlighting ongoing human‑driven warming and its growing climate risks.
Quick Answer
According to the WMO’s 2024 State of the Global Climate report, the annual mean surface temperature for 2025 is expected to fall within the top three warmest years since reliable measurements began in 1850. The projection rests on satellite observations, ground‑based thermometers, and climate‑model ensembles that incorporate greenhouse‑gas concentrations up to 2023. The primary driver is continued anthropogenic carbon dioxide emissions, which maintain a positive radiative forcing that lifts global temperatures. The most consequential impact is a heightened likelihood of extreme heat, intensified droughts, and accelerating sea‑level rise, while regional details and feedback magnitudes retain moderate uncertainty.
Key Takeaways
- 2025 is projected to be one of the three warmest years on record since 1850.
- Human‑origin carbon dioxide emissions are the dominant cause, amplified by feedbacks such as reduced ice albedo.
- Observed climate impacts already include more frequent heatwaves, stronger precipitation extremes, and faster sea‑level rise.
- High‑confidence findings confirm the warming trend; uncertainties remain in regional climate sensitivity and carbon‑cycle feedbacks.
- Effective mitigation, adaptation, and equitable policies are essential to limit further warming.
What Is 2025 on Track to Rank Among the Three Warmest Years Ever WMO Reports?
The statement refers to the World Meteorological Organization’s assessment that the globally averaged surface temperature for the calendar year 2025 will rank within the three warmest years recorded since the start of instrumental monitoring in 1850. The ranking is based on a homogenised dataset that merges land‑based thermometer records, ocean buoy measurements, and satellite‑derived temperature anomalies. Unlike short‑term weather events, an annual mean temperature reflects the climate signal over a full year, providing a robust indicator of long‑term change.
How Does It Work?
Physical Process of Global Warming
- Solar radiation reaches Earth; a portion is reflected (by clouds, ice, and bright surfaces) while the remainder is absorbed, warming the surface.
- Greenhouse gases—principally carbon dioxide (CO₂), methane (CH₄), and nitrous oxide (N₂O)—absorb the long‑wave infrared radiation emitted by the warmed surface and re‑emit it back toward the planet, creating a warming “blanket.”
- Human activities such as fossil‑fuel combustion, cement production, and deforestation have raised atmospheric CO₂ from ~280 ppm in the pre‑industrial era to over 420 ppm in 2023 (NOAA, 2024).
- The enhanced greenhouse effect increases the global mean surface temperature, a metric tracked by the WMO through a network of more than 2,000 surface stations and a suite of satellite sensors.
- Feedback mechanisms—such as reduced sea‑ice albedo, increased atmospheric water vapour, and permafrost thaw—amplify the initial warming.
Why 2025 Stands Out
Climate‑model ensembles from the Coupled Model Intercomparison Project Phase 6 (CMIP6), calibrated with observed greenhouse‑gas concentrations, project that, without additional mitigation, the 2025 annual mean temperature will exceed the 2016‑2020 average by roughly 1.2 °C. This projection aligns with the observed pattern that the five warmest years on record have all occurred since 2015, indicating a persistent upward trajectory.

What Does the Evidence Show?
Multiple independent lines of evidence converge on the conclusion that the planet is warming:
- Instrumental records: The Global Historical Climatology Network shows a 1.1 °C increase in land‑surface temperature since 1850 (WMO, 2024).
- Satellite observations: NOAA’s series of polar‑orbiting satellites record a steady rise in tropospheric temperature anomalies over the past four decades.
- Attribution studies: Detection‑and‑attribution analyses attribute more than 99 % of warming since the mid‑20th century to anthropogenic greenhouse gases (IPCC AR6, 2021).
- Ocean heat content: The International Oceanographic Data and Information Exchange reports a 23 % increase in heat stored in the upper 2 km of the ocean since 1990.
These datasets span land, ocean, and atmospheric layers, reinforcing the robustness of the WMO projection for 2025.
Main Causes or Drivers
Direct Causes
- Carbon dioxide emissions from coal, oil, and gas combustion—approximately 36 Gt CO₂ yr⁻¹ in 2022 (IEA).
- Methane releases from agriculture, landfills, and fossil‑fuel extraction—about 380 Mt CH₄ yr⁻¹ (UNEP).
Underlying Drivers
- Rapid economic growth in emerging markets that relies on carbon‑intensive energy sources.
- Insufficient global alignment on carbon pricing and renewable‑energy incentives.
Amplifying Factors
- Deforestation reduces the biospheric carbon sink, accounting for roughly 10 % of annual CO₂ emissions.
- Permafrost thaw releases additional CO₂ and CH₄, a feedback still being quantified.
Environmental and Human Impacts
Environmental Impacts
- Heatwaves: The frequency of >40 °C events in mid‑latitudes has doubled since the 1980s (WMO, 2023).
- Precipitation extremes: Modelled increases of 5‑15 % in the intensity of the heaviest 1 % of daily rainfall events globally.
- Sea‑level rise: Thermal expansion and glacier melt contribute about 3.3 mm yr⁻¹, raising coastal flood risk.
Human Health and Social Impacts
- Heat‑related mortality is estimated to rise by roughly 2 % for each 1 °C of warming above pre‑industrial levels (WHO, 2022).
- Staple‑crop yields for wheat and maize may decline 5‑10 % per °C of warming in tropical regions, threatening food security.
- Climate‑driven migration could increase by 30‑50 % in vulnerable low‑income regions by 2050 (International Migration Organization).
Economic and Infrastructure Impacts
- Increased frequency of extreme weather raises insurance losses and reconstruction costs, especially in coastal and flood‑prone areas.
- Heat stress on power grids can trigger blackouts, reducing economic productivity.
Regional Differences
Warming is not uniform. High‑latitude regions experience amplified temperature gains—up to 2 °C above the global mean—due to ice‑albedo feedbacks. Some tropical ocean basins show smaller surface temperature increases but more frequent marine heatwaves that stress coral reefs. In South Asia, rising temperatures combined with monsoon variability intensify both flood and drought cycles, while the Sahel faces lengthening dry seasons that accelerate desertification. These patterns reflect differences in baseline climate, land‑use practices, and adaptive capacity.
What Scientists Know With High Confidence
What Scientists Know With High Confidence
- The global mean surface temperature has risen by roughly 1.1 °C since the pre‑industrial era.
- Human‑induced greenhouse‑gas emissions are the dominant driver of observed warming since the mid‑20th century.
- Extreme heat events and heavy precipitation are becoming more frequent and intense worldwide.
- Sea‑level rise is ongoing and will continue for centuries because of thermal expansion and ice‑sheet melt.
What Remains Uncertain
What Remains Uncertain
Key uncertainties include the exact magnitude of climate sensitivity (the temperature response to a doubling of CO₂), regional precipitation changes in arid zones, and the rate at which permafrost carbon stores will be released. These gaps stem from limited observational coverage in remote areas, model‑resolution constraints, and the complex interplay of feedback mechanisms that are still being quantified. While the overall warming trend is secure, refining these uncertainties will improve regional risk assessments and inform more precise policy targets.
Common Misconceptions
Common Misconceptions
Misconception: “One warm year proves climate change is a myth.”
Reality: Climate change is evaluated over multi‑decadal periods. A single year’s temperature, while informative, is part of a long‑term trend confirmed by more than 170 years of data.
Misconception: “Only CO₂ matters; other gases are negligible.”
Reality: Methane, nitrous oxide, and fluorinated gases have higher global‑warming potentials per molecule and together contribute roughly 20 % of total radiative forcing.
Misconception: “Renewable energy alone will stop warming instantly.”
Reality: Renewables are essential, but a rapid phase‑down of fossil‑fuel use, carbon‑capture technologies, and changes in consumption patterns are also required to meet the Paris‑Agreement goal of limiting warming to 1.5 °C.
Solutions and Limitations
Response strategies fall into mitigation, adaptation, and nature‑based approaches. Each offers benefits but also faces trade‑offs.
Mitigation
- Decarbonising the energy sector: Scaling solar, wind, and storage can cut electricity‑sector emissions, yet intermittency and grid‑integration costs remain challenges in many regions.
- Energy efficiency: Upgrading building envelopes and industrial processes can achieve 20‑30 % emission reductions, but financing mechanisms and policy incentives vary widely.
- Carbon pricing: Well‑designed carbon taxes or cap‑and‑trade systems internalise the social cost of emissions, though political acceptance and leakage concerns can limit implementation.
Adaptation
- Heat‑action plans: Early‑warning systems, cooling centers, and urban‑design measures reduce exposure, yet they require sustained funding and community engagement.
- Climate‑smart agriculture: Drought‑resistant crop varieties and improved water‑management conserve resources, but adoption depends on farmer access to technology and credit.
- Infrastructure resilience: Raising roads, fortifying flood defenses, and designing climate‑proof buildings mitigate damage, but construction costs can be prohibitive for low‑income regions.
Nature‑Based Solutions
- Reforestation and afforestation: Trees sequester carbon and protect watersheds, yet land‑use conflicts and long‑term maintenance can limit scalability.
- Coastal ecosystem restoration: Mangroves and wetlands buffer storm surges and store carbon, but they are vulnerable to sea‑level rise themselves.
All solutions must be evaluated for cost, equity, and potential unintended consequences. No single measure can halt warming; a portfolio of actions is required.
What Individuals, Communities, and Governments Can Do
What Individuals Can Do
- Shift to low‑carbon transport options such as public transit, cycling, or electric vehicles where feasible.
- Improve household energy efficiency by using LED lighting, high‑efficiency appliances, and better insulation.
- Adopt a more plant‑rich diet, which typically reduces personal carbon footprints.
- Support local climate initiatives, including community solar projects and urban‑tree planting.
- Engage civically—vote for climate‑responsive policies, attend public hearings, and contact elected representatives.
What Communities and Organizations Can Do
- Develop heat‑wave response plans that incorporate cooling centers, vulnerable‑population registries, and real‑time alerts.
- Invest in green infrastructure—permeable pavements, urban forests, and reflective roofing—to mitigate urban heat islands.
- Implement climate‑smart agricultural practices such as conservation tillage, agroforestry, and efficient irrigation.
- Foster local renewable‑energy cooperatives to increase clean‑energy access.
What Governments Can Do
- Enact and strengthen carbon‑pricing mechanisms that reflect the social cost of emissions.
- Accelerate the phase‑out of coal‑fired power plants and subsidise renewable‑energy deployment, especially in underserved areas.
- Expand and modernise climate‑monitoring networks, prioritising data gaps in the Global South.
- Integrate climate‑risk assessments into urban planning, infrastructure budgeting, and disaster‑risk reduction strategies.
- Support research on climate sensitivity, permafrost feedbacks, and regional precipitation projections to reduce key uncertainties.
Closing Synthesis
The WMO’s projection that 2025 will rank among the three warmest years ever recorded underscores the persistent, human‑driven warming of the planet. Robust observations—from surface thermometers, satellites, and ocean heat measurements—combined with climate‑model ensembles confirm that rising greenhouse‑gas concentrations are the primary driver. This warming translates into more frequent heatwaves, intensified precipitation extremes, and accelerating sea‑level rise, with disproportionate impacts on vulnerable populations and ecosystems. High‑confidence findings give a solid foundation for policy, while uncertainties—particularly around regional climate sensitivity and feedback loops—highlight the need for continued monitoring and research. Mitigation through rapid decarbonisation, complemented by adaptation and nature‑based solutions, offers the most viable pathway to limit future warming. Collective action across individuals, communities, and governments remains essential to safeguard ecosystems and societies from the escalating risks of a warming world.
Frequently Asked Questions
Why is 2025 considered one of the warmest years on record?
The WMO’s 2024 State of the Global Climate report projects that the 2025 annual mean surface temperature will fall within the top three warmest years since 1850, based on satellite data, ground observations, and climate‑model ensembles that include greenhouse‑gas concentrations up to 2023.
What are the main drivers behind the projected warmth of 2025?
The primary driver is continued anthropogenic carbon dioxide emissions, which maintain a positive radiative forcing. This is reinforced by feedbacks such as reduced sea‑ice albedo and increased atmospheric water vapour, all of which amplify the initial warming.
How confident are scientists about the warming trend?
Scientists have high confidence that the global mean surface temperature has risen about 1.1 °C since the pre‑industrial era and that human greenhouse‑gas emissions are the dominant cause, as supported by multiple independent data sets and assessment reports.
What uncertainties remain regarding the 2025 temperature projection?
Key uncertainties involve the exact magnitude of climate sensitivity, regional precipitation changes in arid zones, and the rate of permafrost carbon release. These stem from limited observations in remote areas and model‑resolution constraints.
What actions can individuals take to help limit future warming?
Individuals can reduce personal carbon footprints by using low‑carbon transport, improving home energy efficiency, adopting a plant‑rich diet, supporting community renewable projects, and engaging in civic actions such as voting for climate‑responsive policies.






Leave a Comment