
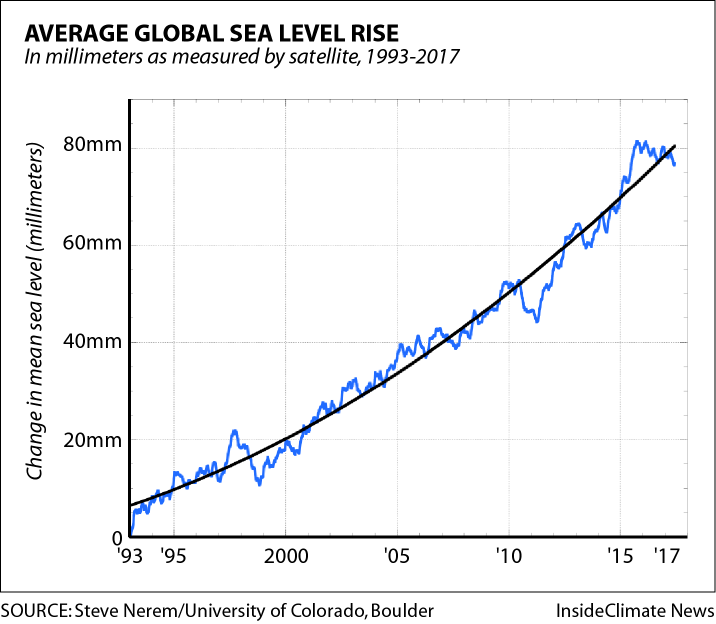
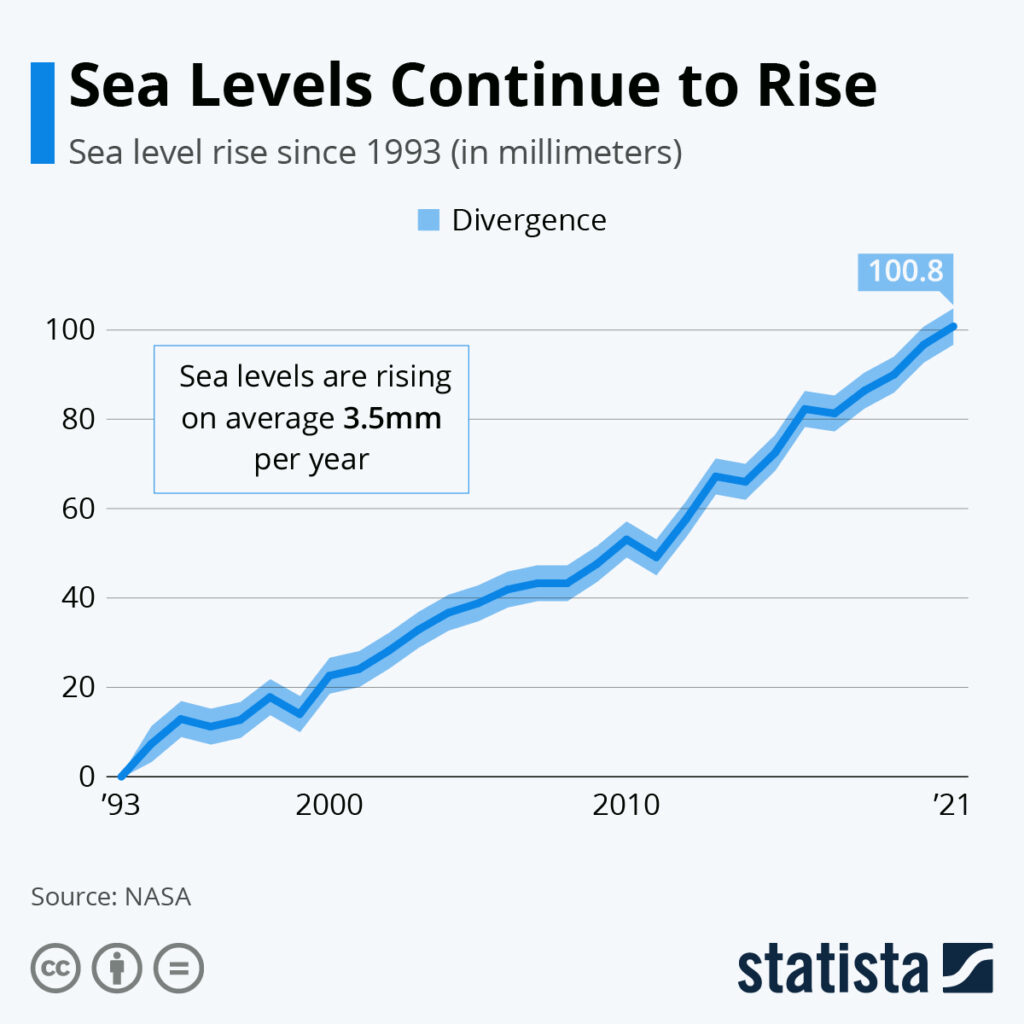
Sea levels are rising at an average of about 3.3 mm per year since the early 1990s, driven by thermal expansion and ice melt, with profound implications for coastlines, ecosystems, and societies worldwide.
Quick Answer
Global mean sea level has risen roughly 3.3 mm per year over the satellite era (1993‑2020), a rate confirmed by tide‑gauge networks and satellite altimetry. The increase results from two primary mechanisms: the warming‑induced expansion of seawater and the addition of meltwater from glaciers and the Greenland and Antarctic ice sheets. This steady rise amplifies coastal flood risk, threatens low‑lying habitats, and raises the baseline for storm surge. While the average rate is well‑established, future acceleration depends on uncertain ice‑sheet dynamics and greenhouse‑gas emission pathways.
Key Takeaways
- Since the early 1990s, the global average sea‑level rise is about 3.3 mm per year.
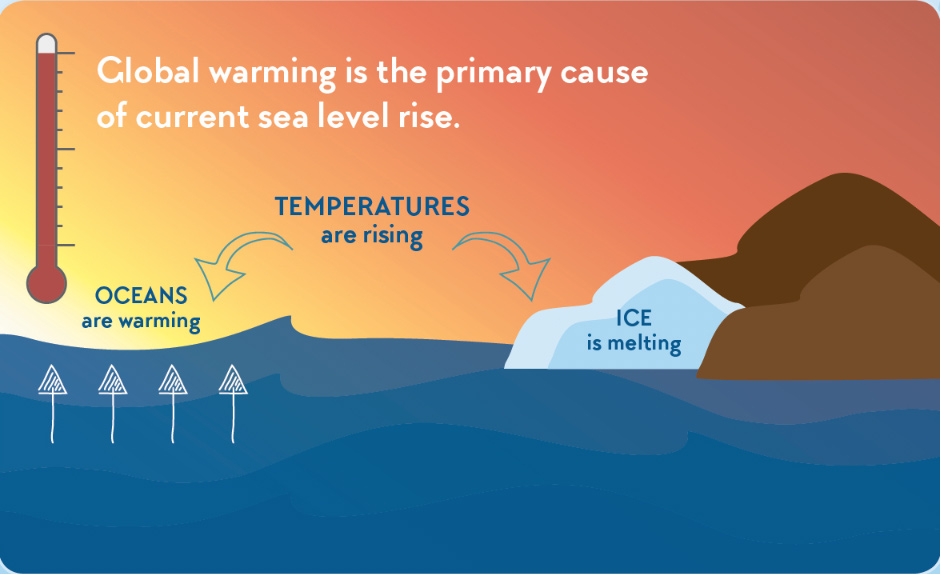
- Thermal expansion accounts for roughly half of the observed rise; the rest comes mainly from glacier and ice‑sheet melt.
- Regional rates vary widely because of ocean currents, land subsidence, and gravitational effects.
- High‑confidence findings confirm that sea‑level rise is ongoing and accelerating.
- Future rates are uncertain, especially regarding Antarctic ice‑sheet stability and emission scenarios.
What Is How Much Do Sea Levels Rise Each Year on Average?
The phrase refers to the long‑term, globally averaged increase in the height of the ocean surface measured relative to a fixed terrestrial reference. It is expressed as an annual rate (millimetres per year) and is derived from two complementary data streams: satellite altimetry, which measures the distance from a satellite to the sea surface, and coastal tide‑gauge records, which track sea‑level changes at specific locations. The metric differs from short‑term fluctuations such as tides or storm surges; it captures the underlying trend driven by climate‑related processes.
How Does It Work?
1. Thermal Expansion (Steric Effect)
When ocean water warms, its volume increases because water expands with temperature. This expansion raises the sea surface without adding new water mass. The effect is strongest in the upper 700 m, where most heat is absorbed.
2. Ice‑Sheet and Glacier Melt
Rising air temperatures melt glaciers worldwide and accelerate basal melting of the Greenland and Antarctic ice sheets. Meltwater flows into the ocean, directly increasing its mass.
3. Land‑Water Storage Changes
Human activities such as dam construction, groundwater extraction, and reservoir filling relocate water between land and ocean, contributing a smaller but measurable component to sea‑level change.
4. Gravitational and Rotational Adjustments
Mass loss from ice sheets alters Earth’s gravity field, causing regional sea‑level variations (the “fingerprint” effect). The redistribution of water also changes Earth’s rotation, subtly affecting sea‑level patterns.
What Does the Evidence Show?
Multiple lines of high‑quality evidence converge on the 3.3 mm yr⁻¹ figure. Satellite altimetry missions such as TOPEX/Poseidon (1992‑2005) and the Jason series (2001‑present) provide a continuous global record, showing a linear increase of 3.3 mm yr⁻¹ with a small upward trend in the last decade (IPCC, 2021). Tide‑gauge networks, maintained by national agencies, corroborate this rate when adjusted for local land movement. Peer‑reviewed assessments (e.g., the IPCC Sixth Assessment Report) attribute ~50 % of the rise to steric expansion and ~40 % to glacier and ice‑sheet melt, with the remainder from land‑water changes.
Main Causes or Drivers
Direct Physical Drivers
- Ocean warming – driven by increased atmospheric greenhouse gases.
- Ice‑sheet melt – accelerated by surface melting and basal lubrication.
- Glacier retreat – response to regional temperature rises.
Underlying Human Drivers
- Fossil‑fuel combustion and deforestation, which raise global mean temperatures.
- Land‑use changes that affect runoff and groundwater extraction.
Environmental and Human Impacts
Environmental Impacts
- Coastal wetlands and mangroves experience increased inundation, reducing habitat for fish and birds.
- Coral reefs face higher rates of bleaching as sea‑level rise interacts with warming waters.
- Altered salinity gradients affect estuarine ecosystems.
Human Health and Social Impacts
- Higher baseline water levels amplify the reach of storm surges, increasing flood frequency.
- Saltwater intrusion contaminates freshwater aquifers, jeopardising drinking‑water supplies.
- Coastal communities may face displacement, leading to migration pressures.
Economic and Infrastructure Impacts
- Property values in low‑lying areas decline as flood risk rises.
- Infrastructure such as roads, ports, and sewage systems requires costly elevation or protection.
- Insurance costs and disaster relief expenditures are projected to increase substantially.
Regional Differences
While the global average is 3.3 mm yr⁻¹, local rates can differ by a factor of two or more. In the western Pacific, strong trade‑wind convergence and ocean‐dynamic uplift add roughly 1 mm yr⁻¹ to the global mean. In contrast, parts of the U.S. Gulf Coast experience subsidence of 2–3 mm yr⁻¹, effectively raising relative sea level by 5–6 mm yr⁻¹. The Antarctic Peninsula shows localized acceleration due to rapid ice‑sheet loss, whereas some high‑latitude regions experience slower apparent rise because of gravitational rebound.
What Scientists Know With High Confidence
- Sea level is rising globally, and the rate has increased compared with the 20th‑century average of ~1.5 mm yr⁻¹.
- Thermal expansion and ice‑sheet melt are the dominant contributors to the observed increase.
- Continental ice loss has accelerated over the past two decades, as shown by satellite gravimetry (GRACE).
- Relative sea‑level rise varies regionally due to ocean dynamics, land motion, and gravitational effects.
What Remains Uncertain
Key uncertainties centre on the future behavior of the Antarctic ice sheet, especially the West Antarctic grounding‑line basins, where limited observations make projections divergent. Regional sea‑level projections also depend on the accuracy of land‑subsidence estimates and on how ocean currents may shift under warming. These gaps affect long‑term planning but do not undermine the conclusion that sea level will continue to rise.
Common Misconceptions
Misconception: Sea‑level rise is caused only by melting ice.
Reality: About half of the observed rise comes from the thermal expansion of seawater, a process independent of ice melt.
Misconception: The rise is linear and will stay at 3 mm yr⁻¹.
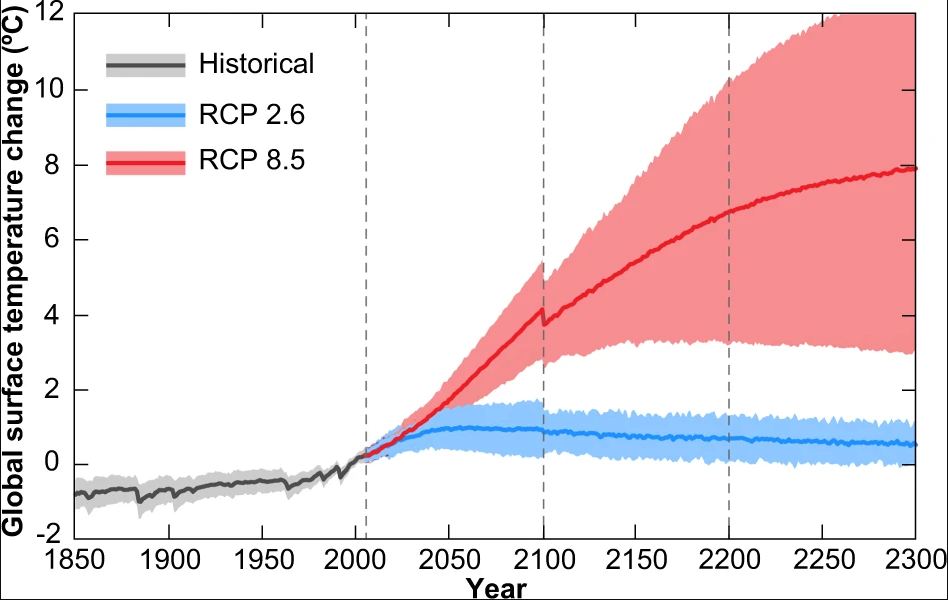
Reality: The rate has accelerated in the past decade, and future acceleration is likely if greenhouse‑gas emissions continue.
Misconception: All coasts will be underwater soon.
Reality: Even a 1 m rise by 2100 would inundate low‑lying areas but would not submerge major inland regions; impacts are uneven and depend on local topography and adaptation measures.
Solutions and Limitations
Mitigation (Addressing the Root Cause)
- Rapid decarbonisation of energy, transport, and industry can limit future thermal expansion.
- Limitations: Requires global policy coordination, massive investment, and societal transitions.
Adaptation (Managing the Impact)
- Hard engineering: sea walls, surge barriers, and levees protect specific assets.
- Nature‑based solutions: restoring mangroves, salt‑marshes, and oyster reefs provide flexible buffers.
- Managed retreat: relocating infrastructure from high‑risk zones.
- Limitations: High costs, land‑use conflicts, and the potential for unintended ecological effects.
What Individuals, Communities, and Governments Can Do
What Individuals Can Do
- Reduce personal carbon footprints through energy efficiency, low‑carbon travel, and plant‑rich diets.
- Support coastal‑resilience projects, such as community mangrove planting, through volunteering or donations.
- Advocate for strong climate policies by engaging with local representatives.
What Communities and Organizations Can Do
- Develop and implement coastal‑zone master plans that incorporate sea‑level projections.
- Invest in early‑warning systems and flood‑risk mapping.
- Prioritise nature‑based protection in urban waterfronts.
What Governments Can Do
- Adopt and enforce ambitious emissions‑reduction targets aligned with the Paris Agreement.
- Fund long‑term monitoring networks (satellite altimetry, tide gauges, GRACE‑type missions).
- Provide financing mechanisms for climate‑resilient infrastructure and for communities facing relocation.
Closing Synthesis
The average annual rise of about 3.3 mm per year reflects a well‑documented, accelerating response of the ocean to a warming climate. Thermal expansion and ice‑sheet melt are the primary drivers, and the trend is solidly supported by satellite and tide‑gauge observations. While the magnitude of future rise remains uncertain—especially regarding Antarctic dynamics—the direction and underlying physics are clear. Effective responses combine rapid mitigation to curb further warming with adaptive measures that protect vulnerable coastlines and communities. By understanding the science, acknowledging uncertainties, and acting collectively, societies can reduce risk and build resilience against the inevitable tide.
Frequently Asked Questions
What is the current average rate of global sea‑level rise?
The global average sea‑level rise is about 3.3 mm per year, based on satellite altimetry data from 1993 to 2020 and corroborated by tide‑gauge records.
Why does sea level rise faster in some regions than the global average?
Regional differences arise from local land subsidence, ocean‑current changes, gravitational effects of melting ice, and variations in water temperature, which can add or subtract from the global mean rate.
What are the two main physical processes that drive sea‑level rise?
Thermal expansion of warming seawater and the addition of meltwater from glaciers and the Greenland and Antarctic ice sheets together account for most of the observed rise.
How certain are scientists about future sea‑level projections?
Scientists are highly confident that sea level will continue to rise, but uncertainties remain about the speed of Antarctic ice‑sheet loss and regional variations, which affect precise future projections.
What actions can communities take to adapt to rising sea levels?
Communities can develop coastal‑zone master plans, invest in nature‑based buffers like mangroves, upgrade flood‑warning systems, and consider managed retreat for the most vulnerable areas.





Leave a Comment