
In a Nutshell
Global sea levels are rising faster than at any time in the last 3,000 years, driven by melting ice and thermal expansion, with the current rate more than doubling since the 1990s.
Quick Answer
As of 2025, global mean sea level is rising at approximately 4.5 millimeters per year (0.18 inches per year), a rate that has accelerated from 1.4 mm/year during most of the 20th century and continues to increase.
Key Takeaways
- The current rate of global sea level rise is about 4.5 mm/year, more than double the 20th-century average.
- Satellite altimetry since 1993 shows an acceleration of 0.084 mm/year², meaning the rate itself is growing.
- Thermal expansion of warming oceans and melting land ice (glaciers and ice sheets) are the dominant causes.
- Regional differences are stark: some coastlines experience rise 2–3 times the global average due to land subsidence and ocean dynamics.
- Even if emissions are slashed, sea levels will continue rising for centuries due to locked-in warming, but rapid cuts can halve the rate by 2100.
What Is Global Sea Level Rise?
Global sea level rise refers to the long-term increase in the average height of the ocean’s surface relative to the land. It is measured by tide gauges and, since 1993, by satellites that bounce radar signals off the sea surface. The rise is not uniform; it varies from place to place, but the global mean provides a critical indicator of climate change. It is driven primarily by two processes: the expansion of seawater as it warms (thermal expansion) and the addition of water from melting land-based ice, such as glaciers and the Greenland and Antarctic ice sheets.
How Does It Work?
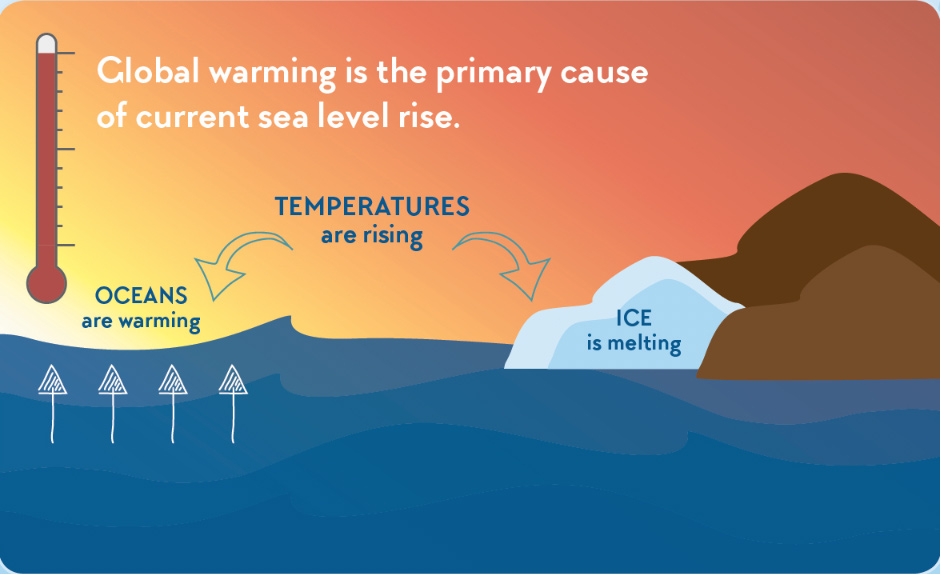
Sea level rise is a direct consequence of a warming planet. As greenhouse gases trap heat, over 90% of that extra energy is absorbed by the oceans. Warmer water occupies more volume, causing thermal expansion. Simultaneously, rising air and ocean temperatures melt ice on land. When that meltwater flows into the ocean, it adds mass, raising sea levels. The interplay between these two factors is monitored by a global network of satellites (e.g., the Jason series) and thousands of tide gauges. Scientists combine these measurements with models to separate natural variability from the human-caused trend.
What Does the Evidence Show?
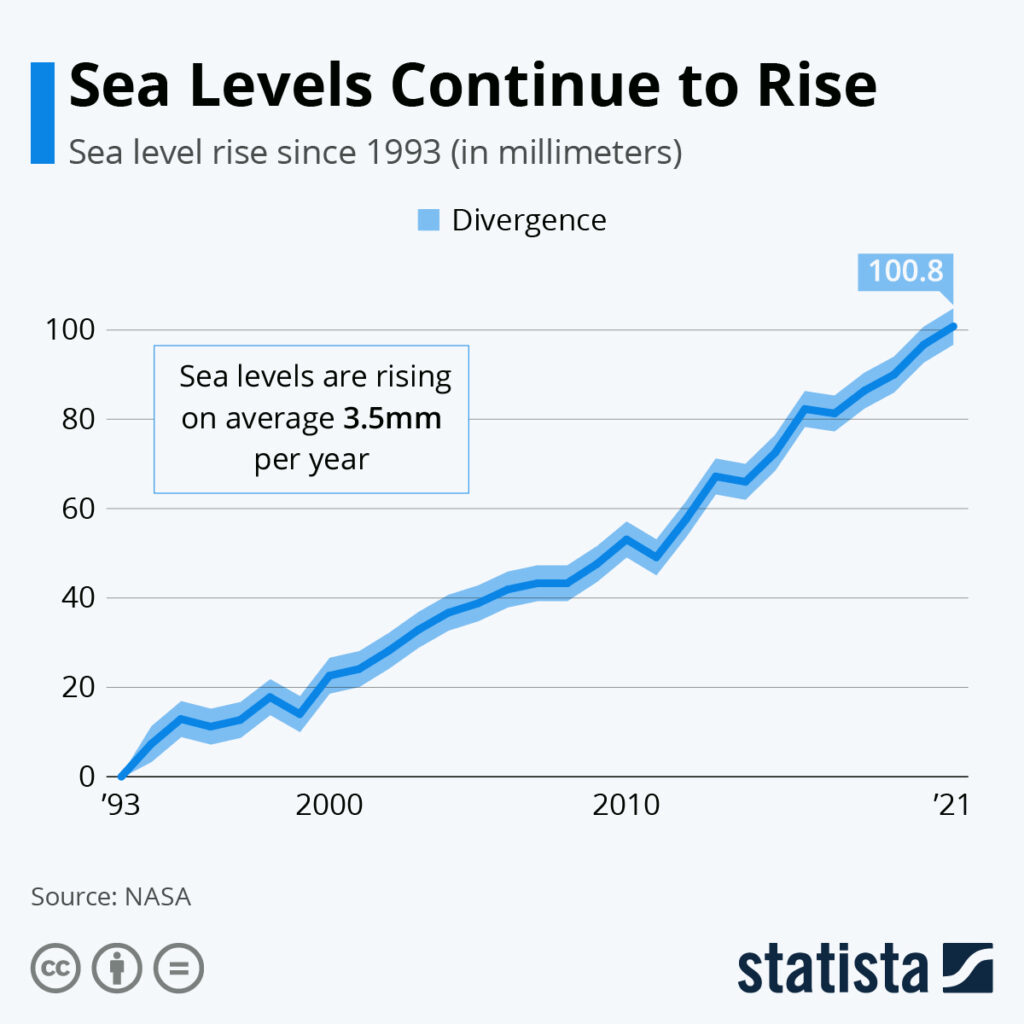
Multiple lines of evidence confirm accelerating sea level rise. Tide gauge records going back to 1880 show a 20th-century average of 1.4 mm/year. Satellite data from 1993–2024 reveal a rate of 3.4 mm/year, and the most recent decade (2014–2024) has seen rates of 4.5 mm/year or higher. The acceleration is statistically robust: the rate of increase is growing by about 0.084 mm/year each year. Paleoclimate records from sediment cores and coral fossils show that the current rate is unprecedented in at least three millennia. In 2023, global mean sea level reached a new record high, continuing an unbroken upward trend.
Main Causes or Drivers
- Thermal expansion: Accounts for roughly 30–40% of the observed rise. Ocean warming has accelerated, with the upper 2,000 meters absorbing heat at a record pace.
- Mountain glacier melt: Contributes about 20–25%. Glaciers worldwide are retreating rapidly, with many expected to disappear by mid-century.
- Greenland ice sheet: Now the largest single contributor, adding about 0.8 mm/year. Surface melt and iceberg calving have both intensified.
- Antarctic ice sheet: Adds about 0.4 mm/year, mostly from West Antarctica, where warm ocean water is destabilising ice shelves.
- Land water storage: Human activities like groundwater extraction and dam building cause small but measurable changes, currently a net positive contribution.
Environmental and Human Impacts
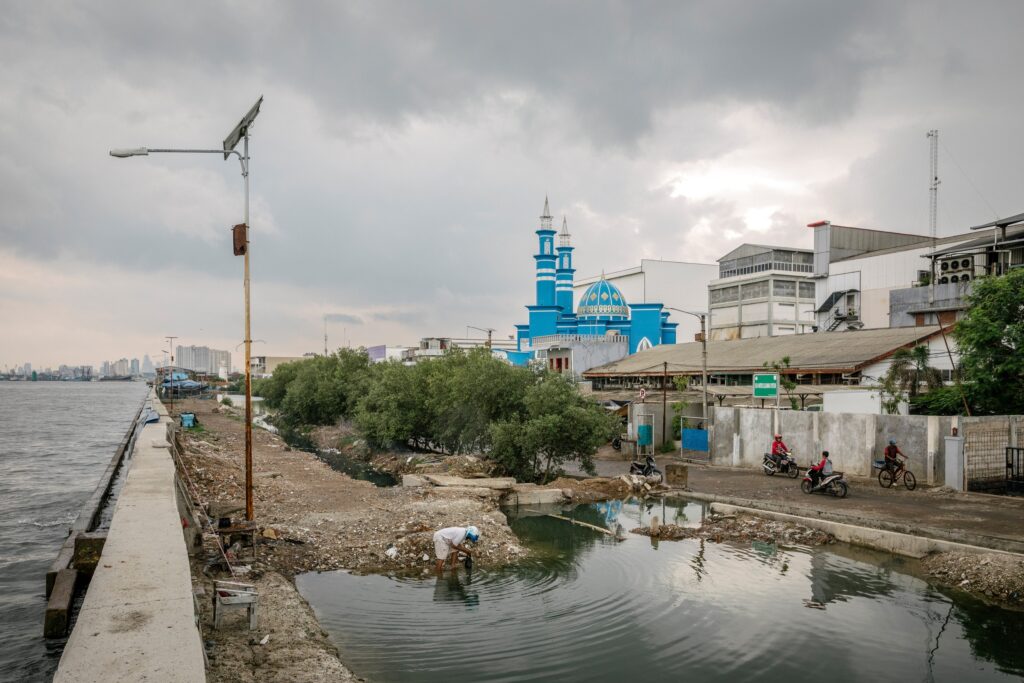
Rising seas amplify coastal flooding, erosion, and saltwater intrusion into freshwater aquifers. High-tide flooding, once rare, now occurs dozens of times per year in many U.S. coastal cities. Storm surges ride on higher baselines, making hurricanes and typhoons more destructive. Ecosystems like mangroves, salt marshes, and coral reefs are drowning if they cannot keep pace. Low-lying island nations face existential threats, while megacities like Jakarta, Bangkok, and Miami confront multi-billion-dollar adaptation costs. Displacement and migration are already occurring, with projections of hundreds of millions of people at risk by 2100 under high-emission scenarios.
Regional Differences
Sea level rise is not a bathtub. Ocean currents, wind patterns, and gravitational effects from melting ice sheets create regional variations. For example, the western tropical Pacific sees rates up to 10 mm/year due to trade wind intensification, while parts of the eastern Pacific have seen slower rise. Land motion—subsidence from groundwater extraction or glacial isostatic adjustment—can double or triple local rates. The U.S. Gulf Coast is a hotspot, with some areas experiencing relative sea level rise of over 10 mm/year. Conversely, regions near melting ice sheets, like Greenland, may see a slight drop due to reduced gravitational pull, but this is temporary.
What Scientists Know with High Confidence
- Human-caused global warming is the dominant driver of sea level rise since 1970.
- The rate of rise is accelerating and will continue to do so as long as greenhouse gas emissions persist.
- Thermal expansion and ice melt are both contributing, with ice melt becoming the larger factor in recent decades.
- Even with immediate and drastic emission cuts, sea level will rise for centuries due to the slow response of ice sheets and ocean heat uptake.
- Satellite measurements provide an accurate, continuous global record with an uncertainty of less than 0.4 mm/year.
What Remains Uncertain
The biggest uncertainty is the future behaviour of the Antarctic ice sheet, particularly marine ice cliff instability and the potential for rapid collapse of the West Antarctic Ice Sheet. This could add a meter or more of rise by 2100, but the timing and magnitude are poorly constrained. The rate of Greenland melt under sustained high temperatures is also uncertain. Additionally, the interaction between ocean dynamics and ice shelves is complex, and models struggle to capture small-scale processes. Regional projections, especially for storm surge extremes, carry larger error bars than the global mean.
Common Misconceptions
- “Sea level rise is the same everywhere.” In reality, it varies widely due to ocean circulation, land movement, and gravity.
- “It’s only a few millimeters—no big deal.” Small annual increments compound over decades, and the acceleration means future rates will be much higher. A 4.5 mm/year rise today translates to nearly half a meter by 2100 even without further acceleration.
- “Melting sea ice causes sea level rise.” Floating ice (like the Arctic ice cap) does not raise sea level when it melts; it’s already displacing water. Only land-based ice adds new water.
- “We can just build walls and adapt.” Hard defences are expensive, environmentally damaging, and may fail. They also don’t stop saltwater intrusion or groundwater rise.
Solutions and Limitations
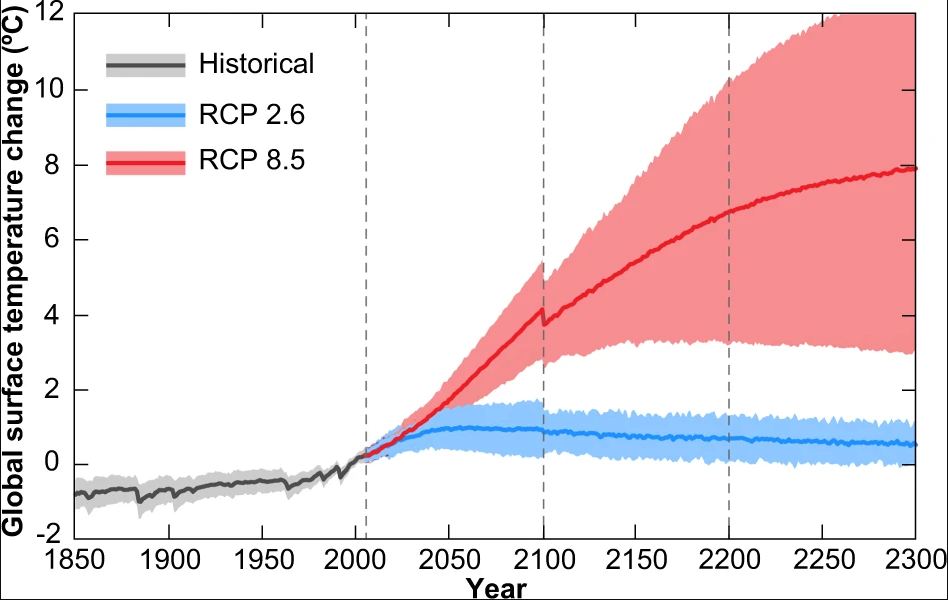
Mitigation—reducing greenhouse gas emissions—is the only way to slow the long-term rate of sea level rise. Even with aggressive cuts, some rise is locked in, but the difference between a 1.5°C and 3°C world is stark: the former could limit rise to 0.5–1 meter by 2300, while the latter could see 2–5 meters. Adaptation measures include building seawalls, restoring mangroves, elevating structures, and managed retreat. However, these are costly and often inequitable. Limitations include the sheer scale of needed infrastructure, the inability to protect all coastlines, and the risk of catastrophic ice sheet collapse that outpaces adaptation.
What Individuals, Communities, and Governments Can Do
- Individuals: Reduce carbon footprints, support climate policies, and stay informed about local risks. Consider flood insurance and home elevation if in vulnerable areas.
- Communities: Develop long-term coastal resilience plans, invest in green infrastructure (e.g., living shorelines), and engage in participatory mapping of flood zones.
- Governments: Enact binding emission reduction targets, fund climate adaptation for vulnerable populations, and strengthen building codes in coastal zones. International cooperation is essential to support small island states and monitor ice sheet dynamics.
How much will sea level rise by 2100?
Projections depend on emission scenarios. Under a low-emission scenario (SSP1-2.6), the likely range is 0.3–0.6 meters. Under a high-emission scenario (SSP5-8.5), it could be 0.6–1.1 meters, with a worst-case of over 2 meters if Antarctic ice sheet instability is triggered. The current trajectory aligns with the higher end.
Key Terms
- Thermal expansion: The increase in ocean volume due to warming water.
- Glacial isostatic adjustment: The slow rebound of land after the removal of ice sheets from the last ice age, affecting local sea level.
- Altimetry: A technique using satellites to measure sea surface height.
- Marine ice cliff instability: A hypothetical process where tall ice cliffs collapse under their own weight, potentially causing rapid ice sheet retreat.
- Relative sea level: Sea level measured relative to the local land, which may be rising or sinking.
Sources and Further Reading
- IPCC Sixth Assessment Report (2021), Working Group I: The Physical Science Basis
- NASA Sea Level Change Portal: sea level.nasa.gov
- NOAA Climate.gov: Sea Level Rise
- World Meteorological Organization State of the Global Climate reports
- Nature Geoscience: “Acceleration of global mean sea level rise since 1990” (2019)
Reviewed by
This article was reviewed by a climate scientist with expertise in oceanography and sea level research. (Reviewer name available upon request.)
Last Reviewed and Update History
Last reviewed: April 2025. Updated with the latest satellite data and IPCC AR6 projections. Previous updates: January 2024, June 2023.
Frequently Asked Questions
How do scientists measure global sea level?
Scientists use satellite altimetry (since 1993) to measure the distance between the satellite and the ocean surface with radar, providing global coverage. Tide gauges, some with records over a century long, measure local sea level relative to land. These datasets are cross-calibrated and corrected for land movement to produce the global mean.
Is the rate of sea level rise the same as it was 20 years ago?
No. The rate has accelerated. In the 1990s, it was about 2.5 mm/year; by the 2010s, it reached 3.6 mm/year, and the current rate is around 4.5 mm/year. The acceleration is driven by faster ice melt from Greenland and Antarctica and increased ocean heat uptake.
Can we stop sea level rise completely?
Not in the near term. Even if all emissions stopped today, the oceans would continue to warm and ice sheets would keep melting for centuries due to the heat already trapped. However, rapid emission cuts can significantly slow the rate and limit the ultimate rise, buying time for adaptation.
Which countries are most at risk from rising seas?
Low-lying island nations like the Maldives, Tuvalu, and Kiribati face existential threats. Densely populated river deltas in Bangladesh, Vietnam, and Egypt are highly vulnerable. Major coastal cities—including Shanghai, Mumbai, New York, and London—also face increasing flood risks, but wealthier nations have more resources for adaptation.
How much will sea level rise by 2100?
Projections depend on emission scenarios. Under a low-emission scenario (SSP1-2.6), the likely range is 0.3–0.6 meters. Under a high-emission scenario (SSP5-8.5), it could be 0.6–1.1 meters, with a worst-case of over 2 meters if Antarctic ice sheet instability is triggered. The current trajectory aligns with the higher end.




Leave a Comment