
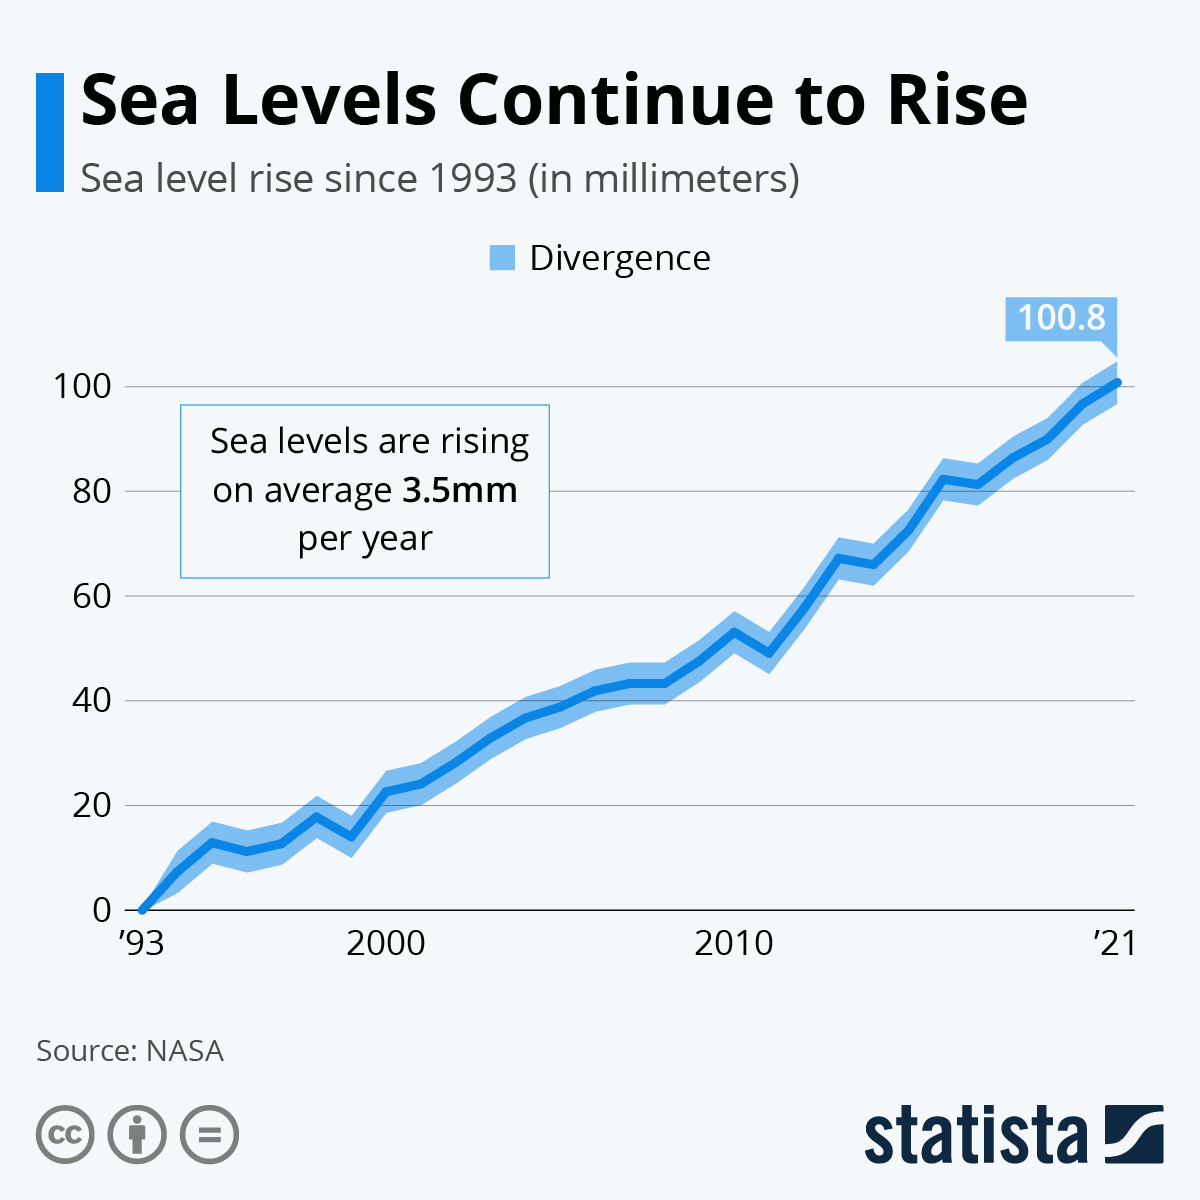
Sea levels are currently rising at about 3.3 mm per year, a rate measured by satellite altimetry since the early 1990s, and this steady increase shapes coastal risk, ecosystem change, and climate‑related policy worldwide.
Quick Answer
Global mean sea level is rising at roughly 3.3 millimetres per year, based on satellite observations that began in 1992 and have been continuously validated by tide‑gauge networks. The rise results from two dominant processes: thermal expansion of warming ocean water and the added meltwater from glaciers and the Greenland and Antarctic ice sheets. While the trend is clear and accelerating, regional variations—driven by land subsidence, ocean currents, and gravitational effects—mean that some coastlines experience rates two to three times higher. Scientists are confident that the long‑term upward trend will continue, but precise local projections remain uncertain.
Key Takeaways
- Sea level is increasing by about 3.3 mm yr⁻¹ globally, based on satellite altimetry since the early 1990s.
- Thermal expansion and melting of land ice together account for roughly 80 % of the observed rise.
- Regional rates differ widely; subsiding coasts such as the U.S. Gulf Coast rise faster than the global average.
- High‑confidence findings confirm the upward trend, while uncertainties remain around future ice‑sheet dynamics.
- Adaptation strategies—ranging from nature‑based defenses to managed retreat—must consider local rates and socioeconomic context.
What Is How Fast Are Sea Levels Rising Right Now? Today’s Rate Explained?
The phrase refers to the measured, near‑term speed at which the average height of the world’s oceans is increasing. It is distinct from long‑term geological sea‑level change (tens of thousands of years) and from short‑term fluctuations such as tides or storm surges. The metric is expressed as a global mean rate, typically in millimetres per year, and is derived from satellite altimetry (e.g., NASA’s TOPEX/Poseidon, Jason‑1/2/3) combined with a network of coastal tide gauges.
How Does It Work?
1. Thermal Expansion (Steric Effect)
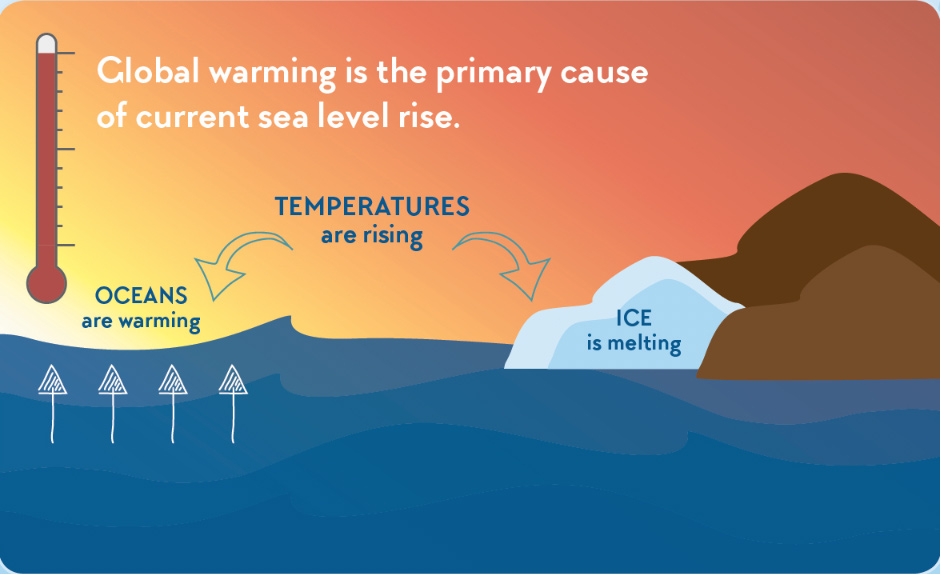
When seawater absorbs heat, its volume expands because water molecules move farther apart. The ocean has taken up more than 90 % of excess heat from greenhouse‑gas‑driven warming, leading to a measurable rise in sea level.
2. Melting of Glaciers and Ice Sheets
Glaciers worldwide and the massive ice sheets of Greenland and Antarctica lose mass through surface melt, iceberg calving, and basal melting. The resulting freshwater adds directly to ocean volume.
3. Land‑Water Storage Changes
Human activities such as groundwater extraction and dam construction shift water between land and ocean. While these effects are smaller than the first two drivers, they contribute a few tenths of a millimetre per year.
4. Gravitational and Rotational Adjustments
Mass loss from ice sheets alters Earth’s gravity field, causing water to redistribute and locally amplify sea‑level rise near the equator while reducing it near the ice source.
What Does the Evidence Show?
Multiple independent data streams converge on the same rate. Satellite altimetry, beginning with TOPEX/Poseidon in 1992, reports a global mean increase of 3.3 mm yr⁻¹ (±0.4 mm) through 2023. Tide‑gauge records, adjusted for vertical land movement, show a comparable long‑term trend of about 1.7 mm yr⁻¹ for the 20th century, accelerating to the modern satellite value.
Systematic reviews by the Intergovernmental Panel on Climate Change (IPCC) Sixth Assessment Report (2021) cite these observations and attribute roughly 42 % of the rise to thermal expansion and 38 % to glacier melt, with the remaining 20 % from ice‑sheet loss and terrestrial water storage.
Main Causes or Drivers
Direct Physical Drivers
- Ocean warming – drives steric expansion.
- Glacier and ice‑sheet melt – adds freshwater volume.
Underlying Human Drivers
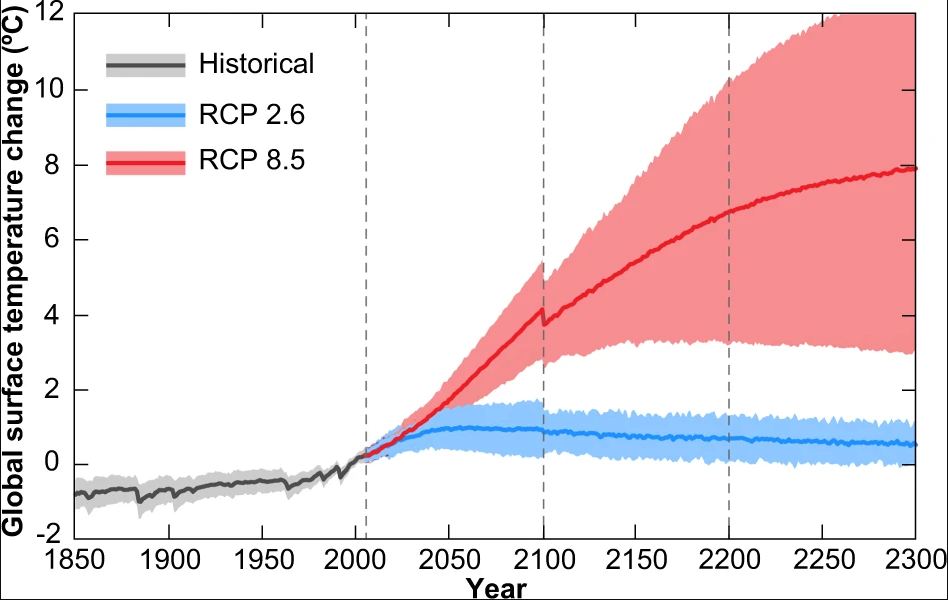
- Increasing atmospheric CO₂ and other greenhouse gases raise global temperatures.
- Land‑use changes affect regional subsidence and water storage.
Natural Modulators
- Solar cycles and volcanic aerosols can temporarily offset warming.
- El Niño‑Southern‑Oscillation influences short‑term sea‑level variability.
Environmental and Human Impacts
Environmental Impacts
Rising seas erode coastlines, inundate wetlands, and shift habitat ranges for mangroves, salt‑marsh birds, and marine species. Coral reefs experience increased sedimentation and altered light conditions, while ocean acidification—linked to the same CO₂ drivers—exacerbates stress on marine ecosystems.
Human Health and Social Impacts
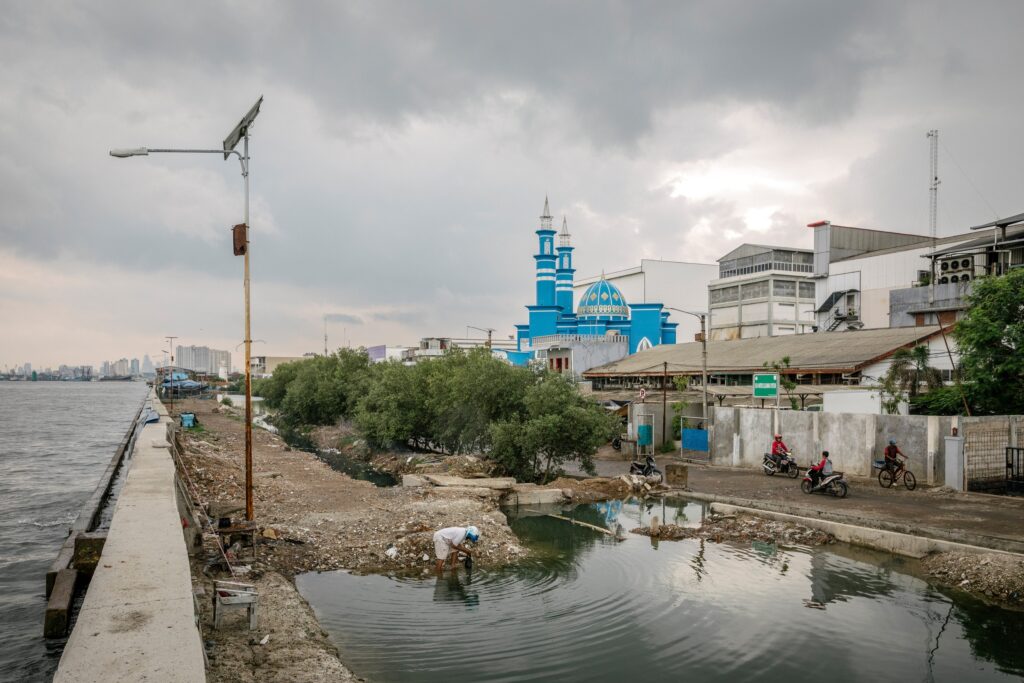
Coastal flooding raises the risk of water‑borne diseases, contaminates freshwater supplies with salt, and can displace vulnerable populations, especially low‑income communities lacking flood protection.
Economic and Infrastructure Impacts
Asset exposure assessments by the World Bank estimate that by 2050, sea‑level rise could threaten $1 trillion in coastal infrastructure under a high‑emission scenario. Property loss, increased insurance premiums, and the cost of protective engineering (e.g., sea walls) place substantial fiscal pressure on governments.
Regional Differences
Local sea‑level change is the sum of the global mean rise plus regional factors. The U.S. Gulf Coast, for example, records rates of 5–7 mm yr⁻¹ due to land subsidence and Gulf Stream dynamics, while parts of the western Pacific experience rates near the global average because of weaker subsidence.
Island nations such as the Maldives see sea‑level trends amplified by reduced land elevation and limited natural buffers, making even modest global rises existential threats.
What Scientists Know With High Confidence
- Global mean sea level has risen faster in the past three decades than in any comparable period of the 20th century.
- Thermal expansion and ice‑sheet melt are the primary contributors, with robust observational support.
- Sea‑level rise will continue as long as greenhouse‑gas concentrations remain elevated.
- Regional variations are real and can be quantified using satellite gravimetry and tide‑gauge networks.
What Remains Uncertain
Key uncertainties involve the future dynamics of the Antarctic ice sheet, especially the West Antarctic sector, where grounding‑line instability could accelerate melt beyond current projections. Additionally, the interaction between melting ice and ocean circulation—potentially affecting regional sea‑level patterns—is an active research frontier. Improving local subsidence measurements and integrating them with sea‑level models will reduce uncertainty for vulnerable coastal cities.
Common Misconceptions
Misconception: Sea‑level rise is caused only by melting ice.
Reality: Thermal expansion of warming seawater accounts for roughly 40 % of the observed rise, making it a major driver alongside ice melt.
Misconception: A few millimetres per year is negligible.
Reality: Over a decade, 3.3 mm yr⁻¹ translates to more than 3 cm of additional water, enough to increase flood frequency on low‑lying coasts and erode shorelines.
Misconception: All coasts rise at the same speed.
Reality: Local factors such as land subsidence, ocean currents, and gravitational redistribution cause some regions to experience rates double or triple the global average.
Misconception: Sea‑level rise will stop if emissions are reduced.
Reality: Even with rapid emissions cuts, the ocean’s thermal inertia means sea level will keep rising for centuries, though the magnitude can be limited.
Solutions and Limitations
Addressing sea‑level rise requires both mitigation of climate change and adaptation to its impacts.
- Mitigation: Reducing CO₂ emissions slows ocean warming and thus future thermal expansion. The limitation is the global coordination required and the long lag time before the ocean cools.
- Nature‑based adaptation: Restoring mangroves and coastal wetlands buffers storm surges and traps sediments, raising land elevation locally. However, these ecosystems can be vulnerable to salinity intrusion and require space.
- Hard engineering: Sea walls, surge barriers, and elevated infrastructure provide immediate protection but are costly, can exacerbate erosion downstream, and may become ineffective under multi‑meter rise scenarios.
- Managed retreat: Relocating communities out of high‑risk zones reduces long‑term exposure. Social acceptance, property rights, and financing are major challenges.
What Individuals, Communities, and Governments Can Do
What Individuals Can Do
- Support policies that limit greenhouse‑gas emissions (e.g., voting, advocacy).
- Participate in local shoreline clean‑ups that protect natural buffers.
- Consider flood‑resilient home designs when buying or renovating in coastal areas.
What Communities and Organizations Can Do
- Develop and regularly update coastal risk assessments using the latest sea‑level data.
- Invest in nature‑based solutions such as mangrove planting, dune restoration, and wetland preservation.
- Implement zoning that discourages new development in high‑risk floodplains.
What Governments Can Do
- Set ambitious national emissions‑reduction targets aligned with the Paris Agreement to limit future sea‑level acceleration.
- Allocate funding for adaptive infrastructure, prioritizing vulnerable low‑income neighborhoods.
- Support research on ice‑sheet dynamics and improve satellite‑altimetry networks for better monitoring.
Looking Ahead
Sea‑level rise is a measurable, ongoing process driven by well‑understood physical mechanisms. While the global average increase of about 3.3 mm yr⁻¹ is established with high confidence, regional nuances and future ice‑sheet behavior introduce uncertainty that scientists are actively studying. Effective responses blend aggressive climate mitigation with locally tailored adaptation—ranging from ecosystem restoration to strategic retreat—recognizing that no single solution can address the complex, evolving challenge of rising oceans.
Frequently Asked Questions
What is the current global rate of sea‑level rise?
The global mean sea level is rising at roughly 3.3 mm per year, a figure derived from satellite altimetry records that began in 1992 and have been cross‑checked with tide‑gauge data.
Why does sea level rise faster in some regions than the global average?
Regional differences stem from land subsidence, ocean‑current dynamics, and gravitational redistribution of meltwater; for example, the U.S. Gulf Coast experiences rates up to 7 mm yr⁻¹ because of these combined factors.
What are the two main physical processes that drive sea‑level rise?
Thermal expansion of warming seawater and the addition of meltwater from glaciers and the Greenland and Antarctic ice sheets together account for the majority of observed sea‑level increase.
How certain are scientists about future sea‑level projections?
Scientists are highly confident that sea level will continue to rise, but uncertainties remain regarding the rate of Antarctic ice‑sheet loss and how regional factors will modify local sea‑level changes.
What actions can governments take to address sea‑level rise?
Governments can set strong emissions‑reduction targets, fund adaptive infrastructure for vulnerable coastlines, enforce zoning that limits development in high‑risk areas, and support research to improve monitoring and modelling of sea‑level change.




Leave a Comment