
Understanding how melting ice sheets contribute water to the oceans clarifies the scale of sea-level rise, the scientific confidence behind estimates, and what actions can limit future impacts.
Quick Answer
Ice sheets in Antarctica and Greenland hold about 26 million km³ of freshwater; if fully melted, they would raise global mean sea level by roughly 65 meters—seven meters from Greenland and up to 58 meters from Antarctica. Current observations show that ice-sheet loss adds about 0.8 mm yr⁻¹ to sea level, a fraction of the 3.3 mm yr⁻¹ total rise measured by satellite altimetry (IPCC AR6, 2021). While complete melt is unlikely this century, ongoing loss accelerates sea-level rise, especially for low-lying coastal regions.
Key Takeaways
- Antarctica and Greenland together store ~26 million km³ of freshwater, enough for ~65 meters of sea-level rise.
- Observed ice-sheet loss contributes ~0.8 mm yr⁻¹ to global sea level, based on satellite gravimetry (NASA GRACE, 2020‑2022).
- Most recent IPCC assessments assign high confidence to the accelerating trend of ice-sheet melt.
- Uncertainties remain about the timing of rapid ice-sheet dynamical changes, especially in West Antarctica.
- Mitigation of greenhouse-gas emissions and coastal adaptation are the two complementary pathways to limit future impacts.
What Is Ice Melt and Sea Level Rise: How Much Water Comes From Ice Sheets?
Ice melt refers to the conversion of solid ice into liquid water, primarily occurring on the surface of glaciers, ice caps, and the massive Antarctic and Greenland ice sheets. When meltwater reaches the ocean, it adds to global sea level. The term “ice sheets” designates the continental-scale ice masses that cover most of Antarctica and a large portion of Greenland, distinct from smaller mountain glaciers. Quantifying the water volume stored in these sheets is essential because it sets the upper bound for potential sea-level rise.
How Does It Work?
1. Surface Melting
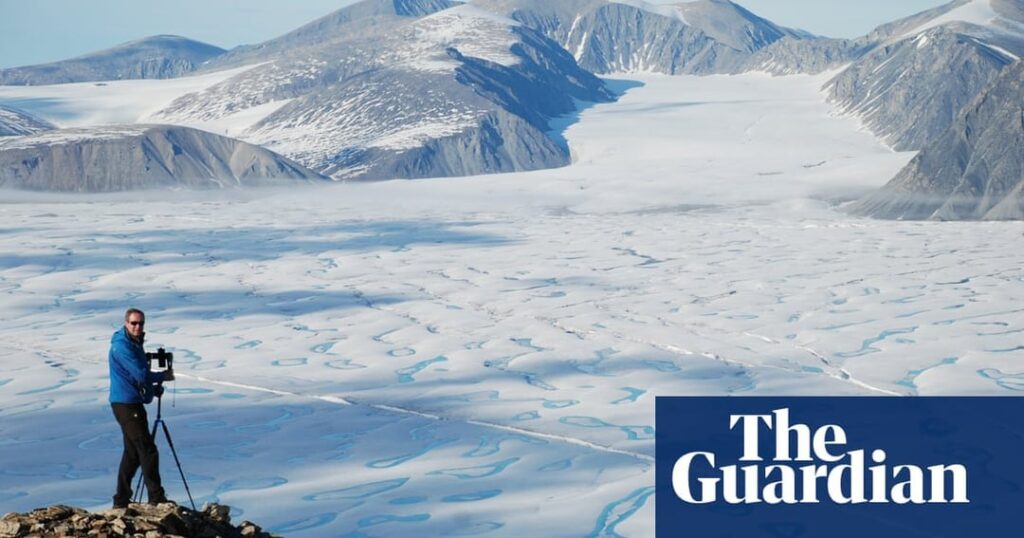
Rising air temperatures increase the amount of solar energy absorbed by ice surfaces, causing meltwater to form in summer months. This water can flow downhill, fill supraglacial lakes, and eventually reach the ocean through melt streams.
2. Ice-Shelf Disintegration
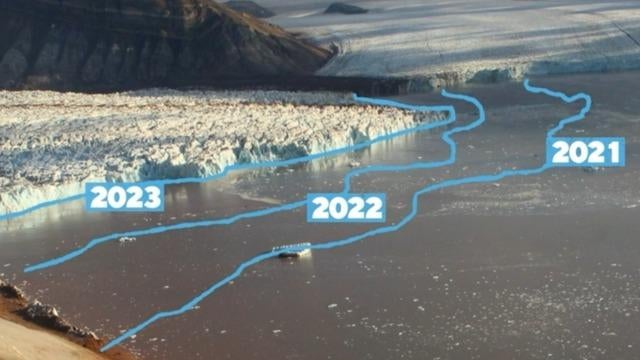
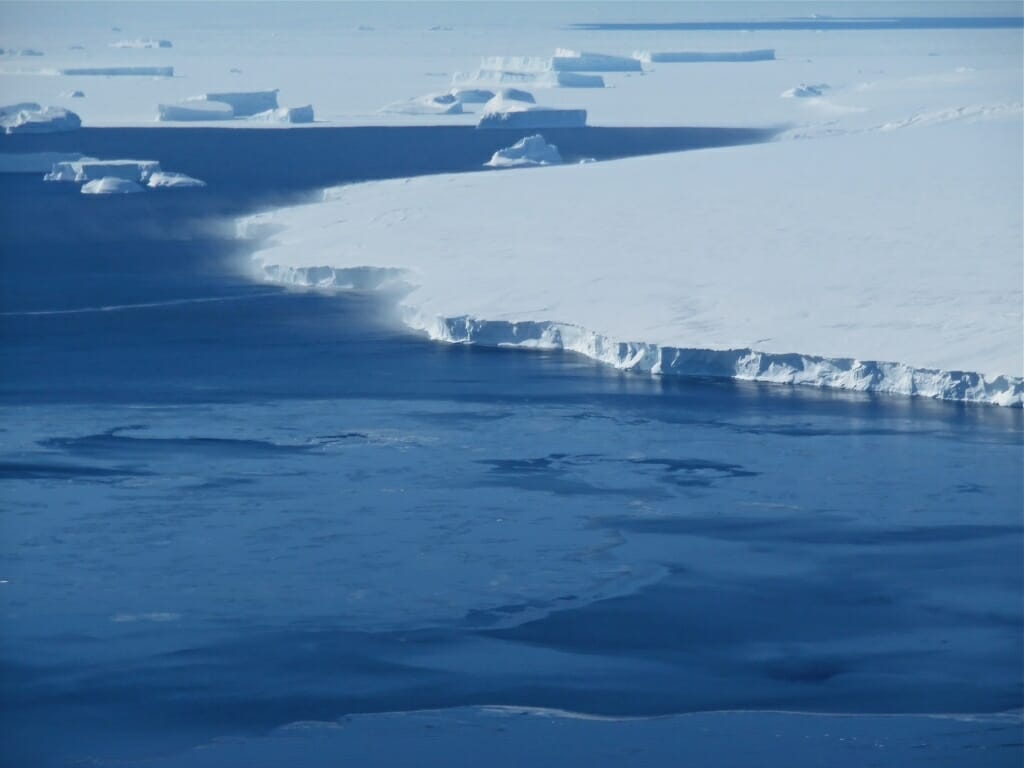
Ice shelves—floating extensions of the grounded ice sheet—act as buttresses. Warmer ocean waters erode their undersides, thinning them from below. When an ice shelf collapses, the inland ice loses friction, accelerating glacier flow toward the sea.
3. Dynamic Ice Flow
Gravity drives the grounded ice toward the coastline. As basal lubrication increases from meltwater penetrating crevasses, glaciers can speed up dramatically, a process documented in West Antarctica’s Pine Island and Thwaites glaciers.
4. Calving and Iceberg Production
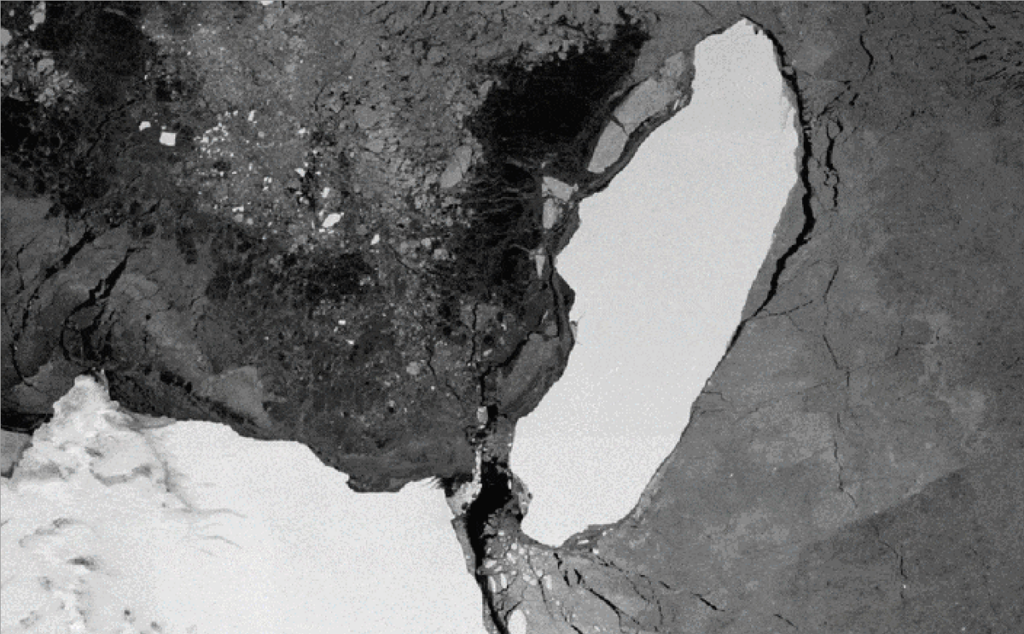
At the ocean front, glaciers fracture and shed icebergs. The mass of each iceberg eventually melts, adding its water content to sea level.
What Does the Evidence Show?
Multiple lines of evidence converge on a clear picture of accelerating ice-sheet loss:
- Satellite gravimetry: NASA’s GRACE mission (2002‑2020) measured a net mass loss of ~275 Gt yr⁻¹ from Greenland and ~150 Gt yr⁻¹ from Antarctica during 2003‑2019 (NASA, 2021).
- Altimetry: Radar and laser altimeters on ESA’s CryoSat‑2 and NASA’s ICESat‑2 record surface lowering of up to 1 m yr⁻¹ in fast-flowing Antarctic sectors (ESA, 2022).
- Field observations: Direct measurements of ice-sheet velocity show increases of 10‑30 % in several outlet glaciers over the past two decades (British Antarctic Survey, 2020).
- Ice-core and sea-level reconstructions: Paleo‑sea-level studies confirm that past complete melt of Greenland would have raised sea level by ~7 m, consistent with geological evidence (IPCC AR6, 2021).
These independent datasets—gravity, elevation, and velocity—provide strong, moderate, and emerging evidence that ice-sheet contributions to sea level are growing.
Main Causes or Drivers
Atmospheric Warming
Global mean surface temperature has risen about 1.1 °C since pre‑industrial times (IPCC AR6, 2021). Higher temperatures increase surface melt and drive atmospheric circulation patterns that bring warm air onto ice sheets.
Oceanic Warming
Warmer circumpolar deep water reaches the underside of Antarctic ice shelves, thinning them from below. Ocean temperature records show a 0.2 °C increase in the Southern Ocean bottom layer since the 1990s (NOAA, 2020).
Feedback Mechanisms
Albedo feedback—loss of bright ice surface reveals darker ocean or land, absorbing more solar radiation—amplifies regional warming. Meltwater can also lubricate the base of glaciers, hastening flow.
Natural Variability
El Niño‑Southern Oscillation and the Southern Annular Mode modulate short‑term melt rates, but the long‑term trend is dominated by anthropogenic warming.
Environmental and Human Impacts
Environmental Impacts
Rising seas inundate coastal wetlands, shift marine habitats, and increase ocean acidification through altered circulation. Loss of ice shelves reduces the formation of cold, dense water that drives global thermohaline circulation.
Human Health and Social Impacts
Coastal flooding threatens freshwater supplies with saltwater intrusion, raising risks of water‑borne diseases. Displacement of low‑lying populations can exacerbate mental‑health stressors.
Economic and Infrastructure Impacts
Every centimeter of sea‑level rise adds roughly US$1 trillion in global coastal‑property risk (World Bank, 2021). Infrastructure such as ports, power plants, and transportation networks face higher repair costs and reduced lifespan.
Regional Differences
Ice-sheet contributions are global, but impacts are felt locally:
- North America: The Atlantic seaboard and Gulf Coast experience amplified flood risk due to land subsidence combined with sea-level rise.
- Southeast Asia: Low‑lying delta regions like the Mekong and Ganges are vulnerable to both sea-level rise and increased storm surges.
- Pacific Islands: Nations such as Kiribati confront existential threats from even modest sea-level increments.
- Antarctica: West Antarctic ice streams show the fastest dynamical response, while East Antarctica remains relatively stable, illustrating intra‑regional variability.
What Scientists Know With High Confidence
- Greenland and Antarctica together hold enough ice to raise global sea level by ~65 meters if fully melted.
- Ice-sheet mass loss has accelerated over the past two decades, contributing roughly 0.8 mm yr⁻¹ to sea-level rise.
- Atmospheric and oceanic warming are the primary drivers of increased melt rates.
- Sea level is rising at a measurable rate (≈3.3 mm yr⁻¹) from a combination of thermal expansion and ice-sheet melt.
What Remains Uncertain
Key uncertainties revolve around the timing and magnitude of rapid dynamical changes in the Antarctic Ice Sheet, especially the potential collapse of the West Antarctic ice-shelf system. Model projections differ because of limited observations beneath ice shelves and incomplete understanding of sub‑glacial hydrology. These gaps affect predictions of sea-level rise beyond 2100, but they do not alter the high‑confidence finding that ice-sheet loss is already accelerating.
Common Misconceptions
Misconception: All sea-level rise comes from melting ice.
Reality: Thermal expansion of warming seawater accounts for roughly one-third of observed sea-level rise; the remaining two-thirds stem from land‑ice loss, including glaciers, ice sheets, and groundwater extraction.
Misconception: The ice sheets will melt completely within this century.
Reality: Current climate scenarios suggest that full loss of the Antarctic Ice Sheet would take many centuries to millennia; however, significant contributions (several meters) could occur by 2100 under high-emission pathways.
Misconception: Sea-level rise is uniform worldwide.
Reality: Gravitational and rotational effects cause regional variations; for example, the loss of mass from Greenland actually lowers sea level locally while raising it elsewhere.
Solutions and Limitations
Addressing ice-sheet melt requires both mitigation of greenhouse-gas emissions and adaptation to inevitable sea-level rise.
- Mitigation: Rapid decarbonization limits future warming, reducing the long-term melt potential. The limitation is the need for global policy coordination and massive infrastructure transition.
- Adaptation: Coastal defenses (e.g., sea walls, managed retreat) protect vulnerable communities. These measures are costly, may have ecological trade‑offs, and are not feasible everywhere.
- Monitoring and Research: Continued satellite observation (e.g., NASA’s ICESat‑2) improves predictions. Funding constraints and harsh polar conditions limit data collection.
What Individuals, Communities, and Governments Can Do
What Individuals Can Do
Support policies that accelerate clean-energy transition, reduce personal carbon footprints where possible, and engage in local climate‑resilience planning (e.g., advocating for flood‑risk maps).
What Communities and Organizations Can Do
Invest in nature-based solutions such as mangrove restoration, which buffers storm surge, and develop zoning regulations that discourage new construction in high‑risk zones.
What Governments Can Do
Implement ambitious emissions-reduction targets consistent with the Paris Agreement, fund long-term polar research, and integrate sea-level projections into infrastructure design standards.
Closing Synthesis
Melting ice sheets are a major, measurable source of sea-level rise, with Antarctica and Greenland together holding enough water to raise oceans by tens of meters. High-confidence evidence confirms that melt rates are accelerating, driven primarily by atmospheric and oceanic warming. Uncertainties persist around rapid dynamical responses, especially in West Antarctica, but they do not negate the urgent need for mitigation and adaptation. By reducing emissions, enhancing monitoring, and planning resilient coastal systems, societies can limit the most severe outcomes while preparing for the changes already set in motion.
Frequently Asked Questions
How much water is stored in the Antarctic and Greenland ice sheets?
The Antarctic and Greenland ice sheets together contain about 26 million km³ of freshwater, which is enough to raise global sea level by roughly 65 meters if fully melted.
What is the current rate at which ice sheets are losing mass?
Satellite observations show that ice-sheet loss currently adds about 0.8 mm per year to global sea level, representing a net mass loss of roughly 425 gigatonnes per year from both Antarctica and Greenland.
Why does sea-level rise vary from one region to another?
Regional variations arise from gravitational and rotational effects of mass redistribution, land subsidence, ocean dynamics, and local climate factors, causing some areas to experience higher or lower relative sea-level changes.
What are the biggest uncertainties about future ice-sheet melt?
The most important uncertainties involve the timing and magnitude of rapid dynamical changes in West Antarctica, limited observations beneath ice shelves, and how sub‑glacial hydrology may accelerate melt.
What actions can reduce the risk of sea-level rise caused by ice melt?
Reducing greenhouse‑gas emissions to limit warming, investing in coastal adaptation such as flood defenses and managed retreat, and supporting continuous satellite monitoring are the most effective ways to mitigate risk.





Leave a Comment