
The capacity factor of a wind farm measures how much electricity it actually generates compared with its maximum possible output, and it is shaped by wind resources, turbine technology, site conditions, grid interactions, and regulatory and social factors.
Quick Answer
A wind farm’s capacity factor is the ratio of its actual annual energy production to the energy it would produce if it ran at full rated power all the time. It depends primarily on the statistical distribution of wind speeds at the site, the turbine’s power‑curve and hub height, local topography, atmospheric stability, and operational constraints such as curtailment or maintenance downtime. High‑quality, steady winds and modern, well‑sited turbines raise the factor, while turbulent terrain, low‑speed periods, frequent outages, or grid limits lower it. Uncertainty remains around future climate‑driven wind changes and the exact impact of regulatory curtailment.
Key Takeaways
- Capacity factor reflects the real‑world efficiency of a wind farm, not just turbine name‑plate capacity.
- Average wind speed and its cubic relationship to power make small speed changes highly impactful.
- Site selection—elevation, terrain, and proximity to coastlines—strongly influences available wind energy.
- Turbine design (rotor size, hub height, control systems) determines how much of the wind resource can be captured.
- Grid constraints, curtailment policies, and maintenance schedules can reduce the theoretical maximum output.
What Is What Determines the Capacity Factor of a Wind Farm??
The capacity factor is a performance metric expressed as a percentage. It is calculated by dividing the total kilowatt‑hours (kWh) generated in a year by the product of the farm’s installed capacity (in kW) and the total hours in a year (8,760). For example, a 100‑MW farm that produces 300,000 MWh in a year has a capacity factor of 34 % (300,000 MWh ÷ (100 MW × 8,760 h)). The term differs from “capacity utilisation” or “availability” because it incorporates both the physical wind resource and operational realities, not merely whether the turbine is mechanically ready.
How Does It Work?
1. Wind Speed Distribution
Wind turbines convert kinetic energy to electricity according to a power‑curve that rises sharply with wind speed until reaching the rated power, then plateaus, and finally cuts out at very high speeds. Because the power output scales with the cube of wind speed, the probability distribution of wind speeds at a site (often modelled with a Weibull distribution) is the primary driver of annual energy production.
2. Turbine Design and Hub Height
Modern turbines have larger rotors and can be mounted on towers 100 m or taller. Higher hub heights encounter smoother, faster winds because surface friction decreases with altitude. Larger rotors increase the swept area, capturing more energy at lower speeds. Control technologies such as variable‑speed drives and pitch control optimise the power‑curve for a given wind regime.
3. Topography and Atmospheric Stability
Mountains, valleys, and coastal features channel or block wind. Rough terrain creates turbulence that can reduce turbine efficiency, while smooth, open plains or offshore sites often provide steadier flows. Atmospheric stability—whether the air column is well‑mixed or stratified—affects vertical wind shear and therefore the effective wind speed at hub height.
4. Operational Factors
Planned maintenance, unplanned faults, and grid‑related curtailment (when operators must reduce output to keep the grid stable) directly lower the capacity factor. Curtailment is more common in regions with limited transmission capacity or when renewable generation exceeds demand.
What Does the Evidence Show?
Long‑term monitoring by national meteorological agencies (e.g., NOAA, the UK Met Office) demonstrates that sites with mean annual wind speeds above 7 m s⁻¹ typically achieve capacity factors of 35–45 %, whereas lower‑speed sites (<5 m s⁻¹) rarely exceed 20 % (International Energy Agency, 2022). Peer‑reviewed assessments confirm that increasing hub height from 80 m to 120 m can raise capacity factor by 5–10 % in the same wind regime (Renewable Energy, 2021). Systematic reviews of offshore wind farms show average capacity factors around 45–55 % because offshore winds are stronger and less turbulent (IEA, 2023). Studies of curtailment in Europe indicate that grid constraints can reduce annual output by up to 8 % in heavily constrained zones (European Network of Transmission System Operators, 2020).
Main Causes or Drivers
Direct Causes
- Statistical wind speed distribution at the site.
- Turbine power‑curve and hub‑height selection.
- Mechanical availability (maintenance, faults).
- Grid‑related curtailment.
Underlying Drivers
- Regional climate patterns that set baseline wind regimes.
- Topographic features that modify wind flow.
- Policy frameworks governing curtailment and renewable integration.
- Investment decisions that affect turbine technology choice.
Environmental and Human Impacts
Environmental Impacts
Higher capacity factors mean more electricity from wind per installed megawatt, reducing the need for additional land, materials, and associated life‑cycle emissions. Conversely, low capacity factors can lead to larger overall wind‑farm footprints to meet energy targets, potentially increasing habitat disturbance.
Human Health and Social Impacts
Reliable wind output supports grid stability and can lower reliance on fossil‑fuel plants, improving air quality and public health. However, frequent curtailment can frustrate local communities that expected economic benefits, influencing social acceptance.
Economic and Infrastructure Impacts
Investors evaluate projects based on expected capacity factor; higher values improve revenue forecasts and reduce levelised cost of electricity (LCOE). Grid operators must plan transmission capacity to accommodate peak wind generation, and under‑utilised farms may represent stranded assets.
Regional Differences
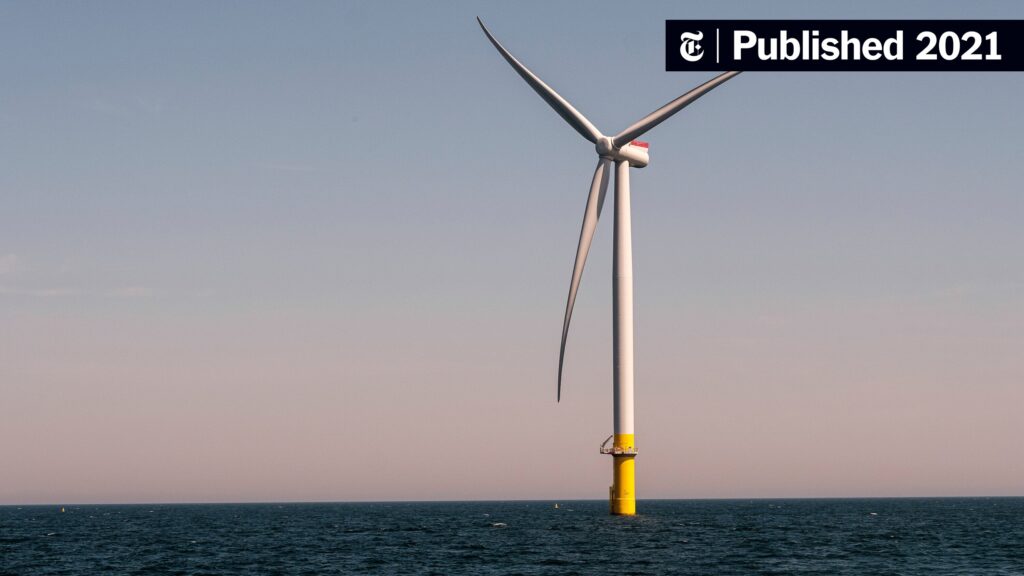
Offshore wind farms in the North Sea routinely achieve capacity factors above 50 % because of persistent, high‑speed winds and deep‑water sites with minimal turbulence. In contrast, inland farms in the central United States often average 30–35 % due to more variable wind and greater surface roughness. Tropical regions, where trade winds dominate, can reach 35–40 % if turbines are sited on coastal ridges, whereas mountainous areas in the Andes may suffer from wind shadowing, reducing factors below 20 %.
What Scientists Know With High Confidence
- The power generated by a turbine scales with the cube of wind speed, making wind speed distribution the dominant factor.
- Increasing hub height and rotor diameter consistently improves capacity factor across wind regimes.
- Offshore sites generally deliver higher capacity factors than comparable onshore locations.
- Mechanical availability and grid curtailment are measurable contributors to reduced capacity factor.
What Remains Uncertain
Future changes in regional wind patterns due to climate change are still being quantified; some models suggest modest increases in mean wind speed in certain mid‑latitude basins, while others project greater variability. The exact economic impact of emerging curtailment policies in rapidly decarbonising grids also lacks long‑term empirical data. Improved high‑resolution wind‑resource modelling could narrow these gaps.
Common Misconceptions
Misconception: Capacity factor is the same as turbine availability.
Reality: Availability measures the time a turbine is physically able to run; capacity factor also incorporates the wind resource and grid constraints.
Misconception: A higher name‑plate capacity always means more energy output.
Reality: Without sufficient wind, a large‑capacity farm can have a lower capacity factor and produce less energy than a smaller, better‑sited project.
Misconception: Offshore wind always outperforms onshore wind.
Reality: While offshore sites often have higher average winds, higher installation costs and longer transmission distances can affect overall system efficiency and economics.
Solutions and Limitations
- Improved site assessment: High‑resolution wind mapping reduces the risk of low‑capacity‑factor projects, but data collection can be costly and time‑consuming.
- Advanced turbine technology: Taller towers and larger rotors raise capacity factors, yet they increase material use and may face stricter permitting.
- Grid reinforcement and storage: Expanding transmission and adding batteries can lower curtailment, but require significant capital investment and regulatory coordination.
- Adaptive operation strategies: Real‑time forecasting and flexible dispatch can optimise output, though forecasting errors remain a challenge.
What Individuals, Communities, and Governments Can Do
What Individuals Can Do
Support policies that fund high‑quality wind‑resource studies and encourage transparent reporting of capacity‑factor data for new projects.
What Communities and Organizations Can Do
Engage early in siting processes, provide local knowledge of micro‑climate conditions, and collaborate with developers to design layouts that minimise turbulence and maximize wind capture.
What Governments Can Do
Invest in offshore transmission corridors, streamline permitting for taller turbines where appropriate, and create market mechanisms that reward higher capacity‑factor performance, such as performance‑based contracts.
Synthesis
The capacity factor of a wind farm is a composite indicator that reflects wind resource quality, turbine technology, terrain, atmospheric stability, and operational constraints. Strong scientific evidence confirms the central role of wind speed distribution and hub‑height design, while uncertainties remain around climate‑driven wind changes and future curtailment policies. By improving site assessment, advancing turbine design, and strengthening grid integration, stakeholders can raise capacity factors and make wind power a more reliable, low‑carbon energy source.
Frequently Asked Questions
What is the definition of capacity factor for a wind farm?
Capacity factor is the ratio of a wind farm’s actual annual electricity generation to the amount it would produce if it operated at its full rated power for every hour of the year.
Why does wind speed have such a strong influence on capacity factor?
Because turbine power output scales with the cube of wind speed, even small increases in average wind speed dramatically raise the amount of electricity a turbine can generate, boosting the capacity factor.
How do hub height and rotor size affect a wind farm’s capacity factor?
Higher hub heights encounter smoother, faster winds, and larger rotors sweep a greater area, allowing turbines to capture more energy at lower wind speeds, which typically raises the capacity factor.
What role does curtailment play in reducing capacity factor?
Curtailment—when a grid operator limits wind output to maintain system balance—directly reduces the total energy produced, lowering the capacity factor regardless of wind availability.
Can offshore wind farms achieve higher capacity factors than onshore farms?
Yes; offshore sites usually experience stronger, more consistent winds and less turbulence, leading to average capacity factors of 45–55 % compared with 30–35 % for many onshore installations.





Leave a Comment