

Real‑world observations—from melting ice caps to shifting species ranges—provide clear, measurable proof that global warming is occurring and affecting ecosystems and societies worldwide.
\n\n
Quick Answer
\n
Global warming refers to the long‑term rise in Earth’s average surface temperature caused primarily by human‑driven increases in greenhouse gases such as carbon dioxide and methane. The warming triggers feedbacks in the atmosphere, oceans, and land, leading to observable changes like ice loss, sea‑level rise, and more frequent extreme weather. Scientists across multiple disciplines agree that these changes are already altering ecosystems, water resources, and human health, although precise future impacts depend on emissions pathways.
\n
\n\n
Key Takeaways
\n
- \n
- Instrumental records show a global average temperature increase of about 1.1 °C since the pre‑industrial era (1850‑1900).
- Satellite and ground observations confirm accelerating ice loss in Greenland, Antarctica, and mountain glaciers.
- Warming oceans are driving coral bleaching, sea‑level rise, and shifts in marine species distributions.
- Terrestrial ecosystems are responding with earlier springs, northward species migrations, and increased wildfire risk.
- Human health, food security, and coastal infrastructure are already experiencing climate‑related stress.
\n
\n
\n
\n
\n
\n
\n\n
What Is Real‑World Evidence of Global Warming?
\n
Real‑world evidence consists of measurable, repeatable observations that directly reflect changes in the Earth system. These include temperature records, ice‑mass balance data, sea‑level tide‑gauge readings, phenological shifts in plants and animals, and the frequency of extreme events. Unlike model projections, these data are collected by independent monitoring programs and provide a concrete basis for assessing whether the climate is changing.
\n\n
How Does Global Warming Manifest in the Physical System?
\n
1. Greenhouse‑Gas Forcing
\n
Increasing concentrations of carbon dioxide (CO₂), methane (CH₄), and nitrous oxide (N₂O) trap additional infrared radiation, raising the planet’s energy budget. The Intergovernmental Panel on Climate Change (IPCC) reports that CO₂ levels rose from 280 ppm in 1750 to 419 ppm in 2023, a 50 % increase.
\n
2. Surface‑Temperature Response
\n
More trapped heat raises surface temperatures, which are recorded by a global network of thermometers and satellite sensors. The World Meteorological Organization notes that the ten warmest years on record have all occurred since 2005.
\n
3. Cryosphere Feedbacks
\n
Warmer air and ocean temperatures melt glaciers, ice sheets, and sea ice. Meltwater reduces surface albedo (reflectivity), causing further warming—a positive feedback loop.
\n
4. Oceanic and Atmospheric Circulation Changes
\n
Heat absorbed by the oceans expands seawater (thermal expansion) and alters circulation patterns, influencing storm tracks and precipitation regimes.
\n\n
What Does the Evidence Show?
\n
Multiple, independent lines of evidence converge on the same conclusion:
\n
- \n
- Temperature Records: The NOAA Global Historical Climatology Network shows a global land‑surface temperature rise of 0.18 °C per decade from 1981‑2010.
- Ice‑Mass Loss: NASA’s Gravity Recovery and Climate Experiment (GRACE) satellites measured a net loss of 3.8 trillion metric tons of ice from the Greenland ice sheet between 1992 and 2020.
- Sea‑Level Rise: Tide‑gauge and satellite altimetry data indicate a global mean sea‑level increase of 3.3 mm per year from 1993‑2022.
- Extreme Weather: Attribution studies in journals such as *Nature Climate Change* link the increased intensity of hurricanes, heatwaves, and Western‑U.S. wildfires to higher atmospheric moisture and warmer sea surface temperatures.
- Biological Shifts: Long‑term phenology networks document earlier flowering in temperate zones by 2–3 days per decade, and bird‑migration data from the Audubon Society show a 1.5 km northward shift per decade for many species.
\n
\n
\n
\n
\n
\n\n
Main Causes or Drivers
\n
Direct Human Drivers
\n
Fossil‑fuel combustion for energy, transportation, and industry releases the bulk of anthropogenic CO₂. Agriculture contributes methane from livestock and rice paddies, while land‑use change (deforestation) reduces carbon sinks.
\n
Underlying Socio‑Economic Drivers
\n
Population growth, urbanization, and economic development increase demand for energy and food, reinforcing emissions. Global trade and supply‑chain structures often lock in high‑carbon pathways.
\n
Natural Modulators
\n
Volcanic eruptions, solar variability, and internal climate oscillations (e.g., El Niño) modulate temperature trends but cannot explain the long‑term upward trajectory observed over the past century.
\n\n
Environmental and Human Impacts
\n
Environmental Impacts
\n
- \n
- Accelerated glacier retreat reduces freshwater availability for downstream communities.
- Coral bleaching events have increased in frequency; the Great Barrier Reef experienced three mass‑bleaching episodes between 2016‑2022.
- Shifts in species’ geographic ranges alter community composition and can lead to local extinctions.
- Permafrost thaw releases additional greenhouse gases, creating a feedback loop.
\n
\n
\n
\n
\n
Human Health and Social Impacts
\n
- \n
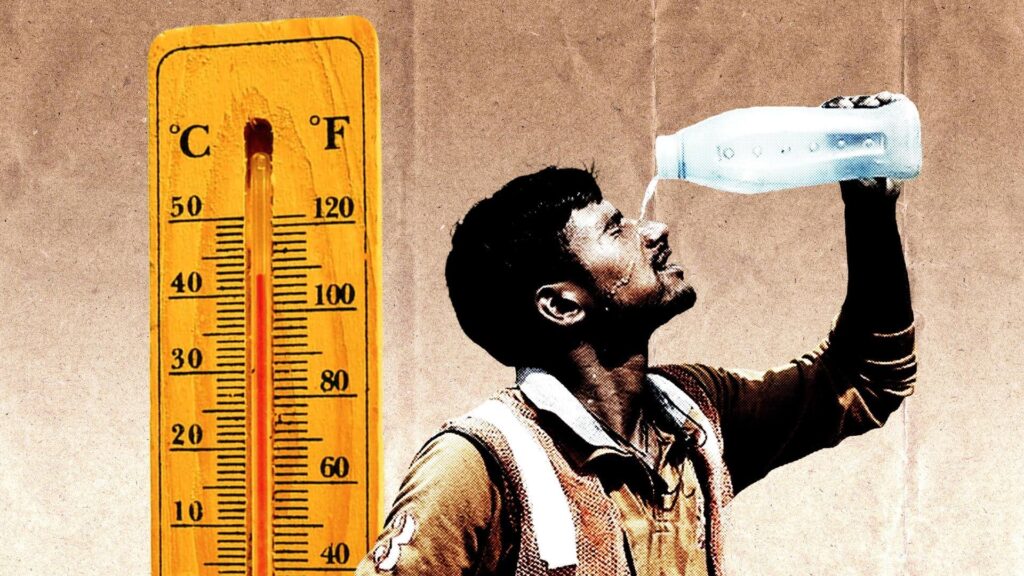
- Heatwaves raise mortality risk, especially for older adults and outdoor workers; the 2003 European heatwave resulted in an estimated 70,000 excess deaths.
- Warmer climates expand the habitats of disease‑carrying vectors, increasing dengue and malaria incidence in temperate regions.
- Sea‑level rise threatens coastal housing, infrastructure, and livelihoods, prompting migration in low‑lying nations.
\n
\n
\n
\n
Economic and Infrastructure Impacts
\n
- \n
- Increased frequency of extreme storms leads to higher insurance losses; U.S. NOAA estimates $45 billion in damage from hurricanes between 2017‑2021.
- Agricultural yields for wheat and maize are projected to decline by 6 % and 3 % respectively per °C of warming under current practices.
\n
\n
\n\n
Regional Differences
\n
While the warming trend is global, its expression varies:
\n
- \n
- Arctic: Temperature increase exceeds the global average by up to threefold, driving rapid sea‑ice loss.
- Tropics: Increased precipitation intensity leads to more severe flooding, but some regions experience prolonged drought.
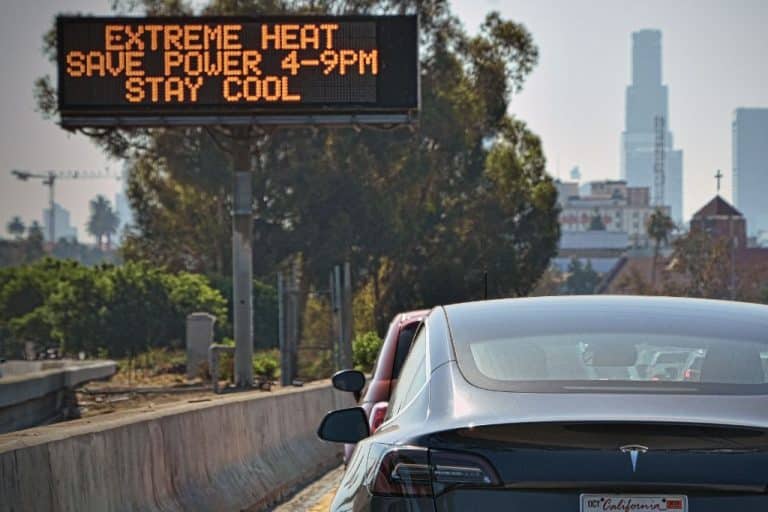
- Mid‑Latitudes: Heatwaves become more common, and wildfire seasons lengthen, as seen in California, Australia, and the Mediterranean.
- Small Island Developing States: Even modest sea‑level rise (10‑20 cm) threatens freshwater lenses and habitability.
\n
\n
\n
\n
\n\n
What Scientists Know With High Confidence
\n
- \n
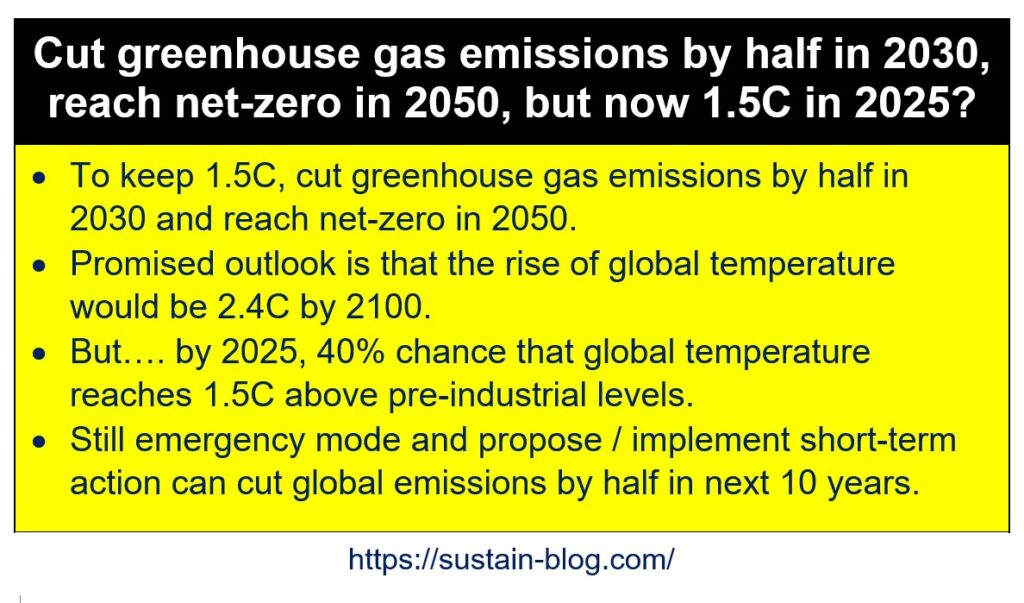
- The Earth’s average surface temperature has risen about 1.1 °C since the pre‑industrial era.
- Human activities, especially fossil‑fuel combustion, are the dominant cause of observed warming since the mid‑20th century.
- Ice‑mass loss from Greenland, Antarctica, and mountain glaciers is accelerating.
- Sea level is rising due to thermal expansion and ice melt, at a rate of roughly 3 mm per year.
- Warming is linked to increased frequency and intensity of heatwaves, heavy precipitation, and some categories of extreme storms.
\n
\n
\n
\n
\n
\n
\n\n
What Remains Uncertain
\n
Key uncertainties relate to the magnitude of future feedbacks and regional climate responses. The rate at which permafrost will release carbon, the exact contribution of cloud changes, and the sensitivity of tropical cyclone intensity to warming are still active research areas. These gaps affect projections of sea‑level rise beyond 2100 and the precise timing of ecosystem thresholds, but they do not alter the core conclusion that the climate is warming.
\n
\n\n
Common Misconceptions
\n
Misconception: “A single hot summer proves global warming.”
\n
Reality: Climate change is assessed over decades; individual weather events are influenced by natural variability, though attribution studies can link trends in event frequency to warming.
\n
Misconception: “The climate has always changed, so today’s changes are natural.”
\n
Reality: While the Earth’s climate has varied over geological time, the rapid temperature increase of the past century exceeds natural rates and aligns with the unprecedented rise in greenhouse‑gas concentrations.
\n
Misconception: “The Antarctic is gaining ice, so the planet is cooling.”
\n
Reality: Some interior Antarctic regions have experienced snowfall gains, but overall mass balance shows net loss, especially on the West Antarctic Ice Sheet, contributing to sea‑level rise.
\n
Misconception: “Renewable energy cannot meet global demand.”
\n
Reality: Multiple integrated assessment models demonstrate that a mix of wind, solar, hydro, and storage can supply the majority of electricity demand while reducing emissions, though transition speed depends on policy and investment.
\n
Misconception: “Individual lifestyle changes are enough to stop warming.”
\n
Reality: Personal actions matter for building demand for low‑carbon goods, but systemic changes in energy systems, land use, and industry are required to achieve the emission reductions needed for the Paris Agreement goals.
\n
\n\n
Solutions and Limitations
\n
Effective responses combine mitigation (reducing greenhouse‑gas emissions) and adaptation (preparing for unavoidable changes).
\n
- \n
- Decarbonizing Energy: Shifting from coal to renewables cuts CO₂ emissions, but intermittency requires grid upgrades and storage solutions.
- Improving Energy Efficiency: Buildings and appliances can reduce demand by 20‑30 %, yet retrofitting costs and occupant behavior affect outcomes.
- Land‑Use Management: Reforestation and avoided deforestation increase carbon sinks, but land competition for food and bioenergy creates trade‑offs.
- Climate‑Smart Agriculture: Practices such as no‑till farming and precision irrigation lower emissions and enhance resilience, though adoption depends on farmer access to technology and financing.
- Infrastructure Adaptation: Elevating coastal defenses and redesigning drainage systems reduce exposure, but they are costly and may only be viable for wealthier regions.
\n
\n
\n
\n
\n
\n\n
What Individuals, Communities, and Governments Can Do
\n
What Individuals Can Do
\n
- \n
- Choose low‑carbon transportation (public transit, cycling, electric vehicles) where feasible.
- Reduce home energy use through insulation, efficient appliances, and smart thermostats.
- Support policies and companies that prioritize renewable energy and sustainable supply chains.
- Engage in local climate action groups to amplify community resilience efforts.
\n
\n
\n
\n
\n
What Communities and Organizations Can Do
\n
- \n
- Develop climate‑action plans that include renewable energy targets, green infrastructure, and emergency preparedness.
- Invest in community solar projects and energy‑efficiency retrofits for public buildings.
- Promote climate‑smart land use, such as urban tree planting and protected green spaces.
\n
\n
\n
\n
What Governments Can Do
\n
- \n
- Implement carbon pricing or emissions‑trading schemes to internalize climate costs.
- Set and enforce ambitious renewable‑energy standards and phase‑out coal subsidies.
- Fund research, monitoring networks, and early‑warning systems for extreme events.
- Support climate‑resilient agriculture and water‑resource management in vulnerable regions.
\n
\n
\n
\n
\n\n
Synthesis
\n
Observed temperature rise, ice loss, sea‑level increase, and ecological shifts together form a robust body of evidence that global warming is already happening. Human activities are the primary driver, and the resulting impacts are already affecting ecosystems, health, and economies worldwide. While uncertainties remain regarding the speed of certain feedbacks, the high‑confidence findings are sufficient to justify immediate mitigation and adaptation actions across all levels of society.
Frequently Asked Questions
What is global warming?
Global warming is the long‑term increase in Earth’s average surface temperature caused mainly by rising concentrations of greenhouse gases such as carbon dioxide and methane from human activities.
How do scientists know the planet is warming?
Scientists rely on multiple independent data sets—instrumental temperature records, satellite observations, ice‑mass measurements, sea‑level gauges, and ecological phenology studies—all showing consistent upward trends over decades.
What are the most visible signs of climate change?
Key observable signs include accelerating ice loss in Greenland and Antarctica, rising global sea level, more frequent and intense heatwaves, increased coral bleaching, and northward shifts in plant and animal distributions.
In what ways does global warming affect human health?
Higher temperatures increase heat‑related illness and mortality, expand the range of disease‑carrying insects, and exacerbate air‑quality problems, while extreme weather events can disrupt health‑care services.
What actions can individuals take to help address global warming?
Individuals can lower their carbon footprint by choosing low‑carbon transport, improving home energy efficiency, supporting clean‑energy policies, and participating in community climate initiatives.






Leave a Comment