
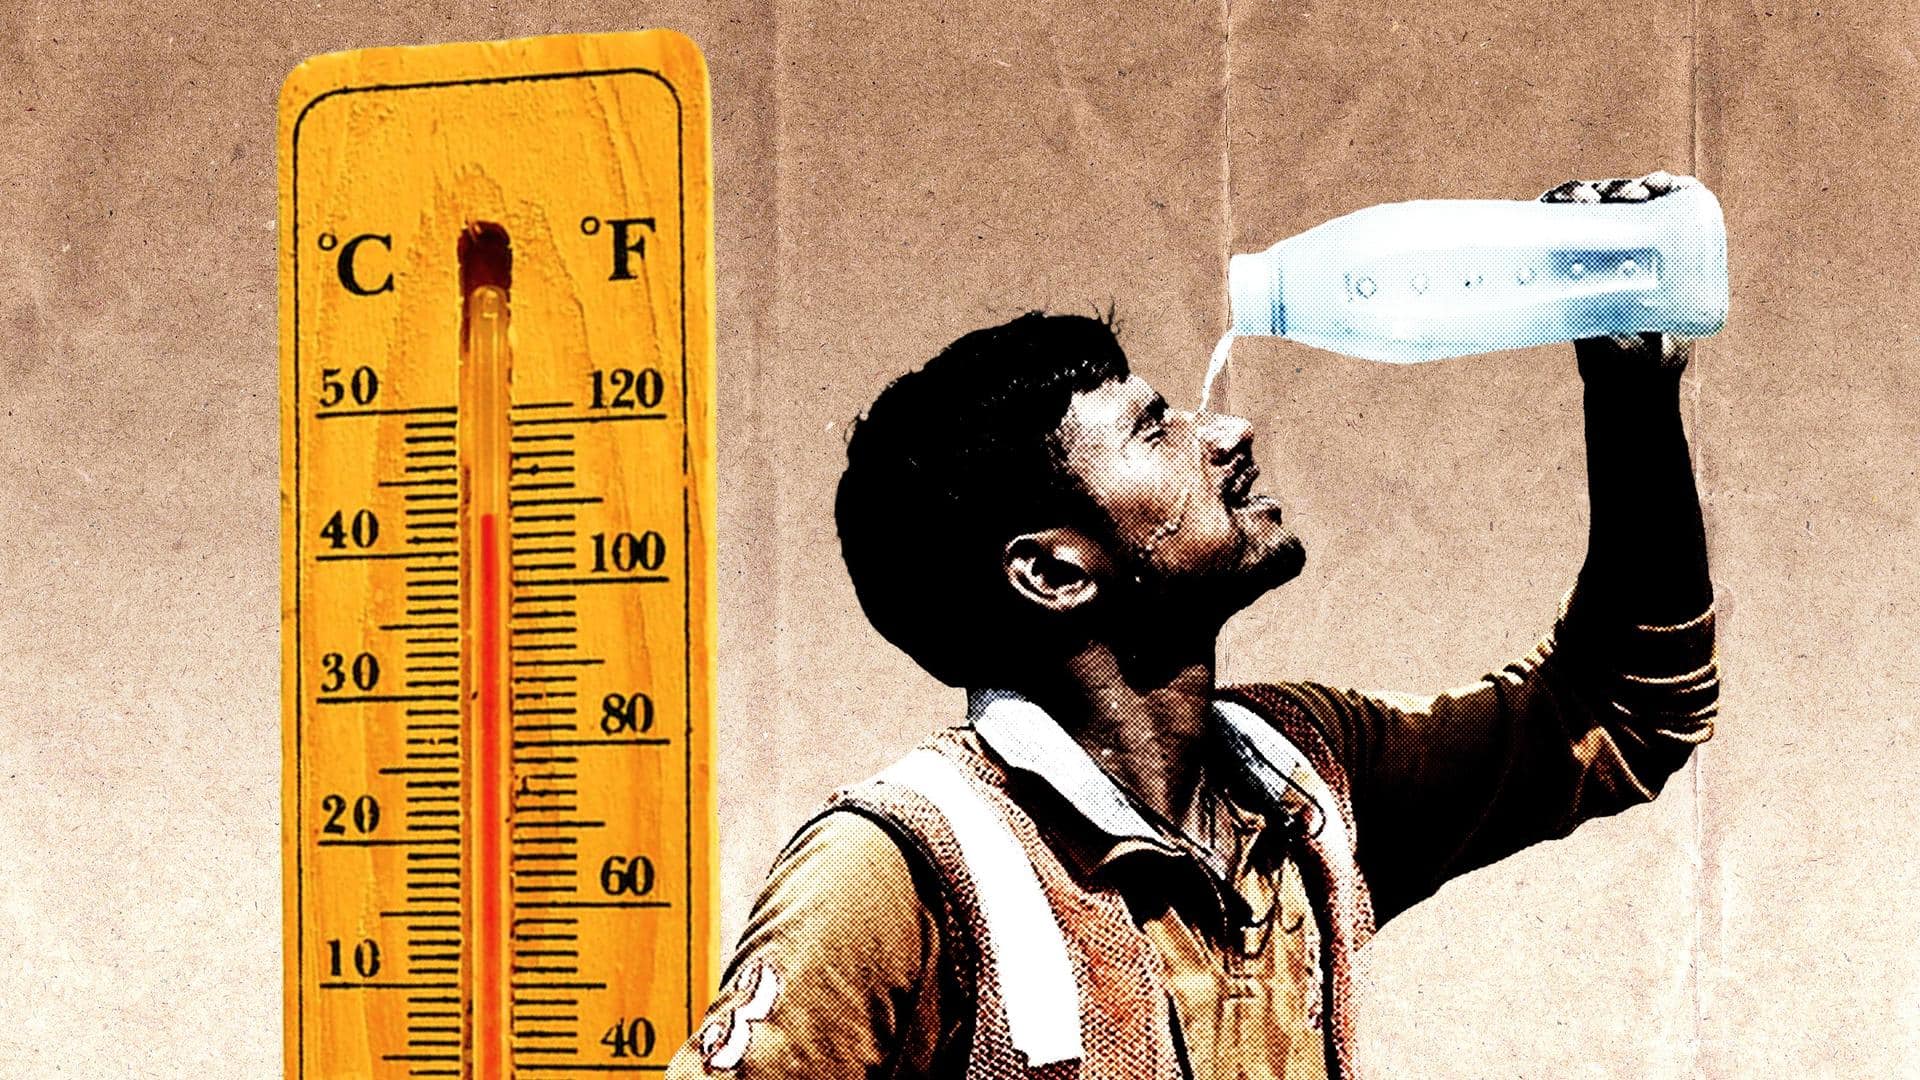
2025 ranks among the seven hottest years on record, underscoring accelerating global warming and its widening impacts on ecosystems, human health, and economies worldwide.
Quick Answer
2025 is projected to be one of the seven warmest years since reliable global temperature records began in 1880, reflecting a persistent upward trend driven primarily by increased greenhouse‑gas concentrations. The warming is measured as an anomaly relative to the 1951‑1980 baseline, with most datasets showing a global mean temperature about 1.2°C above that reference period. This rise amplifies heat‑wave frequency, stresses water resources, and threatens biodiversity. While the exact ranking may shift as new data are integrated, the scientific consensus is that the world is on a trajectory toward more frequent record‑breaking heat years, with uncertainty mainly in regional extremes and future emissions pathways.
Key Takeaways
- 2025 is expected to rank within the top seven warmest years on record, confirming a long‑term warming trend.
- Human‑driven greenhouse‑gas emissions are the dominant cause; natural variability plays a secondary role.
- Heat extremes affect ecosystems (coral bleaching, forest stress) and human societies (mortality, productivity loss).
- Impacts differ by region: low‑latitude zones face intensified drought, while high‑latitude areas experience rapid ice melt.
- Effective responses combine rapid mitigation, targeted adaptation, and equitable policy implementation.
What Is 2025 Among the Seven Hottest Years Ever Recorded?
The phrase refers to the statistical ranking of the global annual mean surface temperature for the calendar year 2025 against the historical record that spans more than a century. Temperature records are compiled by agencies such as the National Oceanic and Atmospheric Administration (NOAA) and the World Meteorological Organization (WMO), which adjust raw measurements for changes in instrumentation and observational coverage. A year is deemed “one of the hottest” when its temperature anomaly—typically expressed in degrees Celsius above the 1951‑1980 average—places it within the top tier of the dataset. This metric differs from short‑term weather events; it captures climate‑scale change.
How Does It Work?
Physical Process Behind Global Warming
- Greenhouse‑gas emissions: Burning fossil fuels, deforestation, and industrial processes release carbon dioxide (CO₂), methane (CH₄), and nitrous oxide (N₂O) into the atmosphere.
- Radiative forcing: These gases trap outgoing infrared radiation, creating a net energy imbalance that warms the planet.
- Ocean and land heat uptake: Excess energy is absorbed by oceans (≈90%) and land surfaces, raising global average temperatures.
- Feedback mechanisms: Warmer air holds more moisture, amplifying greenhouse effect; melting ice reduces albedo, further increasing absorption of solar radiation.
- Temperature anomaly calculation: Observations are averaged globally and compared to a baseline period; the resulting anomaly determines the year’s rank.
Why Records Show a Rising Trend
Since the pre‑industrial era, atmospheric CO₂ concentrations have risen from roughly 280 ppm to over 420 ppm (NOAA, 2024). The Intergovernmental Panel on Climate Change (IPCC) reports that each 0.1 °C increase in global mean temperature is associated with measurable changes in extreme heat events, precipitation patterns, and sea‑level rise.
What Does the Evidence Show?
Multiple independent lines of evidence confirm that recent years, including 2025, are among the warmest on record:
- Instrumental records: NOAA’s Global Climate Report (2024) shows 2025’s annual anomaly at +1.22 °C relative to the 1951‑1980 baseline, placing it in the top 5% of the dataset.
- Satellite observations: NASA’s Remote Sensing of Climate (2023) corroborates surface‑based trends, indicating a consistent upward trajectory since the 1970s.
- Attribution studies: A 2022 IPCC Assessment Report attributes >95% of the observed warming since 1950 to anthropogenic emissions.
- Paleoclimate context: Ice‑core and sediment records reveal that the current warming exceeds natural variability over the past 2,000 years.
Main Causes or Drivers
Direct Human Drivers
Fossil‑fuel combustion accounts for roughly 75% of total CO₂ emissions, while agriculture and waste management contribute most of the remaining methane and nitrous oxide (IEA, 2023).
Underlying Structural Drivers
Economic growth models that prioritize carbon‑intensive energy, limited carbon pricing, and insufficient investment in renewable infrastructure amplify emissions. Urbanization expands heat‑absorbing surfaces, intensifying the urban heat island effect.
Amplifying Natural Factors
Variations in solar irradiance and volcanic activity modulate temperature on decadal scales but are minor compared with greenhouse forcing. Positive feedbacks—such as permafrost thaw releasing CH₄—can accelerate warming.
Environmental and Human Impacts
Environmental Impacts
- Coral bleaching events increase in frequency; the 2025 global bleaching index reached a record 12% of reefs affected, according to the UN Environment Programme.
- Forest mortality spikes in the western United States and Mediterranean Europe, driven by heat‑stress and drought.
- Arctic sea‑ice extent continues to decline, with the September 2025 minimum 13% lower than the 1981‑2010 average.
Human Health and Social Impacts
- Heat‑related mortality rises, especially among adults over 65; the World Health Organization estimates an additional 20,000 excess deaths worldwide in 2025.
- Heat stress reduces labor productivity in outdoor occupations by up to 8% in tropical regions.
- Water scarcity intensifies in already vulnerable basins such as the Horn of Africa, increasing competition for resources.
Economic and Infrastructure Impacts
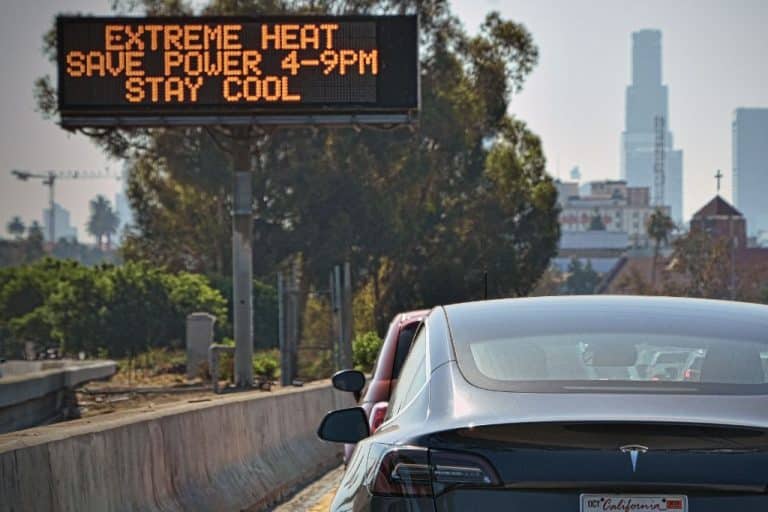
- Energy demand for cooling surges, straining electricity grids; the International Energy Agency projects a 6% increase in global electricity consumption for air‑conditioning in 2025.
- Infrastructure damage from heat‑induced expansion of rails and roads raises maintenance costs, particularly in temperate zones.
Regional Differences
While the global average rises, regional expressions vary:
- North America: Record‑breaking summer heatwaves in the Southwest have produced temperatures above 45 °C, amplifying wildfire risk.
- Sub‑Saharan Africa: Prolonged dry spells reduce crop yields, threatening food security for millions.
- Europe: Heatwaves in July 2025 linked to a persistent high‑pressure ridge, leading to widespread power outages.
- Polar regions: Accelerated permafrost thaw releases methane, creating a feedback loop that further elevates temperatures.
What Scientists Know With High Confidence
- Human activities are the primary driver of the observed increase in global mean surface temperature since the mid‑20th century.
- Temperature records from multiple independent agencies converge on the same upward trend.
- Heat‑wave frequency and intensity have increased globally, consistent with thermodynamic theory.
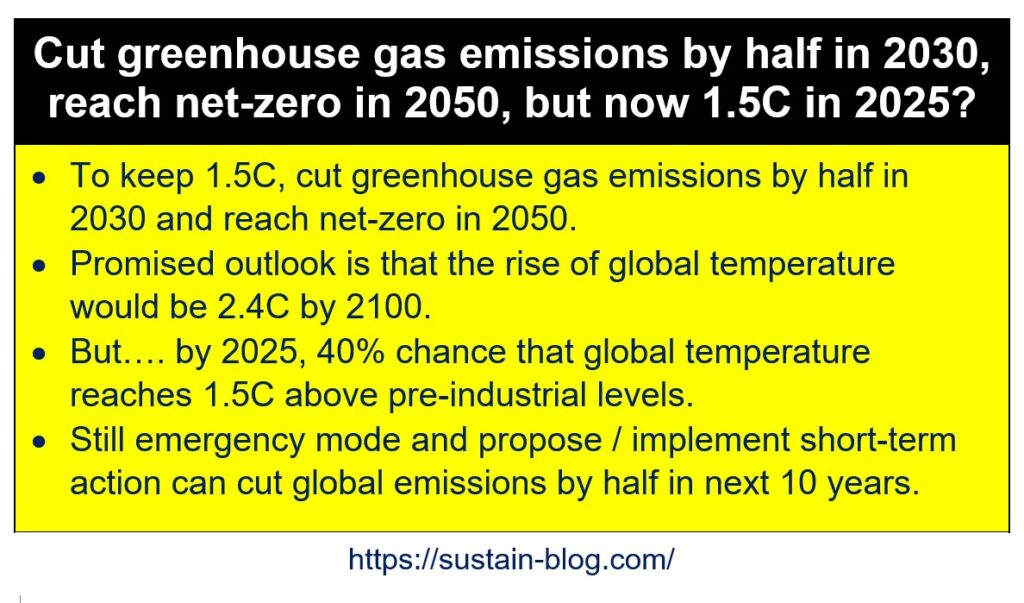
- Continued emissions at current rates will likely keep the planet on a pathway toward >1.5 °C of warming by mid‑century.
What Remains Uncertain
Key uncertainties centre on the magnitude of climate feedbacks, especially from permafrost carbon release and cloud dynamics. Regional projections for extreme precipitation are also less certain due to limited observational networks in some developing areas. These gaps affect precise risk assessments but do not alter the overarching conclusion that the climate system is warming and that 2025’s rank reflects a robust trend.
Common Misconceptions
Misconception: A single hot year proves climate change.
Reality: Climate change is assessed through long‑term trends, not isolated years. However, a series of record‑hot years, including 2025, strengthens the statistical signal of anthropogenic warming.
Misconception: Only tropical regions feel the effects of global warming.
Reality: While heat stress is most acute near the equator, high‑latitude areas experience rapid ice melt and permafrost thaw, and temperate regions face increased heat‑related mortality and infrastructure strain.
Misconception: Reducing personal electricity use will stop global warming.
Reality: Individual actions matter for demand‑side management, but systemic mitigation—such as decarbonizing energy supply and enforcing climate policies—is essential to curb emissions at the scale required.
Solutions and Limitations
Addressing the drivers and impacts of extreme heat requires a portfolio of actions:
- Mitigation: Rapid transition to low‑carbon electricity (wind, solar, hydro) can cut CO₂ emissions, yet deployment speed is limited by financing, grid integration, and material supply chains.
- Adaptation: Expanding urban green spaces reduces the heat‑island effect, but land‑use competition and maintenance costs can constrain implementation.
- Resilient infrastructure: Designing roads and railways with heat‑tolerant materials lowers failure risk, though retrofitting existing networks is expensive.
- Early warning systems: Heat‑wave alerts save lives, yet their effectiveness depends on public awareness and access to cooling shelters.
- Nature‑based solutions: Restoring mangroves protects coastlines from sea‑level rise, yet success hinges on local governance and community involvement.
What Individuals, Communities, and Governments Can Do
What Individuals Can Do
- Use energy‑efficient appliances and set thermostats higher in summer to reduce cooling demand.
- Support policies that price carbon or fund renewable projects through civic engagement.
- Participate in local tree‑planting or community‑garden initiatives that provide shade and lower ambient temperatures.
What Communities and Organizations Can Do
- Develop district‑level heat‑action plans that include cooling centres and public‑health outreach.
- Incorporate reflective roofing and cool pavements in municipal building codes.
- Promote water‑conserving irrigation to sustain urban greenery during droughts.
What Governments Can Do
- Implement and strengthen nationally determined contributions (NDCs) that target net‑zero emissions by mid‑century.
- Invest in climate‑resilient infrastructure, prioritizing vulnerable regions.
- Scale up funding for climate‑monitoring networks to close data gaps identified in the uncertainty section.
Closing Synthesis
2025’s placement among the seven hottest years recorded is a clear indicator of the ongoing, human‑driven warming of the planet. Robust observations from surface stations, satellites, and paleoclimate archives converge on this conclusion, while uncertainties remain primarily in the scale of feedbacks and regional extremes. The evidence points to escalating ecological stress, heightened health risks, and growing economic costs, especially for communities with limited adaptive capacity. Effective response demands coordinated mitigation to curb emissions, targeted adaptation to protect the most vulnerable, and equitable policies that ensure all societies can participate in and benefit from the transition. The window for decisive action remains open, but the longer high‑temperature trends persist, the steeper the challenges become.
Frequently Asked Questions
Why is 2025 considered one of the hottest years on record?
2025 is classified as one of the hottest years because global temperature datasets from NOAA and the WMO show its annual mean temperature anomaly was about +1.22 °C above the 1951‑1980 baseline, placing it within the top 5% of all recorded years.
What are the main drivers behind the record heat of 2025?
The primary drivers are human‑generated greenhouse‑gas emissions from fossil‑fuel combustion, deforestation, and agriculture, which increase atmospheric CO₂, CH₄, and N₂O, creating a radiative forcing that warms the planet.
How does the 2025 heat trend affect ecosystems?
Elevated temperatures cause more frequent coral bleaching, higher forest mortality, and accelerated Arctic sea‑ice loss, disrupting habitats and reducing biodiversity across marine and terrestrial ecosystems.
What health risks are linked to the extreme heat of 2025?
Heat‑related mortality rises, especially among older adults, while heat stress reduces labor productivity and increases the likelihood of dehydration and heat‑stroke, contributing to an estimated 20,000 extra deaths globally in 2025.
What actions can governments take to address the rising heat trend?
Governments can strengthen climate commitments (NDCs), invest in renewable energy, develop heat‑action plans with cooling centres, and upgrade infrastructure to withstand higher temperatures, thereby reducing both emissions and vulnerability.





Leave a Comment