
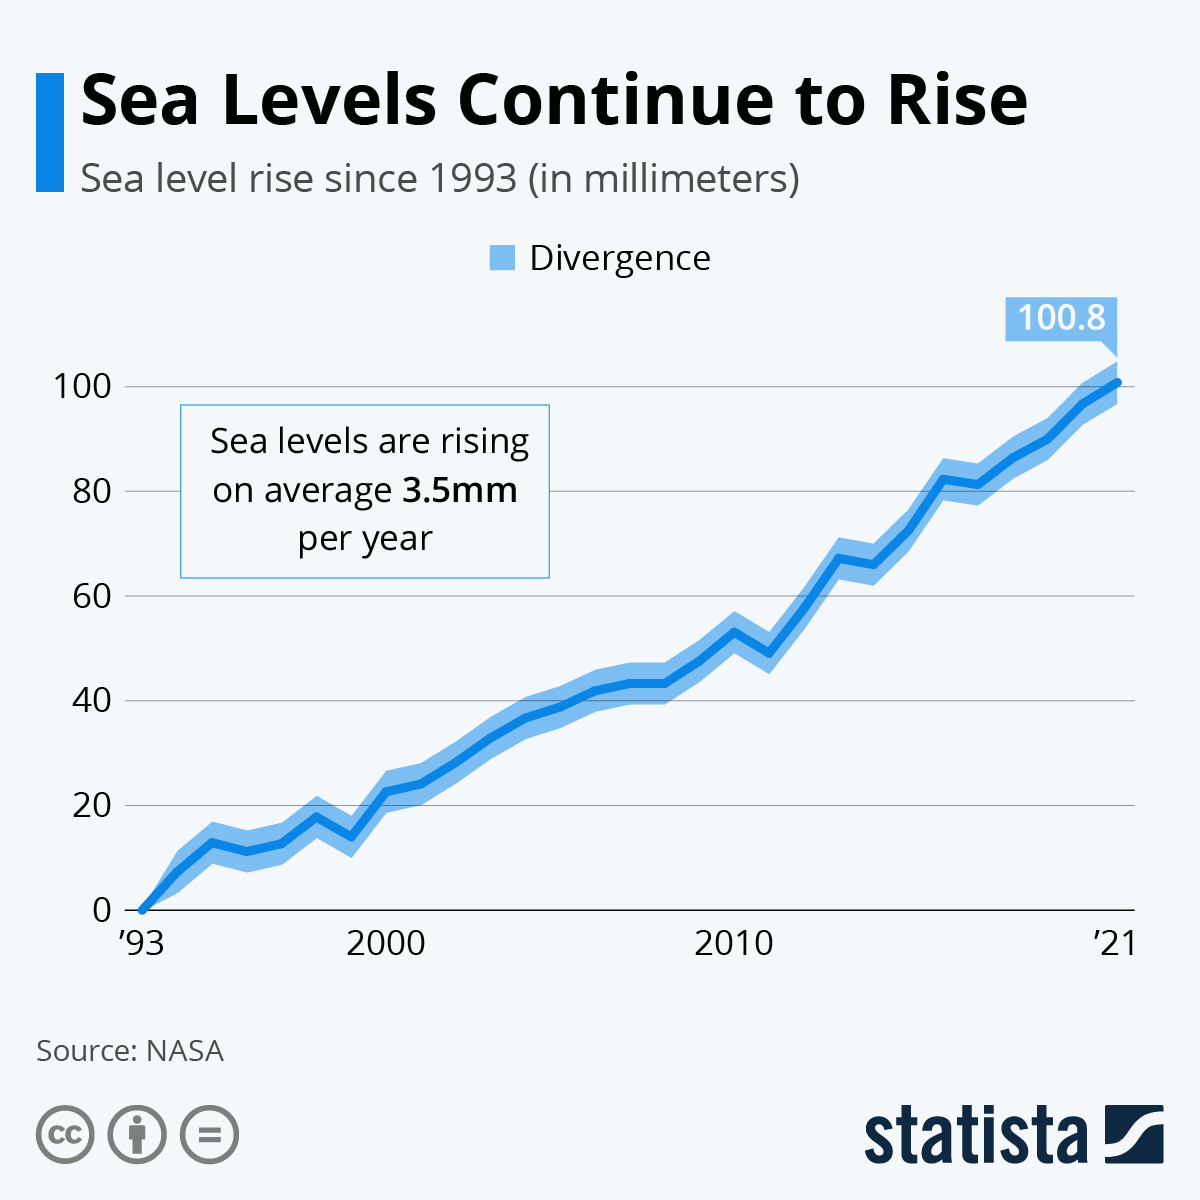
Understanding whether sea levels are rising where you live involves using tide‑gauge records, satellite observations, local agency reports, and community tools to identify trends, assess impacts, and guide adaptation.
Quick Answer
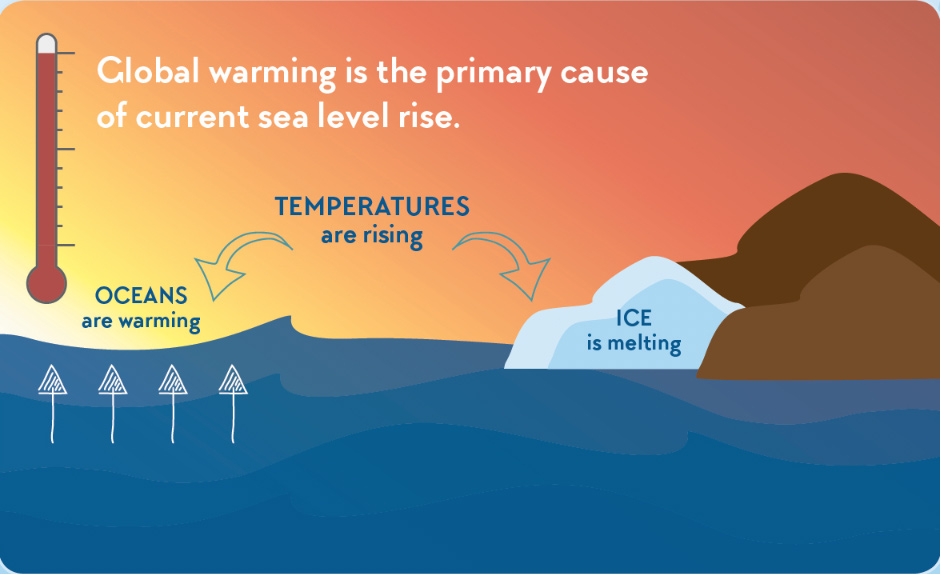
Sea‑level rise is measured by comparing long‑term observations from tide gauges and satellite altimetry with historical benchmarks. If the average water level at a nearby tide‑gauge station has increased by several centimeters over the past few decades, or if satellite‑derived global‑mean sea‑level data show a consistent upward trend that matches local observations, the sea is rising in your vicinity. The main driver is thermal expansion of warming ocean water combined with melting land ice, as documented by the Intergovernmental Panel on Climate Change (IPCC). Rising seas increase the risk of coastal flooding, erosion, and saltwater intrusion, but uncertainties remain in regional projections because of local land‑movement and data gaps.
Key Takeaways
- Long‑term tide‑gauge records and satellite altimetry provide the most reliable evidence of sea‑level trends.
- Local agencies, universities, and online platforms translate raw data into user‑friendly maps and flood‑risk scenarios.
- Thermal expansion and melting glaciers are the primary global drivers; regional variations arise from land subsidence, ocean currents, and storm patterns.
- Impacts include higher flood frequency, shoreline retreat, and challenges for infrastructure and ecosystems.
- Adaptation actions—such as updated zoning, natural‑coast defenses, and community monitoring—are most effective when grounded in accurate local data.
What Is How to Check If Sea Levels Are Rising Where You Live?
Checking sea‑level rise means evaluating whether the mean water level along your coastline or nearby water body has increased relative to a historical baseline. The process combines quantitative measurements (e.g., centimeters per decade) with qualitative observations (e.g., more frequent high‑tide flooding). It is distinct from short‑term storm surge events, which are weather‑driven, and from isolated local subsidence that may mask broader oceanic trends. Accurate assessment helps residents, planners, and policymakers understand exposure and prioritize protective measures.
How Does It Work?
1. Collect Long‑Term Tide‑Gauge Data
Tide gauges, operated by agencies such as the National Oceanic and Atmospheric Administration (NOAA) in the United States or the Permanent Service for Mean Sea Level (PSMSL) globally, record sea level every few minutes. By downloading a station’s monthly or annual averages and plotting them over 30 years or more, you can calculate a trend line. A positive slope of roughly 3 mm yr⁻¹ or greater indicates a local rise that aligns with global patterns.
2. Compare with Satellite Altimetry
Since the early 1990s, satellites such as TOPEX/Poseidon, Jason‑1/2/3, and Sentinel‑6 have measured sea‑surface height worldwide. These data are publicly available through NASA’s Sea Level Change Portal. By extracting the grid cell that covers your region and averaging the record, you obtain an independent verification of tide‑gauge trends.
3. Adjust for Vertical Land Motion
In some locales, the land itself is moving up or down due to tectonics, sediment compaction, or groundwater extraction. Global Navigation Satellite System (GNSS) stations co‑located with tide gauges provide vertical land‑movement rates. Subtracting this rate from the observed sea‑level change isolates the true oceanic contribution.
4. Use Local Agency and Academic Resources
Municipal climate‑action offices, state coastal management agencies, and university research groups often publish regional sea‑level rise assessments, scenario maps, and flood‑risk tools. Examples include the U.S. Climate Resilience Toolkit and the UK’s Climate Change Impacts Programme.
5. Visualize with Online Mapping Tools
Websites such as Climate Central’s “Surging Seas” or the European Environment Agency’s “Sea Level Rise Viewer” let you enter an address and view projected inundation under different emission scenarios. These tools synthesize tide‑gauge and satellite data with digital elevation models.
What Does the Evidence Show?
Multiple independent lines of evidence confirm that global mean sea level has risen by about 20 cm between 1901 and 2020, according to the IPCC Sixth Assessment Report (2021). Tide‑gauge networks reveal that many coastal cities—e.g., New York, Rotterdam, and Sydney—record local increases ranging from 2 mm yr⁻¹ to 5 mm yr⁻¹ after accounting for land motion. Satellite altimetry corroborates a contemporary acceleration of roughly 0.4 mm yr⁻². Peer‑reviewed meta‑analyses (e.g., Dangendorf et al., 2020) show that the observed rise aligns with thermal expansion (≈30 %) and ice‑sheet melt (≈70 %). Regional studies in the Gulf of Mexico and the South China Sea demonstrate that local trends can be amplified by subsidence, while some uplifted coastlines (e.g., parts of Scandinavia) show slower relative sea‑level change.
Main Causes or Drivers
Thermal Expansion
Warming seawater expands, contributing about one‑third of observed global sea‑level rise. Ocean heat content has increased steadily since the 1970s, as reported by the World Meteorological Organization.
Melting of Land Ice
Glaciers and the Greenland and Antarctic ice sheets are losing mass at accelerating rates. NASA’s Gravity Recovery and Climate Experiment (GRACE) satellites document a net ice‑mass loss of roughly 300 Gt yr⁻¹ in the 2010s.
Vertical Land Motion
Natural subsidence (e.g., river delta compaction) and anthropogenic factors (e.g., groundwater extraction) can raise relative sea level locally, sometimes adding several centimeters per decade.
Ocean Dynamics
Changes in wind patterns, currents, and regional sea‑surface height anomalies can cause spatial variability. For instance, the Pacific Decadal Oscillation influences sea level along the western United States.
Environmental and Human Impacts
Environmental Impacts
- Coastal wetlands experience higher salinity, reducing habitat suitability for freshwater species.
- Increased erosion reshapes shorelines, threatening nesting sites for sea turtles and shorebirds.
- Higher water levels expand the reach of marine invasive species into estuaries.
\n
Human Health and Social Impacts
- More frequent flood events increase exposure to water‑borne pathogens and mold‑related respiratory issues.
- Saltwater intrusion can compromise drinking‑water wells, especially in low‑lying coastal communities.
- Repeated flooding may prompt displacement, affecting cultural ties and economic stability.
Economic and Infrastructure Impacts
- Roads, bridges, and sewage systems built at historic sea levels become vulnerable to overtopping.
- Property values decline in high‑risk zones, influencing insurance markets and municipal tax bases.
- Adaptation investments—such as seawalls or managed retreat—require substantial public and private funding.
Regional Differences
Sea‑level change is not uniform. In the Pacific Northwest, local uplift offsets much of the global rise, resulting in near‑stable relative levels. Conversely, the Mississippi River Delta experiences subsidence of up to 10 mm yr⁻¹, amplifying the effect of the global 3 mm yr⁻¹ rise. Tropical islands often face the combined threat of sea‑level rise and storm surge, while high‑latitude coasts may see slower changes due to glacial isostatic adjustment. Understanding these nuances requires region‑specific data from tide gauges, GNSS stations, and local climate assessments.
What Scientists Know With High Confidence
- The global mean sea level has risen by about 20 cm since the early 20th century.
- Thermal expansion and melting of land ice together account for the majority of observed rise.
- Long‑term tide‑gauge records, corroborated by satellite altimetry, consistently show a rising trend worldwide.
- Rising sea levels increase the frequency and extent of coastal flooding under all realistic emission scenarios.
What Remains Uncertain
Key uncertainties include the future rate of Antarctic ice‑sheet loss, which depends on poorly understood ice‑sheet dynamics and ocean‑warming feedbacks. Regional projections are also limited by sparse tide‑gauge coverage in many developing nations and by incomplete knowledge of local land‑motion rates. These gaps affect the precision of flood‑risk maps for specific communities, though the overall direction of change remains clear.
Common Misconceptions
Misconception: Sea‑level rise is the same everywhere.
Reality: While the global average is rising, local rates differ because of land subsidence, uplift, ocean currents, and regional climate patterns.
Misconception: A single high tide proves sea‑level rise.
Reality: Isolated high‑tide events are driven by weather; long‑term trends require decades of data to distinguish from natural variability.
Misconception: Only coastal residents need to worry.
Reality: Inland areas can experience indirect effects such as increased flood risk along rivers and changes to groundwater salinity.
Misconception: Sea‑level rise will stop if emissions are reduced.
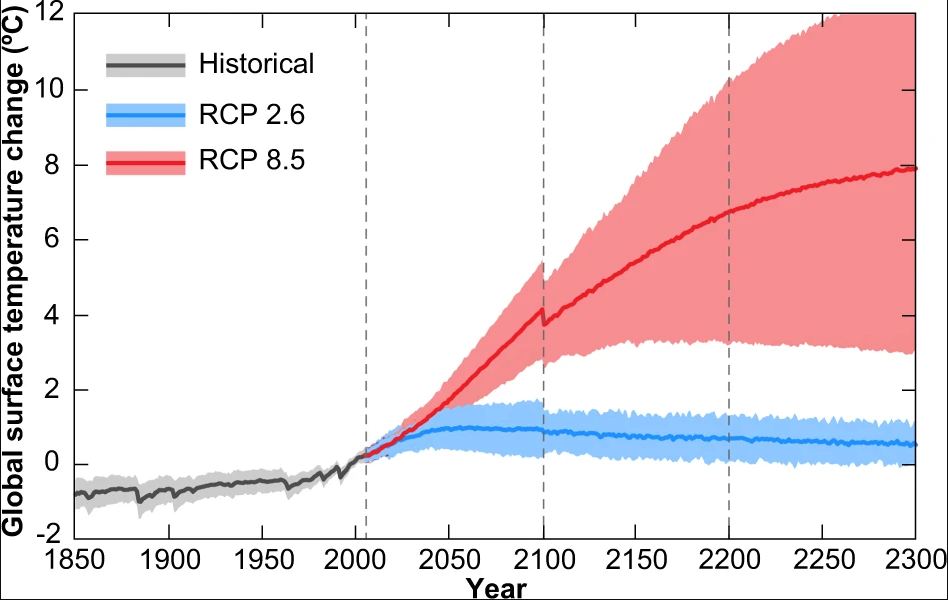
Reality: Even with rapid emissions cuts, thermal inertia of the oceans ensures continued rise for centuries, though the magnitude can be limited.
Solutions and Limitations
Effective responses combine mitigation (reducing greenhouse‑gas emissions) with adaptation (protecting communities). Mitigation slows future rise but does not reverse past gains. Adaptation strategies include:
- Hard engineering: Seawalls and surge barriers provide immediate protection but can be costly, alter natural sediment transport, and create a false sense of security.
- Nature‑based solutions: Restoring mangroves, oyster reefs, and dune systems absorbs wave energy and builds land, yet success depends on suitable habitat and long‑term maintenance.
- Managed retreat: Relocating infrastructure out of high‑risk zones reduces future losses but raises social, economic, and cultural challenges.
- Policy tools: Updated zoning, flood‑insurance reforms, and building‑code revisions increase resilience, though implementation varies by jurisdiction.
What Individuals, Communities, and Governments Can Do
What Individuals Can Do
- Use online sea‑level tools to assess personal flood risk and consider flood‑insurance where available.
- Support local climate‑action groups that advocate for resilient land‑use planning.
- Reduce personal carbon footprints to contribute to broader mitigation efforts.
What Communities and Organizations Can Do
- Establish citizen‑science tide‑gauge or water‑level monitoring programs that supplement official data.
- Implement green infrastructure—such as rain gardens and permeable pavements—to reduce runoff and enhance natural flood buffers.
- Develop community‑based emergency‑response plans that incorporate sea‑level projections.
What Governments Can Do
- Invest in expanding and maintaining tide‑gauge networks, especially in data‑poor regions.
- Integrate sea‑level rise scenarios into coastal‑development regulations and infrastructure design standards.
- Provide funding for nature‑based coastal restoration and for voluntary relocation programs where retreat is the safest option.
Closing Synthesis
Checking whether sea levels are rising where you live relies on a combination of long‑term tide‑gauge records, satellite measurements, and locally tailored tools that account for land movement. The scientific consensus—backed by multiple monitoring programs and assessment reports—confirms a steady global rise driven by thermal expansion and ice‑sheet melt. Regional differences arise from geology and ocean dynamics, creating a mosaic of risk that must be evaluated case by case. While uncertainties remain about the pace of future ice loss and the completeness of local data, the direction of change is clear. Effective action blends mitigation to curb emissions with adaptation measures that protect people, ecosystems, and economies. By accessing reliable data, engaging with local agencies, and supporting resilient policies, communities can make informed decisions that safeguard their coastlines for generations to come.
Frequently Asked Questions
How can I find tide‑gauge data for my coastline?
Tide‑gauge data are publicly available from national agencies such as NOAA in the U.S. or from the global Permanent Service for Mean Sea Level (PSMSL). Visit their websites, select the nearest station, and download monthly or annual sea‑level averages to examine long‑term trends.
What is the difference between sea‑level rise and storm surge?
Sea‑level rise refers to the gradual increase in average ocean height over decades, driven by thermal expansion and melting ice. Storm surge is a short‑term, wind‑driven rise in water level that occurs during extreme weather events and can temporarily add several meters on top of the baseline sea level.
Why do some regions experience faster sea‑level rise than the global average?
Regional differences arise from vertical land motion (subsidence or uplift), ocean‑current changes, and local climate patterns. Areas with rapid subsidence, such as river deltas, can see relative sea‑level rise that exceeds the global mean, while uplifted coastlines may experience slower or even negative relative change.
Can satellite data replace local tide‑gauge measurements?
Satellite altimetry provides consistent global coverage and validates tide‑gauge trends, but it has coarser spatial resolution and can miss small‑scale local effects. Combining both data sources gives the most accurate picture of sea‑level change for a specific location.
What are practical actions a homeowner can take to prepare for rising seas?
Homeowners can use online sea‑level tools to assess flood risk, consider purchasing flood insurance, elevate utilities and appliances, and support community projects that restore natural buffers like mangroves or dunes, all of which reduce vulnerability to future sea‑level rise.




Leave a Comment