
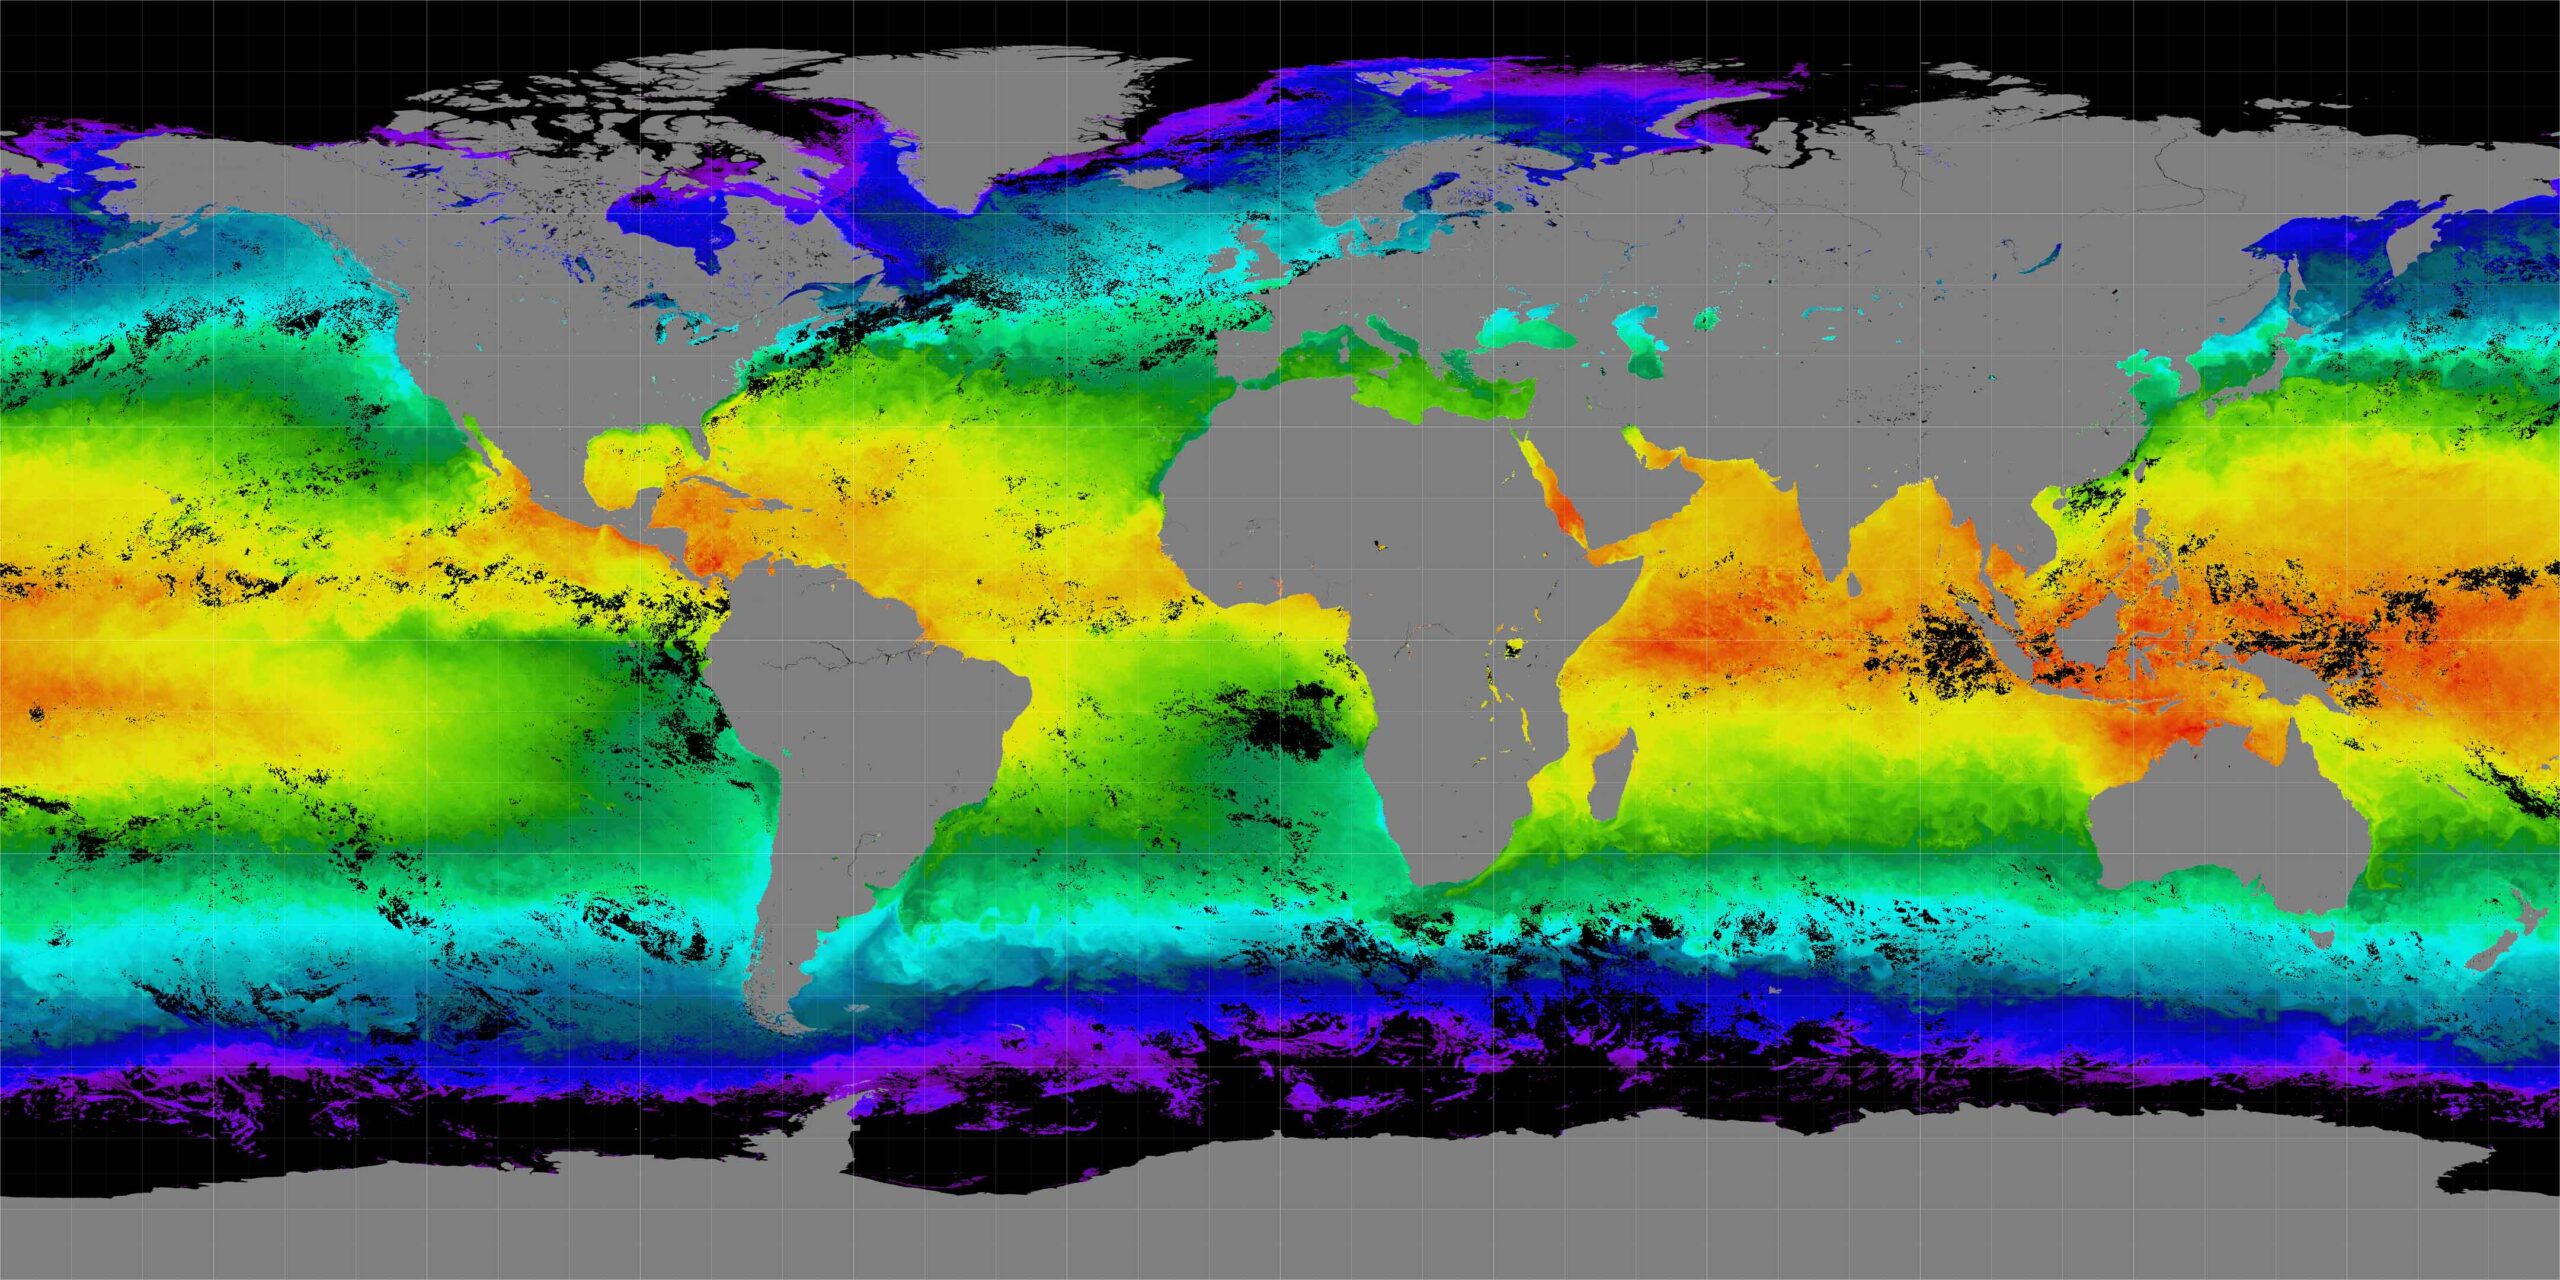
Sea surface temperatures (SSTs) control the exchange of heat and moisture between ocean and atmosphere, influencing storm intensity, weather patterns, and long‑term climate trends.
Quick Answer
Sea surface temperature is the temperature of the ocean’s top few millimetres to a few metres, measured by satellites and buoys. Warm SSTs increase evaporation, providing latent heat that fuels atmospheric convection and intensifies tropical cyclones. On larger scales, regional SST anomalies drive phenomena such as El Niño and La Niña, reshaping precipitation and temperature patterns worldwide. While the basic physics is well understood, uncertainties remain about how quickly SSTs will rise under future emissions and how regional ecosystems will respond.
Key Takeaways
- Warm sea surface temperatures supply the energy that powers tropical storms and hurricanes.
- SST anomalies in the Pacific drive El Niño and La Niña, altering global weather patterns.
- Long‑term ocean warming contributes to higher average global temperatures and sea‑level rise.
- Impacts are uneven: coastal communities face greater flood risk, while coral reefs suffer bleaching.
- Mitigation of greenhouse‑gas emissions and adaptive coastal planning are essential to limit future risks.
What Is How Sea Surface Temperatures Shape Weather Storms and Climate?
Sea surface temperature (SST) refers to the temperature of the ocean’s upper layer, typically the top 1 m, although measurements may represent the mixed layer to a depth of 20–30 m. SST is a core variable in climate science because the ocean stores more than 90 % of Earth’s excess heat (IPCC, 2021). By regulating the transfer of heat and moisture to the atmosphere, SSTs influence daily weather, the development of extreme storms, and the long‑term trajectory of the climate system.
Unlike air temperature, SST changes more slowly due to the ocean’s high heat capacity, but once a threshold is crossed, atmospheric responses can be rapid and powerful. The concept differs from sea‑level temperature averages, which may include deeper waters, and from sea‑ice extent, which measures frozen surface rather than heat content.
How Does It Work?
1. Heat Transfer from Ocean to Atmosphere
- Solar radiation warms the ocean surface.
- Warm water evaporates, adding moisture and latent heat to the lower troposphere.
- Condensation of this vapor releases heat aloft, driving upward motion and low‑pressure systems.
2. Energy Source for Tropical Cyclones
When SSTs exceed roughly 26.5 °C, the ocean can sustain the intense convection needed for tropical cyclones (NOAA, 2022). The storm’s eyewall extracts heat from the water, converting it into kinetic energy that powers wind speeds and rainfall.
3. Large‑Scale Atmospheric Patterns
Regional SST anomalies modify sea‑level pressure gradients. In the equatorial Pacific, warmer SSTs during El Niño weaken the trade winds, allowing warm water to spread eastward, which shifts the Walker circulation and alters rainfall in the Americas, Asia, and Africa. The opposite occurs during La Niña, when cooler SSTs strengthen trade winds and produce opposite precipitation patterns.
4. Feedback Loops
Warmer SSTs can increase atmospheric water vapor, a potent greenhouse gas, creating a positive feedback that amplifies warming. Conversely, strong storms can mix cooler subsurface water to the surface, temporarily lowering SSTs—a negative feedback that can limit storm intensity in some cases.
What Does the Evidence Show?
Multiple lines of evidence confirm the SST‑weather link. Satellite observations since the 1980s show a global SST increase of about 0.13 °C per decade (NOAA, 2023). Long‑term buoy records corroborate this trend and reveal that the upper 2000 m of the ocean has accumulated roughly 0.5 zettajoules (ZJ) of heat each decade since 1970 (IPCC, 2021).
Statistical analyses of tropical cyclone databases indicate that the proportion of Category 4–5 hurricanes has risen in basins where the mean SST has warmed by more than 1 °C over the past four decades (Kossin et al., 2020, Nature). Attribution studies using climate models attribute about 30 % of the increase in Atlantic hurricane intensity to anthropogenic warming (IPCC, 2021).
El Niño and La Niña impacts are documented in the International Research Institute for Climate and Society’s ENSO Diagnostic Discussion, which links the 1997‑98 El Niño (global SST anomaly +0.9 °C) to extreme rainfall in the southern United States and drought in Indonesia.
Main Causes or Drivers
Direct Causes
- Absorption of solar radiation by the ocean surface.
- Reduced heat loss to the atmosphere during periods of weak wind.
Underlying Drivers
- Rising atmospheric greenhouse‑gas concentrations, which trap more infrared radiation and increase ocean heat uptake (IPCC, 2021).
- Changes in ocean circulation, such as a slowdown of the Atlantic Meridional Overturning Circulation, which can trap heat in certain regions.
Natural Variability
- Solar cycles, volcanic aerosols, and internal oceanic oscillations (e.g., Pacific Decadal Oscillation) modulate SST on decadal timescales.
Environmental and Human Impacts
Environmental Impacts
- Storm Intensity: Warmer SSTs raise the maximum potential intensity of tropical cyclones, leading to stronger winds and heavier rainfall.
- Coral Bleaching: Sustained SSTs above the local bleaching threshold (typically 1–2 °C above the summer maximum) cause widespread loss of symbiotic algae, threatening reef biodiversity.
- Marine Species Distribution: Species such as sardines and tuna shift poleward in response to changing thermal habitats.
Human Health and Social Impacts
- More intense storms increase risk of injury, water‑borne disease, and displacement for coastal populations.
- Altered precipitation patterns affect agricultural yields, influencing food security in vulnerable regions.
Economic and Infrastructure Impacts
- Damage to coastal infrastructure from storm surge can exceed billions of dollars per event (e.g., Hurricane Ian, 2022, US $112 billion).
- Tourism revenue declines when coral bleaching reduces reef attractiveness.
Regional Differences
In the North Atlantic, SSTs have risen faster than the global average, intensifying hurricane activity along the U.S. Gulf Coast. In the Western Pacific, warm SSTs have contributed to a higher frequency of super‑typhoons impacting the Philippines and Japan. Conversely, the Southern Ocean remains relatively cold, limiting tropical‑style cyclones but still showing measurable heat uptake that influences Antarctic ice melt.
What Scientists Know With High Confidence
What Scientists Know With High Confidence
- The ocean absorbs >90 % of excess heat from anthropogenic greenhouse‑gas forcing.
- Sea surface temperatures above ~26.5 °C are a prerequisite for tropical cyclone formation.
- El Niño and La Niña are driven primarily by SST anomalies in the equatorial Pacific.
- Warming SSTs have contributed to an observable increase in the intensity of the strongest tropical cyclones.
What Remains Uncertain
What Remains Uncertain
Key uncertainties include the exact rate at which SSTs will rise under different emissions pathways, the regional variability of ocean heat uptake, and how quickly marine ecosystems can adapt to repeated bleaching events. Model representation of small‑scale ocean‑atmosphere coupling also limits precise forecasts of individual storm intensity.
Common Misconceptions
Common Misconceptions
Misconception: A single warm ocean patch directly causes a specific hurricane.
Reality: While warm SSTs are necessary, hurricane formation also requires low vertical wind shear, sufficient moisture, and a pre‑existing disturbance. No single patch can be blamed for a storm without these additional conditions.
Misconception: El Niño only brings rain.
Reality: El Niño produces both excess rainfall in some regions (e.g., western U.S.) and drought in others (e.g., Australia), because it reshapes global circulation patterns rather than simply adding moisture.
Misconception: Ocean warming is solely a natural cycle.
Reality: Long‑term records show a clear anthropogenic signal superimposed on natural variability, with the warming trend accelerating since the mid‑20th century.
Solutions and Limitations
Addressing SST‑driven impacts requires both mitigation of greenhouse‑gas emissions and adaptation to existing changes. Mitigation reduces future ocean heat uptake but cannot reverse heat already stored; therefore, adaptation measures—such as resilient coastal design, early‑warning systems, and ecosystem‑based management—are essential. Limitations include the long thermal inertia of the ocean, funding gaps for climate‑resilient infrastructure, and uncertainties in predicting localized SST trends.
What Individuals, Communities, and Governments Can Do
What Individuals Can Do
- Reduce personal carbon footprints by conserving energy, using public transport, and supporting renewable energy policies.
- Participate in local coastal clean‑up and reef‑restoration projects to bolster ecosystem resilience.
What Communities and Organizations Can Do
- Develop and enforce zoning that restricts development in high‑risk flood zones.
- Invest in mangrove restoration, which buffers storm surges and sequesters carbon.
What Governments Can Do
- Implement ambitious emissions‑reduction targets aligned with the Paris Agreement to limit future SST rise.
- Fund continuous SST monitoring networks (satellites, Argo floats) to improve forecasting.
- Integrate SST‑based climate projections into national disaster‑risk reduction strategies.
Synthesis of Key Points
Sea surface temperature is the engine that powers many of the planet’s most dramatic weather events and underlies long‑term climate change. Warm SSTs fuel tropical cyclones, drive ENSO cycles, and contribute to global heat storage, with clear, high‑confidence evidence linking these processes. Uncertainties remain about future rates of warming and ecosystem responses, but the scientific consensus affirms that reducing greenhouse‑gas emissions and strengthening adaptive capacity are the most effective pathways to protect both human societies and marine ecosystems.
Frequently Asked Questions
What is a sea surface temperature (SST) and how is it measured?
A sea surface temperature is the temperature of the ocean’s upper layer, typically the top 1 meter, measured by satellite infrared sensors and an array of buoy instruments that record water temperature directly.
Why do warm SSTs increase tropical cyclone intensity?
Warm SSTs above about 26.5 °C provide abundant latent heat through evaporation; when this moisture condenses in the storm’s core, it releases energy that intensifies wind speeds and rainfall, allowing cyclones to become stronger.
How do SST anomalies cause El Niño and La Niña events?
El Niño occurs when the central and eastern Pacific warm several degrees above average, weakening trade winds and shifting atmospheric circulation, while La Niña involves cooler-than-average SSTs that strengthen trade winds, producing opposite global weather impacts.
What are the main human impacts of rising SSTs?
Rising SSTs increase the risk of severe storms and flooding for coastal populations, threaten food security through altered precipitation, and damage tourism‑dependent economies by causing coral bleaching and reef loss.
What actions can governments take to address SST‑driven climate risks?
Governments can set and meet ambitious emissions‑reduction targets, invest in continuous SST monitoring networks, and incorporate SST‑based projections into disaster‑risk reduction and coastal‑zone planning policies.








Leave a Comment