
Scientists track rising atmospheric carbon dioxide through a network of direct measurements, ice‑core reconstructions, and satellite observations, revealing a clear upward trend that drives global warming and broad environmental impacts.
Quick Answer
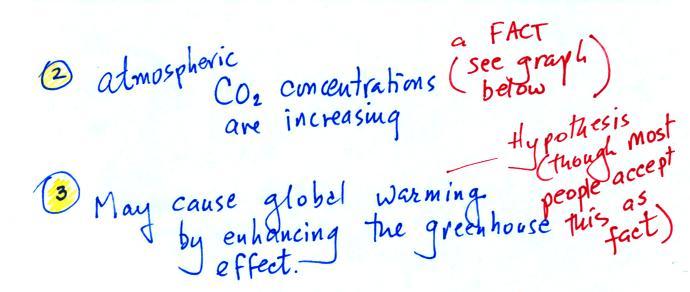
Carbon dioxide (CO₂) concentrations are measured directly at ground stations such as the Mauna Loa Observatory, inferred from ancient air bubbles trapped in ice cores, and monitored from space via satellite spectrometers. All three lines of evidence show a steady increase from about 280 ppm before the Industrial Revolution to over 420 ppm in 2023, a rise that enhances the greenhouse effect and raises worldwide temperatures. While the upward trend is robust, uncertainties remain in regional carbon‑cycle feedbacks and future emission pathways.
Key Takeaways
- Long‑term records from Mauna Loa and ice cores provide independent confirmation that atmospheric CO₂ is rising.
- Satellite sensors now map CO₂ globally, showing that the increase is a planetary phenomenon, not a local anomaly.
- Higher CO₂ intensifies the greenhouse effect, contributing to warming, sea‑level rise, and ecosystem stress.
- High‑confidence findings include the magnitude of the rise and its primary driver—human fossil‑fuel combustion.
- Uncertainties focus on how natural carbon sinks will respond and on regional climate impacts.
What Is How Scientists Know Carbon Dioxide Levels Are Rising—And Why It Matters?
The phrase describes the suite of observational and analytical methods that quantify atmospheric CO₂ and explain why those measurements matter for climate science, policy, and society. It encompasses direct air sampling, paleoclimate proxies, and remote‑sensing technologies, each with defined spatial and temporal scopes. Understanding this knowledge base distinguishes rigorous scientific evidence from anecdote or speculation.
How Does It Work?
1. Direct Ground‑Based Monitoring
Since 1958, the Mauna Loa Observatory in Hawaiʻi has recorded CO₂ concentrations hourly using infrared gas analyzers. The resulting time series, known as the Keeling Curve, shows a seasonal “saw‑tooth” pattern driven by plant growth cycles and a long‑term upward trend.
2. Ice‑Core Reconstruction
Scientists drill deep into polar ice sheets (e.g., Antarctica’s EPICA core) to retrieve trapped air bubbles. By measuring the CO₂ content of these bubbles, researchers reconstruct atmospheric composition over the past 800,000 years, revealing natural cycles and the abrupt post‑1850 rise.
3. Satellite Remote Sensing
Orbiting instruments such as NASA’s OCO‑2 (Orbiting Carbon Observatory‑2) detect the absorption of reflected sunlight at CO₂‑specific wavelengths. These data produce global concentration maps, confirming that the increase is nearly uniform across latitudes and oceans.
4. Data Integration and Modelling
Atmospheric chemistry models assimilate ground, ice‑core, and satellite data to estimate carbon fluxes between the atmosphere, oceans, and terrestrial biosphere. This helps isolate anthropogenic emissions from natural variability.
What Does the Evidence Show?
Multiple, independent data streams converge on the same conclusion: atmospheric CO₂ has risen from roughly 280 ppm in pre‑industrial times to 424 ppm in 2023 (NOAA Global Monitoring Laboratory, 2024). Ice‑core records demonstrate that such high concentrations have not occurred in at least 800 kyr. Satellite observations confirm that the increase is global, with regional hotspots over industrialized continents. The Intergovernmental Panel on Climate Change (IPCC) AR6 assessment (2021) rates the evidence for a human‑driven rise as “very high” confidence.
Main Causes or Drivers
Direct Human Emissions
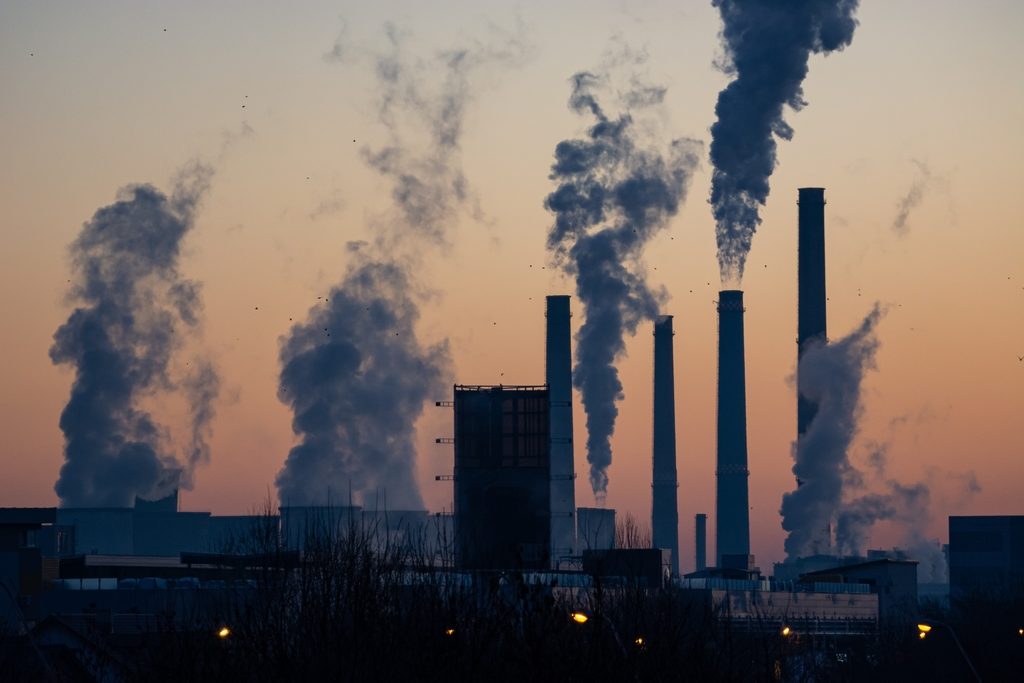
Burning of coal, oil, and natural gas releases about 36 Gt C yr⁻¹ (gigatonnes of carbon per year) into the atmosphere, accounting for roughly 90 % of the observed increase.
Land‑Use Change
Deforestation and soil disturbance convert carbon‑rich ecosystems into sources, adding an estimated 3 Gt C yr⁻¹.
Amplifying Natural Processes
Warmer oceans absorb less CO₂, and thawing permafrost can release stored carbon, potentially amplifying the anthropogenic signal.
Environmental and Human Impacts
Environmental Impacts
- Enhanced greenhouse effect raises global mean surface temperature by ~1.2 °C since pre‑industrial times (IPCC, 2021).
- Warmer oceans lead to acidification, reducing calcifying organism viability.
- Shifts in precipitation patterns increase drought risk in some regions and flood risk in others.
Human Health and Social Impacts
- Heat‑related mortality rises as extreme temperature events become more frequent.
- Air‑quality degradation from ozone formation intensifies in high‑CO₂, high‑temperature environments.
- Food security is threatened by heat stress on staple crops and altered water availability.
Economic and Infrastructure Impacts
- Increased frequency of climate‑related disasters raises insurance costs and infrastructure repair budgets.
- Coastal flooding from sea‑level rise endangers ports, housing, and tourism economies.
Regional Differences
While the atmospheric CO₂ increase is globally pervasive, its consequences vary. High‑latitude regions experience amplified warming (Arctic amplification), accelerating permafrost thaw. Tropical forests, such as the Amazon, face both higher temperatures and deforestation pressures, threatening carbon‑sink capacity. Low‑lying island nations confront sea‑level rise and salt‑water intrusion, whereas arid regions may see intensified drought. Monitoring density also differs: North America and Europe have dense ground‑based networks, while many parts of Africa and Central Asia rely more heavily on satellite data.
What Scientists Know With High Confidence
- Atmospheric CO₂ concentrations have risen sharply since the mid‑19th century.
- Human fossil‑fuel combustion is the primary driver of the recent increase.
- The rise enhances the greenhouse effect, leading to measurable global warming.
- Multiple independent measurement techniques (ground stations, ice cores, satellites) corroborate the trend.
What Remains Uncertain
Key uncertainties include the magnitude of future carbon‑sink feedbacks (e.g., permafrost carbon release), regional variations in climate response, and the socioeconomic pathways that will determine emission trajectories. Improved monitoring of ocean uptake and high‑latitude biosphere processes could reduce these gaps.
Common Misconceptions
Misconception: CO₂ levels are measured only at a single site.
Reality: A global observing system combines dozens of surface stations, ice‑core archives, and satellite instruments, providing a comprehensive, cross‑validated picture.
Misconception: Natural processes can easily absorb the excess CO₂.
Reality: While oceans and forests currently absorb about half of anthropogenic emissions, their capacity is limited and may decline as temperatures rise.
Misconception: A higher CO₂ concentration alone causes extreme weather.
Reality: Elevated CO₂ drives overall warming, which can increase the frequency and intensity of certain extreme events, but individual storms also depend on atmospheric dynamics and regional factors.
Solutions and Limitations
Effective responses fall into three categories:
- Mitigation: Rapid decarbonization of energy, industry, and transport can curb emissions. The limitation is the required scale of infrastructure transition and policy coordination.
- Adaptation: Enhancing flood defenses, heat‑wave response plans, and resilient agricultural practices reduce vulnerability. Trade‑offs include financial costs and potential displacement.
- Carbon‑Removal Technologies: Afforestation, soil carbon sequestration, and emerging direct‑air‑capture can draw down CO₂, but they face uncertainties in permanence, land‑use competition, and high cost.
What Individuals, Communities, and Governments Can Do
What Individuals Can Do
- Reduce personal energy use (e.g., efficient appliances, home insulation).
- Choose low‑carbon transportation modes such as public transit, cycling, or electric vehicles where feasible.
- Support policies and companies that commit to science‑based emission targets.
What Communities and Organizations Can Do
- Develop local renewable‑energy projects (solar, wind, community micro‑grids).
- Implement urban greening and tree‑planting programs that also address heat‑island effects.
- Adopt carbon‑accounting tools to measure and manage organizational footprints.
What Governments Can Do
- Enact and strengthen carbon‑pricing mechanisms that internalize the climate cost of emissions.
- Invest in research, deployment, and scaling of clean‑energy technologies.
- Maintain and expand atmospheric monitoring networks to ensure transparent, high‑quality data.
Closing Synthesis
Robust, multi‑decadal observations—from the iconic Keeling Curve to ancient ice cores and modern satellites—unambiguously demonstrate that atmospheric carbon dioxide is rising at an unprecedented rate. This rise, driven chiefly by human fossil‑fuel use and land‑use change, amplifies the greenhouse effect and underpins a suite of climate impacts that differ across regions and societies. High‑confidence findings give policymakers a solid scientific foundation, while remaining uncertainties highlight the need for better monitoring of natural carbon sinks and more precise regional projections. Mitigation, adaptation, and responsibly managed carbon‑removal strategies together offer the most viable path forward, but they require coordinated action beyond individual choices. Understanding the evidence and its implications equips every stakeholder to participate meaningfully in the global response.
Frequently Asked Questions
How do scientists measure atmospheric carbon dioxide?
Scientists use a combination of ground‑based stations like Mauna Loa, ice‑core analysis that traps ancient air bubbles, and satellite spectrometers such as NASA’s OCO‑2 to record CO₂ concentrations worldwide.
Why has CO₂ increased so rapidly since the Industrial Revolution?
The rapid rise is primarily due to human activities—burning fossil fuels releases about 36 Gt C per year, and land‑use changes add roughly 3 Gt C per year, together accounting for most of the observed increase.
What are the main environmental effects of higher CO₂ levels?
Higher CO₂ strengthens the greenhouse effect, raising global temperatures, contributing to ocean acidification, altering precipitation patterns, and increasing the frequency of heat‑related extremes.
What uncertainties remain in our understanding of CO₂ and climate?
Key uncertainties involve how natural carbon sinks like permafrost and oceans will respond to warming, regional climate variations, and future socioeconomic pathways that affect emissions.
What actions can governments take to address rising CO₂?
Governments can implement carbon‑pricing, invest in clean‑energy research and infrastructure, and maintain comprehensive monitoring networks to ensure transparent, high‑quality climate data.






Leave a Comment