
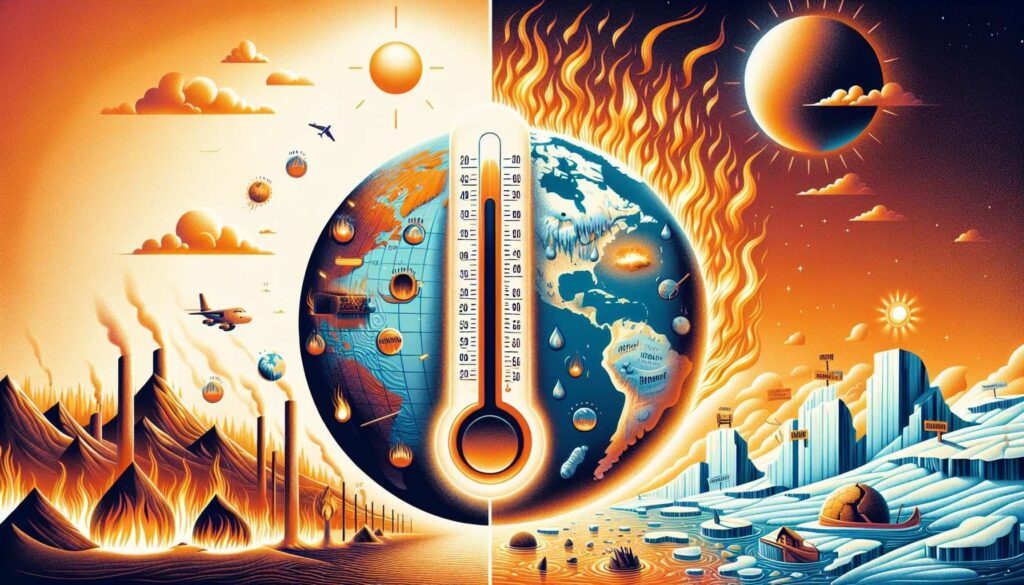
Earth’s average surface temperature has risen about 1.1 °C (2.0 °F) since 1900, a change driven largely by human‑added greenhouse gases and reflected in a wide range of climate impacts.
Quick Answer
Since the start of the twentieth century, global mean surface temperature has increased by roughly 1.1 °C (2.0 °F), based on instrumental records compiled by NOAA and the World Meteorological Organization. The warming stems from an enhanced greenhouse effect caused primarily by carbon dioxide, methane, and other gases released from fossil‑fuel combustion, deforestation, and industrial processes. This rise is evident across land and ocean, with polar regions warming faster than the global average. While the magnitude of warming is well‑established, uncertainties remain about regional extremes, future feedbacks, and the exact timing of tipping points.
Key Takeaways
- Global average temperature has risen about 1.1 °C since 1900, according to multiple independent datasets.
- Human‑driven greenhouse‑gas emissions are the dominant cause, with natural variability contributing only a small fraction.
- Warming is uneven: the Arctic has warmed more than twice the global average, while some ocean regions show slower changes.
- Observed impacts include more frequent heatwaves, accelerated glacier loss, sea‑level rise, and shifts in species distributions.
- High‑confidence findings are supported by long‑term observations, while uncertainties focus on regional climate response and long‑term feedbacks.
What Is How Much Has Earth’s Temperature Changed Since 1900?
The phrase refers to the change in the global‑average surface temperature (land + ocean) measured from the beginning of the instrumental record in 1900 to the present day. It is expressed as an anomaly relative to a baseline period (commonly 1850‑1900) and is derived from thermometers, satellite observations, and homogenised climate‑data sets. This metric differs from short‑term weather fluctuations; it captures a persistent shift in the climate system.
How Does It Work?
Temperature change is the outcome of energy balance alterations in Earth’s climate system. The main steps are:
- Solar radiation reaches Earth. About 30 % is reflected, while the rest is absorbed by the surface and atmosphere.
- Greenhouse gases trap outgoing infrared radiation. Molecules such as CO₂ and CH₄ absorb and re‑emit infrared photons, slowing heat loss to space.
- Human activities increase greenhouse‑gas concentrations. Since 1900, atmospheric CO₂ rose from ~290 ppm to over 420 ppm (NOAA, 2023), enhancing the greenhouse effect.
- Energy imbalance leads to warming. The Earth now retains roughly 0.6 W m⁻² more energy than it emits, translating into the observed 1.1 °C rise.
- Feedback mechanisms amplify or dampen change. Melting ice reduces albedo, releasing more heat; increased water vapor adds additional greenhouse capacity.
What Does the Evidence Show?
Multiple lines of evidence converge on the same conclusion:
- Instrumental records. NOAA’s Global Historical Climatology Network and the HadCRUT5 dataset both indicate a 1.0‑1.2 °C increase for the 1900‑2022 period.
- Satellite observations. Since 1979, the Atmospheric Infrared Sounder (AIRS) records confirm a consistent upward trend in lower‑troposphere temperature.
- Paleoclimate reconstructions. Tree‑ring and ice‑core proxies show that the 20th‑century warming exceeds natural variability over the past millennium (IPCC AR6, 2021).
- Attribution studies. Detection‑and‑attribution analyses attribute >95 % of the observed warming to anthropogenic greenhouse gases (IPCC, 2021).
Main Causes or Drivers
Direct Human Causes
The combustion of coal, oil, and natural gas releases CO₂, accounting for roughly 75 % of total radiative forcing since 1900. Methane emissions from agriculture and fossil‑fuel extraction contribute about 15 % of the forcing.
Underlying Drivers
Industrialisation, population growth, and rising per‑capita energy demand have amplified fossil‑fuel use. Deforestation reduces carbon uptake, while land‑use change adds additional CO₂.
Natural Influences
Solar variability and volcanic eruptions affect short‑term temperature, but their net contribution to the long‑term trend is minor (<0.1 °C) compared with greenhouse‑gas forcing.
Environmental and Human Impacts
Environmental Impacts
Warming drives glacier retreat, permafrost thaw, and Arctic sea‑ice loss, contributing to a global sea‑level rise of ~0.20 m since 1900 (IPCC, 2021). Ocean heat content has increased, stressing coral reefs and leading to more frequent bleaching events.
Human Health and Social Impacts
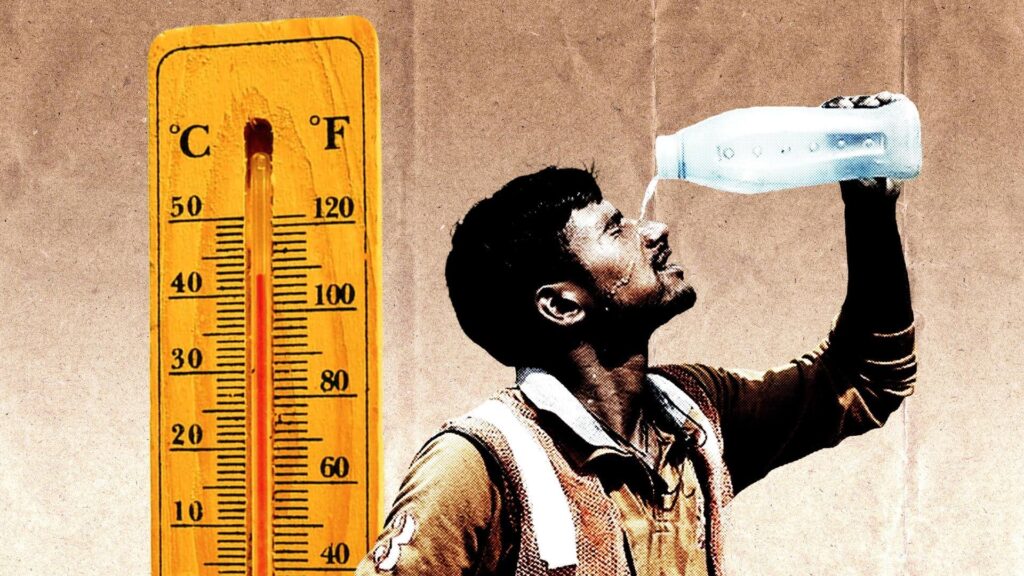
Higher temperatures elevate heat‑related mortality, especially among the elderly and outdoor workers. Shifts in vector‑borne disease ranges (e.g., dengue) are linked to expanding suitable climates.
Economic and Infrastructure Impacts
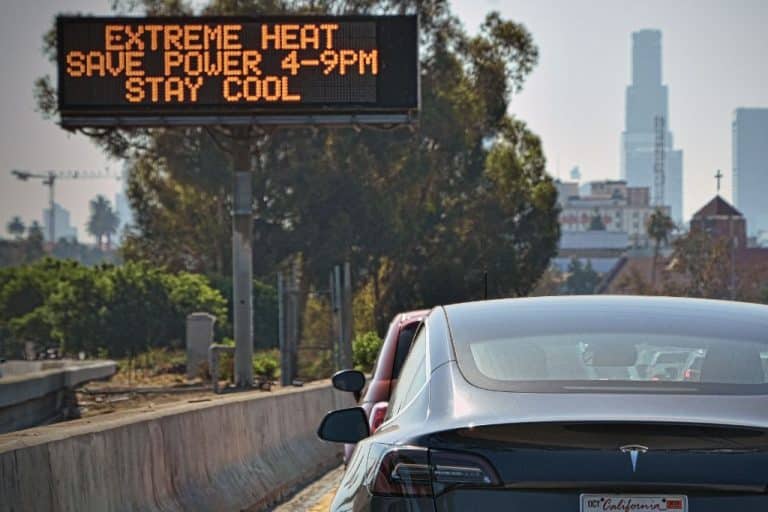
Heatwaves raise energy demand for cooling, stressing electricity grids. Coastal flooding threatens property values and insurance costs, disproportionately affecting low‑income coastal communities.
Regional Differences
Warming is not uniform. The Arctic has warmed ~2.3 °C, more than double the global mean, while parts of the Southern Ocean show modest changes (<0.5 °C). Tropical land areas experience larger increases in heat‑wave frequency, whereas some high‑latitude ocean regions exhibit slower surface warming due to deep‑water heat uptake.
What Scientists Know With High Confidence
- The planet’s surface temperature has risen about 1.1 °C since 1900.
- Human emissions of CO₂, CH₄, and N₂O are the primary drivers of this warming.
- Warming is causing sea‑level rise, glacier loss, and increased frequency of extreme heat events.
- Observed changes are consistent across independent datasets and measurement techniques.
What Remains Uncertain
Key uncertainties include the magnitude of future carbon‑cycle feedbacks (e.g., permafrost methane release), regional precipitation changes, and the precise temperature threshold at which large‑scale ice‑sheet instability may accelerate sea‑level rise. Improved monitoring of remote regions and higher‑resolution climate models are needed to narrow these gaps.
Common Misconceptions
Misconception: The 1 °C increase is too small to matter.
Reality: Even a 1 °C rise can shift climate zones, intensify heatwaves, and push vulnerable ecosystems beyond their adaptive capacity.
Misconception: Recent heatwaves prove the trend is just natural variability.
Reality: Attribution studies show that the probability of extreme heat events has increased by a factor of 5–10 due to anthropogenic warming.
Misconception: Only the Arctic is warming.
Reality: While the Arctic warms fastest, all continents and the global ocean have recorded statistically significant temperature increases.
Solutions and Limitations
Effective responses combine mitigation (reducing greenhouse‑gas emissions) and adaptation (preparing for unavoidable impacts). Key strategies include:
- Rapid decarbonisation of energy. Shifting to wind, solar, and nuclear can cut emissions, but requires substantial investment, grid upgrades, and policy support.
- Energy efficiency. Improving building insulation and industrial processes offers cost‑effective emissions reductions, though adoption varies by region.
- Reforestation and afforestation. Restoring forests sequesters carbon, yet land‑use competition and permanence concerns limit long‑term potential.
- Adaptation measures. Coastal defenses, heat‑action plans, and climate‑resilient agriculture reduce vulnerability but do not address the underlying cause.
Each approach carries trade‑offs: renewable deployment may impact land use; carbon capture technologies are still costly; and adaptation can create inequities if resources are unevenly distributed.
What Individuals, Communities, and Governments Can Do
What Individuals Can Do
Adopt energy‑saving habits (e.g., efficient appliances), reduce car travel, support renewable energy providers, and engage in local climate‑action groups. While individual actions alone cannot halt warming, collective behaviour influences market demand and policy.
What Communities and Organizations Can Do
Implement district‑level energy‑efficiency retrofits, develop green infrastructure (urban trees, permeable surfaces), and create heat‑wave response plans that prioritize vulnerable residents.
What Governments Can Do
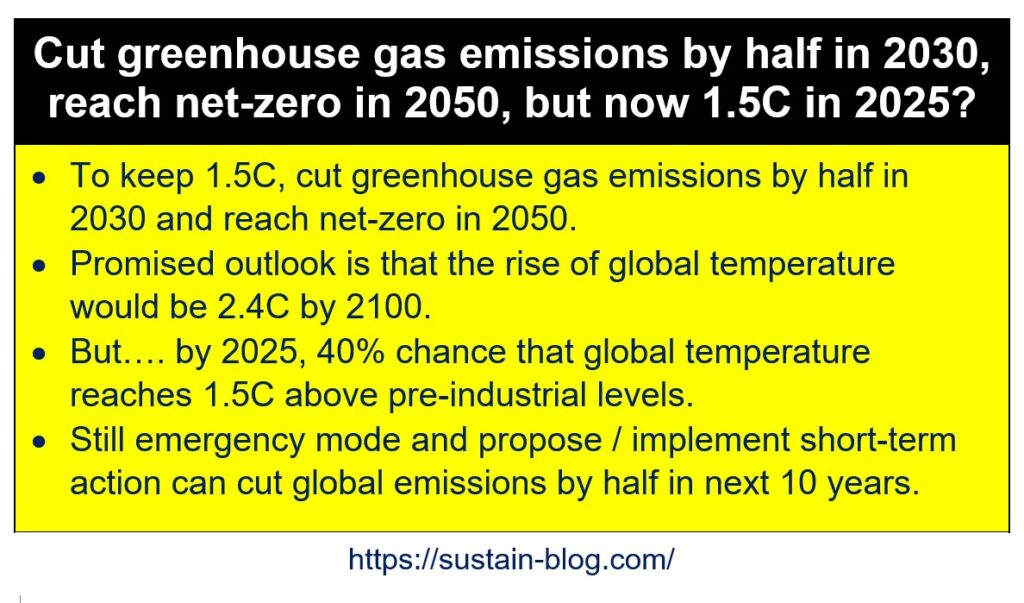
Set ambitious net‑zero targets, phase out coal subsidies, invest in public transit, enforce building‑code upgrades, and fund climate‑research and monitoring networks to close data gaps.
Closing Synthesis
The best‑available observations confirm that Earth’s surface temperature has risen about 1.1 °C since 1900, driven overwhelmingly by human‑generated greenhouse gases. This warming is already reshaping ecosystems, intensifying extreme weather, and affecting human health and economies worldwide. High‑confidence knowledge about the magnitude of warming and its primary cause provides a solid foundation for policy and action, while remaining uncertainties highlight the need for better regional data and understanding of feedbacks. Mitigation, adaptation, and equitable policy measures together offer the most realistic pathway to limit further temperature rise and protect both natural and human systems.
Frequently Asked Questions
How much has the global average temperature increased since 1900?
The global average surface temperature has risen about 1.1 °C (2.0 °F) from 1900 to the early 2020s, based on multiple independent datasets such as NOAA’s GHCN and the HadCRUT5 record.
What is the main cause of the temperature increase since 1900?
Human emissions of carbon dioxide, methane, and nitrous oxide from fossil‑fuel combustion, industry, and land‑use change are the dominant drivers, accounting for more than 95 % of the observed warming.
Which regions have warmed the most since 1900?
The Arctic has warmed the most—over 2 °C—roughly double the global average, while the Southern Ocean has shown the smallest surface temperature changes, less than 0.5 °C.
What are the biggest uncertainties about future warming?
Key uncertainties involve the strength of carbon‑cycle feedbacks (e.g., permafrost thaw), regional precipitation changes, and the temperature thresholds that could trigger rapid ice‑sheet loss.
What actions can governments take to limit further temperature rise?
Governments can set net‑zero emissions targets, phase out coal subsidies, invest in renewable energy and public transit, enforce stricter building‑code efficiency standards, and fund climate‑monitoring and research.





Leave a Comment