

A wind turbine’s electricity output depends on wind speed, turbine size, and efficiency, with modern onshore units typically delivering 1.5–3 MW under optimal conditions, enough to power hundreds of homes.
Quick Answer
Wind turbines convert kinetic energy from moving air into electrical current measured in megawatts (MW). A typical onshore turbine rated at 2 MW can generate between 0.5 MW and its full 2 MW depending on wind speed; offshore turbines can exceed 10 MW. Because power scales with the cube of wind speed, small changes in wind can cause large output variations. Overall, a single modern turbine supplies enough electricity for roughly 500–1,000 average households, though actual production varies with site-specific wind patterns and operational limits such as cut‑out speeds.
Key Takeaways
- Power output is measured in megawatts and is proportional to wind speed cubed.
- Typical onshore turbines are rated 1.5–3 MW; offshore models can exceed 10 MW.
- Actual current varies hourly; a 2 MW turbine may produce 0.5–2 MW depending on wind.
- High‑quality wind resources and proper siting double the energy yield compared with marginal sites.
- Uncertainty remains in long‑term wind resource forecasts and turbine performance degradation.
What Is How Much Current Does a Wind Turbine Produce?
The phrase refers to the electrical power a turbine delivers to the grid, expressed in watts (W) or megawatts (MW). It is distinct from mechanical torque or raw wind speed; it captures the net electrical output after conversion losses. Turbines range from small residential units (10 MW). Understanding current production is essential for grid planning, renewable‑energy targets, and assessing climate‑benefit potential.
How Does It Work?
1. Capturing Wind Energy
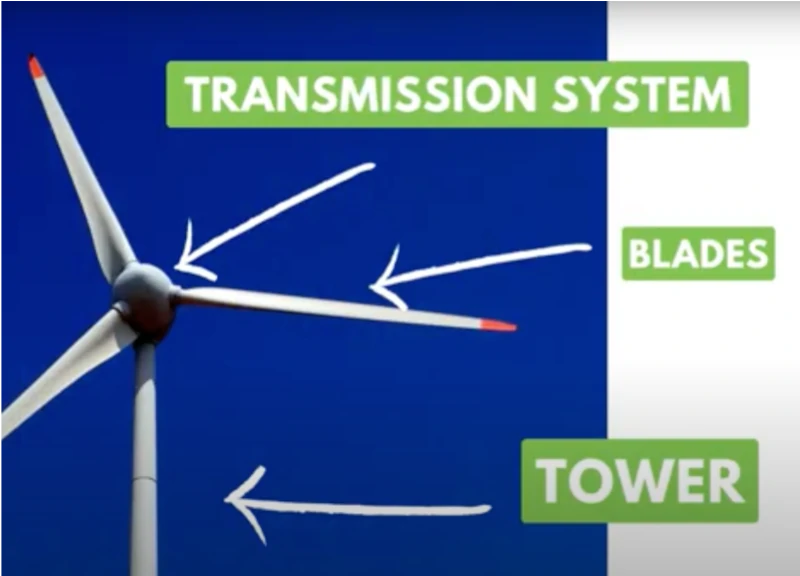
Wind exerts pressure on rotor blades, creating lift similar to an airplane wing. The lift forces the rotor to spin, converting kinetic energy into rotational mechanical energy.
2. Mechanical to Electrical Conversion
A low‑speed shaft from the rotor drives a gearbox that raises rotational speed to about 1,500 rpm, optimal for a generator. The generator’s electromagnetic induction produces alternating current (AC).
3. Power Electronics and Grid Connection
Power‑electronics converters rectify AC to direct current (DC) and then invert it back to grid‑compatible AC, controlling voltage and frequency. Control systems adjust blade pitch and yaw to maximize capture across wind speeds.
4. Influence of Wind Speed
The power equation P = ½ ρ A v³ (where ρ is air density, A rotor swept area, v wind speed) shows that doubling wind speed octuples power. Turbines have a cut‑in speed (~3 m/s) where they start generating, a rated speed (often 12–15 m/s) where they reach maximum output, and a cut‑out speed (~25 m/s) where they shut down to avoid damage.
What Does the Evidence Show?
Long‑term monitoring by the International Energy Agency (IEA, 2022) indicates that average capacity factors – the ratio of actual output to rated capacity – range from 30–45 % for onshore sites and 45–60 % for offshore farms. A 2 MW onshore turbine with a 35 % capacity factor produces about 6.1 GWh per year, enough for roughly 1,400 average‑US‑household electricity demands (U.S. Energy Information Administration, 2023). Field studies confirm that blade pitch control and advanced aerodynamics raise efficiency by 5–10 % compared with first‑generation models (European Wind Energy Association, 2021).
Main Causes or Drivers
Wind Resource Quality
Higher average wind speeds and low turbulence increase energy capture. Coastal and elevated ridge sites typically exceed 7 m/s annual average, while inland lowlands may stay below 5 m/s.
Turbine Design
Rotor diameter, blade airfoil shape, and generator type dictate how much kinetic energy can be converted. Larger rotors increase swept area (A) and thus potential power.
Operational Strategies
Real‑time forecasting, predictive maintenance, and adaptive pitch control keep turbines operating near their rated output, reducing downtime.
Environmental and Human Impacts
Environmental Impacts
Wind turbines emit no air pollutants during operation, displacing fossil‑fuel generation and averting CO₂ emissions estimated at 1.5 t per MWh (IPCC, 2021). Land‑use impacts are modest; turbine footprints occupy less than 2 % of a wind farm’s area, allowing concurrent agriculture. However, blade‑strike mortality for birds and bats is documented, especially at low‑altitude sites (U.S. Fish and Wildlife Service, 2020).
Human Health and Social Impacts
Communities near wind farms experience reduced local air‑quality‑related health risks. Noise and visual concerns are reported, but systematic reviews find no consistent evidence of adverse health outcomes when turbines meet regulatory standards (World Health Organization, 2022).
Economic and Infrastructure Impacts
Each turbine creates construction jobs and long‑term operations positions. In regions with high capacity factors, wind power can lower electricity prices and increase energy security.
Regional Differences
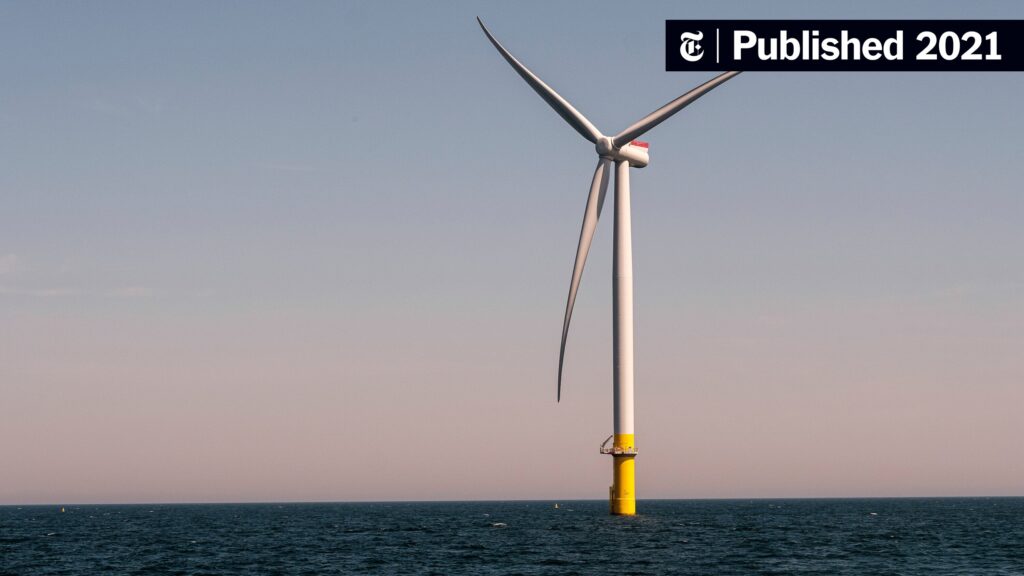
Europe’s offshore wind sector, led by the United Kingdom and Germany, averages capacity factors above 55 % thanks to strong North Sea winds (European Commission, 2023). In contrast, interior United States sites often record 30–35 % capacity factors, reflecting lower wind speeds. Tropical islands face challenges from variable wind direction and higher humidity, requiring corrosion‑resistant materials.
What Scientists Know With High Confidence
- The cubic relationship between wind speed and power is a fundamental physical law.
- Modern turbines reliably achieve capacity factors of 30–60 % depending on site quality.
- Wind energy displaces carbon‑intensive generation, delivering measurable CO₂ reductions.
- Operational cut‑in, rated, and cut‑out wind speeds are standardized across the industry.
What Remains Uncertain
Long‑term degradation of blade materials under varying climates is still being quantified, affecting lifetime energy yield estimates. Additionally, high‑resolution wind‑resource modeling for complex terrain can produce divergent forecasts, influencing siting decisions. Research into bat‑mortality mitigation, such as ultrasonic deterrents, is ongoing.
Common Misconceptions
Misconception: A turbine’s rated MW is the amount it constantly produces.
Reality: Rated capacity is the maximum output under ideal wind; actual average output is lower and expressed by the capacity factor.
Misconception: Wind turbines generate electricity even when the wind stops.
Reality: No wind means no kinetic energy; turbines produce no power below their cut‑in speed.
Misconception: Larger turbines always produce proportionally more electricity.
Reality: While larger rotors increase swept area, site wind speed and turbulence limit the achievable gains.
Solutions and Limitations
Improving turbine siting through high‑resolution wind mapping can raise capacity factors by up to 15 %. Offshore expansion leverages stronger, steadier winds but incurs higher capital costs and complex logistics. Hybrid renewable systems that pair wind with storage mitigate intermittency but require additional investment and land or marine space.
What Individuals, Communities, and Governments Can Do
What Individuals Can Do
- Support local zoning that encourages wind‑friendly land‑use planning.
- Choose electricity providers that source a share of power from wind farms.
What Communities and Organizations Can Do
- Participate in wind‑resource assessments and public hearings to ensure optimal siting.
- Develop community‑owned wind projects that retain economic benefits locally.
What Governments Can Do
- Implement transparent permitting processes and provide stable long‑term purchase agreements.
- Fund research on blade durability, wildlife mitigation, and offshore grid integration.
Synthesis
Wind turbines convert moving air into electrical current, with output governed by wind speed, turbine size, and technology. Evidence shows modern onshore turbines typically deliver 1.5–3 MW rated capacity and achieve 30–45 % capacity factors, enough to power hundreds of homes. High confidence exists in the physics of power capture and the climate benefits of displaced fossil fuel use. Uncertainties revolve around long‑term material performance and precise wind‑resource mapping in complex terrains. Continued research, thoughtful siting, and supportive policies can expand wind’s contribution while managing ecological trade‑offs.
Frequently Asked Questions
What does the rated megawatt rating of a wind turbine represent?
The rated megawatt (MW) rating is the maximum electrical power a turbine can generate under ideal wind conditions, typically at its design or rated wind speed.
How does wind speed affect the electricity a turbine produces?
Electricity production scales with the cube of wind speed, so a small increase in wind speed can lead to a large increase in power output, following the equation P = ½ ρ A v³.
What is a capacity factor and why is it important?
A capacity factor is the ratio of actual energy produced over a period to the energy the turbine would produce if it ran at full rated power continuously; it reflects real‑world performance and site quality.
Do wind turbines generate electricity when there is no wind?
No. Turbines need wind above their cut‑in speed (about 3 m/s) to turn the rotor and generate electricity; below that speed they produce none.
What are the main environmental benefits of wind turbine electricity?
Wind electricity emits no air pollutants during operation, offsets fossil‑fuel generation, and can reduce CO₂ emissions by roughly 1.5 tonnes per megawatt‑hour produced.





Leave a Comment