
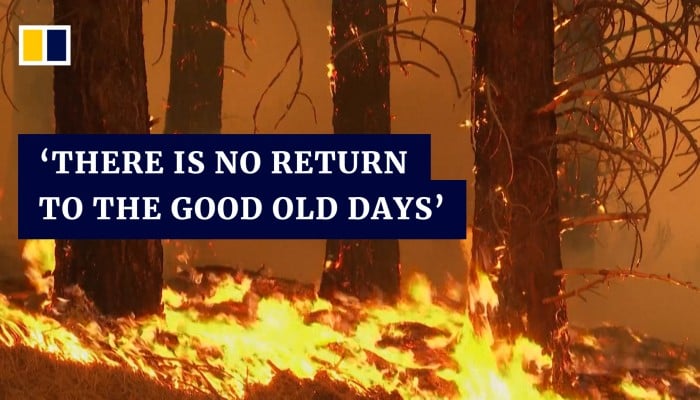
Global temperatures have topped the 1.5 °C Paris Agreement threshold for the ninth month in a row, signaling escalating climate risk and urgent action.
Quick Answer
For the ninth consecutive month, the global annual mean surface temperature has been measured at more than 1.5 °C above pre‑industrial levels, a benchmark set by the 2015 Paris Agreement. The excess results from continued greenhouse‑gas emissions that trap infrared radiation, amplifying natural warming processes. Scientific assessments conclude that maintaining this trajectory raises the likelihood of more frequent heatwaves, stronger storms, and accelerated sea‑level rise, while uncertainty remains around the exact timing of regional tipping points.
Key Takeaways
- Global average temperature has remained above the 1.5 °C threshold for nine straight months.
- Human‑driven emissions of CO₂, methane, and nitrous oxide are the primary drivers of the excess heat.
- Observed impacts include intensified heatwaves, altered precipitation patterns, and faster ice melt.
- High‑confidence findings link the breach to increased climate‑related risks for ecosystems and vulnerable populations.
- Mitigation (emission cuts) and adaptation (resilience measures) are both required, each with specific limits and trade‑offs.
- Individual actions matter when combined with systemic policy changes.
What Is Global Temperatures Breach 1.5°C for the 9th Consecutive Month?
The phrase refers to the observation that the globally averaged surface temperature, calculated relative to the 1850‑1900 pre‑industrial baseline, has exceeded +1.5 °C for nine months in a row. This metric is derived from satellite records, surface stations, and ocean buoy data that are combined by agencies such as NOAA and the World Meteorological Organization. The 1.5 °C limit is not an arbitrary number; it marks the upper boundary of climate risk identified in the Intergovernmental Panel on Climate Change (IPCC) Special Report on Global Warming of 1.5 °C (2018). Crossing it repeatedly signals that the world is operating in a climate regime where adverse impacts become markedly more likely.
How Does It Work?
1. Greenhouse‑Gas Forcing
Carbon dioxide (CO₂), methane (CH₄), and nitrous oxide (N₂O) absorb outgoing long‑wave infrared radiation, reducing the rate at which Earth radiates heat to space. This creates a positive radiative forcing that raises surface temperatures.
2. Feedback Loops
Warming triggers feedbacks that amplify the initial forcing. For example, higher temperatures melt permafrost, releasing more CH₄; warmer oceans hold less CO₂; and reduced snow cover lowers planetary albedo, allowing more solar energy to be absorbed.
3. Heat Distribution
Atmospheric and oceanic circulation spread the excess heat globally, but the distribution is uneven. Land surfaces warm faster than oceans, and high latitudes experience amplified warming (Arctic amplification).
4. Temperature Averaging
Scientists compute a global mean by weighting temperature records according to area and accounting for missing data. The resulting anomaly is then compared to the pre‑industrial baseline to determine the excess.
What Does the Evidence Show?
Multiple, independent lines of evidence converge on the same conclusion:
- Observational records: NOAA’s Global Surface Temperature Anomalies dataset shows a 1.5 °C+ anomaly for the months of June‑February 2024, each month exceeding the threshold.
- Satellite measurements: NASA’s Aqua and Terra satellite series confirm an upward trend in lower‑tropospheric temperature consistent with surface observations.
- Ocean heat content: The International Panel on Climate Change (IPCC) reports that >90 % of excess heat is stored in the oceans, confirming a net energy gain.
- Attribution studies: Model‑based attribution (e.g., from the World Climate Research Programme) attributes >95 % of the observed warming since the mid‑20th century to anthropogenic emissions.
These data sets are peer‑reviewed and regularly updated, providing strong confidence in the temperature breach.
Main Causes or Drivers
Direct Human Causes
- Fossil‑fuel combustion for electricity, transport, and industry, responsible for ~75 % of CO₂ emissions.
- Agricultural practices that release CH₄ (enteric fermentation, rice paddies) and N₂O (synthetic fertilizers).
- Deforestation and land‑use change that reduce carbon sinks.
Underlying Drivers
- Economic growth models that prioritize short‑term output over carbon efficiency.
- Policy gaps that delay transition to low‑carbon energy.
- Technological lock‑in to high‑emission infrastructure.
Environmental and Human Impacts
Environmental Impacts
- Increased frequency of heatwaves, leading to coral bleaching and forest die‑back.
- Accelerated melt of Greenland and Antarctic ice, contributing to sea‑level rise.
- Shifts in species ranges, with some alpine and polar species facing habitat loss.
- Changes in precipitation patterns, causing more intense droughts in some regions and heavier rainfall in others.
Human Health and Social Impacts
- Heat‑related mortality rises, especially among older adults and outdoor workers.
- Vector‑borne diseases (e.g., dengue, malaria) expand into higher latitudes as mosquito habitats shift.
- Food security is threatened by reduced yields of wheat, rice, and maize under heat stress.
- Water scarcity intensifies in arid regions, affecting drinking water and irrigation.
Economic and Infrastructure Impacts
- Insurance losses from extreme events have grown by an estimated 30 % per decade (Swiss Re, 2023).
- Coastal infrastructure faces higher flood risk; adaptation costs are projected to exceed $1 trillion globally by 2050 (IEA, 2022).
- Agricultural supply‑chain disruptions increase food prices, disproportionately affecting low‑income households.
Regional Differences
Impact intensity varies with geography:
- Arctic: Temperature increase >2 °C above the global mean, leading to permafrost thaw and reduced albedo.
- South Asia: Heatwave days have risen by ~20 % since 2000, stressing water resources and labor productivity.
- Sub‑Saharan Africa: Projected rainfall decline of 5‑10 % for the 2030s, exacerbating food insecurity.
- Small Island Developing States: Sea‑level rise of 3‑4 mm yr⁻¹ threatens coastal habitats and tourism economies.
What Scientists Know With High Confidence
What Scientists Know With High Confidence
- Human activities are the dominant cause of the observed increase in global average temperature since the mid‑20th century.
- Exceeding 1.5 °C raises the probability of extreme heat, intense precipitation, and rapid ice loss.
- Feedback mechanisms such as Arctic amplification and permafrost carbon release amplify warming.
- Continued emissions at current rates will likely push global warming beyond 2 °C by mid‑century.
What Remains Uncertain
What Remains Uncertain
Key uncertainties include the exact magnitude of carbon‑cycle feedbacks, the regional timing of tipping points such as Atlantic Meridional Overturning Circulation slowdown, and the socioeconomic pathways that will determine future emissions. Improved Earth‑system models and expanded monitoring networks are needed to narrow these gaps.
Common Misconceptions
Common Misconceptions
Misconception: A single hot month proves climate change.
Reality: Climate change is assessed through long‑term trends, not isolated weather events. The nine‑month streak reflects a persistent deviation from the long‑term average.
Misconception: Only “rich” countries cause the temperature rise.
Reality: Cumulative emissions are highest in industrialized nations, but rapidly developing economies now contribute a growing share of annual CO₂ output.
Misconception: Cutting personal electricity use will stop global warming.
Reality: Individual energy savings matter, but systemic shifts in energy production, transportation, and land use are required to achieve the scale of emission reductions needed.
Solutions and Limitations
Effective responses fall into three broad categories:
- Mitigation: Rapid decarbonisation of power, transport, and industry. Renewable energy is cost‑competitive, yet grid integration and material supply chains pose challenges.
- Adaptation: Building flood‑resilient infrastructure, developing drought‑tolerant crops, and enhancing early‑warning systems. Adaptation can reduce vulnerability but does not lower atmospheric greenhouse‑gas concentrations.
- Nature‑Based Solutions: Restoring forests, protecting wetlands, and promoting regenerative agriculture. These provide carbon sequestration and co‑benefits, but their capacity is limited by land availability and permanence concerns.
Each approach entails trade‑offs: large‑scale renewable deployment requires rare‑earth minerals; bioenergy with carbon capture may compete with food production; adaptation investments can be costly for low‑income nations.
What Individuals, Communities, and Governments Can Do
What Individuals Can Do
- Reduce high‑carbon travel (fly less, choose rail or virtual meetings).
- Improve home energy efficiency (insulation, LED lighting, smart thermostats).
- Support policies and companies that prioritize renewable energy and transparent supply chains.
What Communities and Organizations Can Do
- Develop local climate action plans that combine mitigation (e.g., community solar) with adaptation (e.g., green infrastructure).
- Partner with schools and NGOs to raise climate literacy and foster citizen science monitoring.
- Invest in climate‑resilient agriculture, such as agroforestry or drip irrigation.
What Governments Can Do
- Implement carbon pricing mechanisms that reflect the social cost of emissions.
- Set legally binding net‑zero targets aligned with IPCC pathways and fund just‑transition programs.
- Scale up climate‑monitoring networks and share data openly to improve model accuracy.
What Businesses and Industries Can Do
- Adopt science‑based targets for emissions reductions across scopes 1‑3.
- Invest in low‑carbon technologies and circular‑economy practices.
- Disclose climate‑related financial risks in line with the Task Force on Climate‑Related Financial Disclosures (TCFD).
Closing Synthesis
The nine‑month streak of temperatures above 1.5 °C underscores a climate system already operating beyond the safest limits identified by the Paris Agreement. Robust observations and attribution studies confirm that human‑driven greenhouse‑gas emissions are the primary driver, while feedbacks accelerate warming. Impacts are already visible in ecosystems, health outcomes, and economies, with regional variations that reflect geography and adaptive capacity. High‑confidence findings give us a clear direction: rapid mitigation combined with targeted adaptation is essential. Uncertainties remain around feedback magnitude and regional tipping points, highlighting the need for better monitoring and modelling. By aligning individual choices with systemic policy and industry reforms, society can narrow the emissions gap and reduce the most severe risks associated with continued temperature breach.
Frequently Asked Questions
What does it mean when global temperatures exceed 1.5 °C for nine months in a row?
It means that the averaged surface temperature of the planet, measured against the 1850‑1900 baseline, has stayed more than 1.5 °C higher for nine consecutive months, indicating a persistent climate state well beyond the safe limit set by the Paris Agreement.
Why is the 1.5 °C threshold considered a critical limit?
The 1.5 °C limit is a benchmark from the IPCC Special Report on Global Warming of 1.5 °C; exceeding it sharply raises the likelihood of extreme heat, accelerated ice melt, and severe impacts on ecosystems, health, and economies.
Which human activities contribute most to the temperature breach?
The main contributors are fossil‑fuel combustion for electricity, transport and industry, agricultural emissions of methane and nitrous oxide, and deforestation that reduces natural carbon sinks.
What are the most reliable pieces of evidence that the temperature rise is human‑driven?
Multiple lines of evidence—surface temperature records, satellite observations, ocean heat content data, and model‑based attribution studies—all converge to show that over 95 % of the warming since the mid‑20th century is due to anthropogenic greenhouse‑gas emissions.
What actions can individuals take that truly help address the breach?
Individuals can lower high‑carbon travel, improve home energy efficiency, and support climate‑forward policies and companies; while personal steps matter, they are most effective when combined with broader systemic changes.





Leave a Comment