
{
“title”: “Global Temperature Change Since 1900: What the Numbers Reveal”,
“content”: “
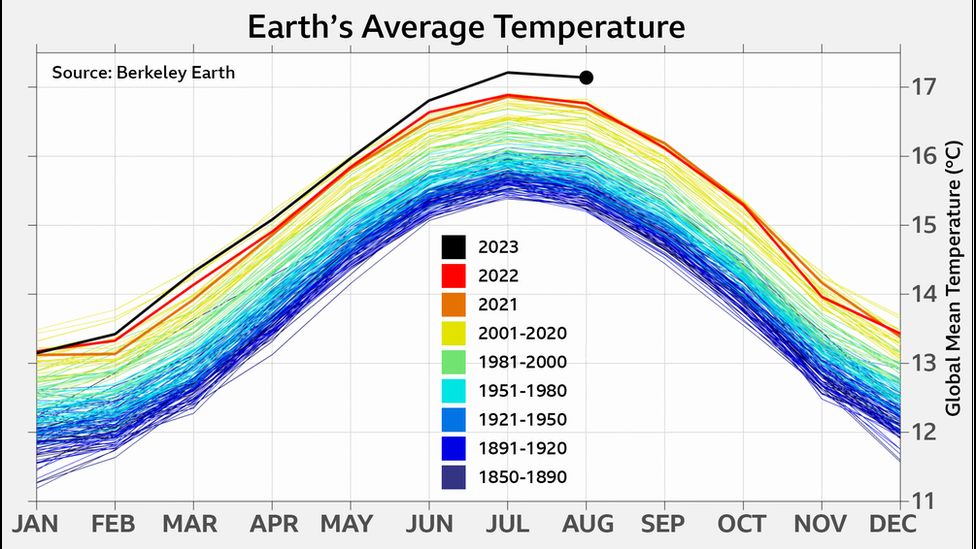
Since 1900 the Earth’s average surface temperature has risen about 1.2 °C, a change driven largely by human greenhouse‑gas emissions and documented through multiple independent data sets.
\n
Quick Answer
\n
Global temperature change since 1900 refers to the measured rise in the planet’s average surface temperature, primarily caused by increasing concentrations of carbon dioxide, methane, and other greenhouse gases from fossil‑fuel combustion, deforestation, and industrial processes. The most robust evidence comes from long‑term instrumental records, satellite observations, and climate‑model attribution studies, all indicating a clear warming trend of roughly 1.2 °C over the past 120 years. This warming amplifies extreme weather, sea‑level rise, and ecosystem stress, though natural variability adds uncertainty to short‑term fluctuations.
\n
\n
Key Takeaways
\n
- \n
- Instrumental records show a global mean temperature increase of about 1.2 °C from 1900 to 2023.
- Human emissions of CO₂ and other greenhouse gases account for roughly 95 % of the observed warming since the mid‑20th century.
- Warming is uneven: the Arctic has warmed more than twice the global average, while some tropical regions show smaller trends.
- High‑confidence findings include rising sea levels, shrinking ice sheets, and increased frequency of heat‑related extremes.
- Key uncertainties involve climate sensitivity on centennial scales, regional precipitation changes, and future socioeconomic pathways.
\n
\n
\n
\n
\n
\n
\n
What Is Global Temperature Change Since 1900?
\n
Global temperature change since 1900 refers to the long‑term trend in the Earth’s average near‑surface air temperature measured from a network of land stations, ocean buoys, and satellite instruments. The baseline period (1900‑1920) is often used as a reference point because it marks the start of systematic, worldwide observations. The term differs from short‑term weather variations; it captures climate‑scale shifts that persist for decades or longer.
\n
How Does It Work?
\n
1. Greenhouse‑Gas Forcing
\n
Human activities release greenhouse gases (GHGs) that trap outgoing infrared radiation, creating a radiative forcing that raises surface temperatures. Carbon dioxide concentrations rose from about 295 ppm in 1900 to over 420 ppm in 2023, according to the National Oceanic and Atmospheric Administration (NOAA) Global Monitoring Laboratory.
\n
2. Energy Balance Shift
\n
The Earth’s energy budget must balance incoming solar radiation with outgoing infrared radiation. Increased GHGs reduce the efficiency of infrared loss, causing a net energy gain that manifests as warming of the atmosphere, oceans, and land surfaces.
\n
3. Feedback Mechanisms
\n
Warming triggers feedbacks that can amplify or dampen the initial forcing. For example, melting sea ice reduces surface albedo (reflectivity), leading to more solar absorption—a positive feedback. Conversely, increased cloud cover in some regions may reflect more sunlight, acting as a negative feedback. The Intergovernmental Panel on Climate Change (IPCC) assesses that net feedbacks are positive, enhancing the overall warming.
\n
What Does the Evidence Show?
\n
Multiple independent lines of evidence converge on the same conclusion:
\n
- \n
- Instrumental Records: The Global Historical Climatology Network (GHCN) and HadCRUT4 datasets show a mean global temperature rise of ~1.2 °C from 1900 to 2023.
- Satellite Observations: Microwave Sounding Unit (MSU) data confirm tropospheric warming consistent with surface trends.
- Paleoclimate Reconstructions: Ice‑core and tree‑ring proxies indicate that the recent warming exceeds natural variability of the past millennium.
- Attribution Studies: Model‑based detection‑and‑attribution analyses (e.g., IPCC AR6, 2021) attribute >95 % of post‑1950 warming to anthropogenic GHG emissions.
\n
\n
\n
\n
\n
Main Causes or Drivers
\n
Direct Human Causes
\n
Burning of coal, oil, and natural gas for energy; cement production; and land‑use change are the primary sources of CO₂. Methane emissions arise from agriculture, waste management, and fossil‑fuel extraction.
\n
Underlying Drivers
\n
Economic growth, population increase, and energy demand have amplified GHG emissions. Policy decisions, such as subsidies for fossil fuels, influence the trajectory of emissions.
\n
Natural Influences
\n
Solar irradiance, volcanic aerosols, and internal climate variability (e.g., El Niño–Southern Oscillation) modulate temperature on decadal scales but cannot explain the long‑term upward trend.
\n
Environmental and Human Impacts
\n
Environmental Impacts
\n
- \n
- Accelerated melting of Greenland and Antarctic ice sheets, contributing to sea‑level rise of ~21 cm since 1900 (IPCC AR6, 2021).
- Shift of biomes toward higher latitudes and elevations, affecting biodiversity and ecosystem services.
- Increased frequency of marine heatwaves, leading to coral bleaching and altered fisheries.
\n
\n
\n
\n
Human Health and Social Impacts
\n
- \n
- Heat‑related mortality rises, especially among elderly and outdoor workers.
- Changes in vector‑borne disease patterns, such as expanded ranges of mosquitoes carrying dengue or malaria.
- Reduced agricultural yields in heat‑stressed regions, threatening food security for low‑income populations.
\>
\n
\n
\n
Economic and Infrastructure Impacts
\n
- \n
- Higher cooling demand increases energy costs and strain on power grids.
- Coastal flooding damages property and requires costly adaptation measures.
- Insurance losses from extreme weather events have risen markedly over the past two decades.
\n
\n
\n
\n
Regional Differences
\n
Warming is not uniform. The Arctic has warmed about 2.5 °C, roughly twice the global mean, leading to permafrost thaw and amplified feedbacks. Tropical regions show smaller absolute temperature gains but experience pronounced precipitation changes, affecting agriculture. In the Southern Hemisphere, oceanic heat uptake moderates land‑temperature rise, yet sea‑level rise is globally experienced.
\n
What Scientists Know With High Confidence
\n
- \n
- Global average surface temperature has risen ~1.2 °C since 1900.
- Human‑generated greenhouse gases are the dominant cause of post‑1950 warming.
- Sea level has risen due to thermal expansion and ice‑sheet melt.
- Heat‑related extreme events are becoming more frequent and intense.
\n
\n
\n
\n
\n
\n
What Remains Uncertain
\n
Key uncertainties include the exact magnitude of climate sensitivity on centennial timescales, regional precipitation projections, and the rate of permafrost carbon release. These gaps stem from limited observational coverage in remote areas and from complex feedbacks that are difficult to simulate accurately. Ongoing satellite missions and expanded ground networks aim to reduce these uncertainties.
\n
\n
Common Misconceptions
\n
Misconception: The warming is only a few decades old.
\n
Reality: Instrumental records show a continuous upward trend spanning more than a century, with the most rapid increase occurring after the 1970s.
\n
Misconception: Natural cycles can fully explain the rise.
\n
Reality: Climate‑model attribution studies demonstrate that natural forcings (solar variability, volcanic activity) account for less than 5 % of the observed warming since 1950.
\n
Misconception: A 1 °C rise is harmless.
\n
Reality: Even a 1 °C increase has already altered precipitation patterns, intensified heatwaves, and contributed to species range shifts, indicating that small temperature changes can have substantial impacts.
\n
\n
Solutions and Limitations
\n
Effective responses combine mitigation—reducing GHG emissions—and adaptation—preparing for unavoidable changes.
\n
- \n
- Rapid Decarbonisation: Transitioning to renewable electricity, improving energy efficiency, and electrifying transport can cut emissions, but requires substantial investment, grid upgrades, and policy support.
- Carbon Pricing: Market mechanisms encourage low‑carbon choices but may face political resistance and need safeguards to protect vulnerable households.
- Nature‑Based Solutions: Reforestation and wetland restoration sequester carbon and provide co‑benefits, yet they are limited by land availability and long‑term management.
- Adaptation Infrastructure: Building sea‑walls, improving water storage, and designing heat‑resilient cities reduce risk, but cannot reverse underlying warming and may have ecological trade‑offs.
\n
\n
\n
\n
\n
What Individuals, Communities, and Governments Can Do
\n
What Individuals Can Do
\n
- \n
- Reduce personal energy use (e.g., efficient appliances, home insulation).
- Choose low‑carbon transportation modes such as public transit, cycling, or electric vehicles where feasible.
- Support policies and candidates that prioritize climate mitigation.
\n
\n
\n
\n
What Communities and Organizations Can Do
\n
- \n
- Develop local climate action plans that include renewable energy projects and green infrastructure.
- Implement community‑scale energy storage and demand‑response programs.
- Promote climate‑smart agriculture and water‑conservation practices.
\n
\n
\n
\n
What Governments Can Do
\n
- \n
- Set ambitious, legally binding emission‑reduction targets aligned with the Paris Agreement.
- Invest in research, development, and deployment of clean‑energy technologies.
- Provide just‑transition support for workers in fossil‑fuel sectors.
- Enhance climate‑monitoring networks to fill data gaps, especially in vulnerable regions.
\n
\n
\n
\n
\n
Closing Synthesis
\n
The temperature record since 1900 tells a clear story: the planet has warmed by about 1.2 °C, driven primarily by human emissions of greenhouse gases. Robust observations, satellite data, and attribution studies give high confidence to this conclusion, while uncertainties remain around regional climate responses and long‑term feedbacks. Mitigation and adaptation strategies—ranging from rapid decarbonisation to resilient infrastructure—are essential, each with its own set of trade‑offs. By understanding the numbers and the science behind them, societies can make informed decisions that balance urgency with practicality.
“,
“excerpt”: “Since 1900 the Earth has warmed about 1.2 °C due to human greenhouse‑gas emissions, a trend confirmed by multiple data sets and linked to sea‑level rise, extreme heat, and ecosystem shifts.”,
“tags”: [“global warming”,”temperature trends”,”climate change”,”IPCC”,”climate science”],
“faq”: [
{
“question”: “What is the measured increase in global temperature since 1900?”,
“answer”: “The global average surface temperature has risen approximately 1.2 °C from the early 20th‑century baseline (1900‑1920) to 2023, according to combined land‑station and ocean‑based datasets.”
},
{
“question”: “How do scientists know that human activities are the main cause of warming?”,
“answer”: “Detection‑and‑attribution studies using climate models show that over 95 % of the warming observed since the mid‑20th century can be explained by the increase in greenhouse gases from fossil‑fuel combustion, deforestation, and industry.”
},
{
“question”: “Why does warming affect some regions more than others?”,
“answer”: “Geographic factors, such as latitude, ocean currents, and land‑surface characteristics, cause uneven warming; the Arctic has warmed about twice as fast as the global average, while tropical land areas show smaller temperature changes but larger shifts in precipitation.”
},
{
“question”: “What are the main uncertainties remaining in climate projections?”,
“answer”: “Key uncertainties involve the precise value of climate sensitivity on long timescales, how regional precipitation patterns will change, and the rate at which permafrost carbon may be released, all of which depend on limited observations and complex feedbacks.”
},
{
“question”: “What actions can individuals take to help limit further warming?”,
“answer”: “Individuals can lower household energy demand through efficient appliances and insulation, choose low‑carbon transport options such as public transit or electric vehicles, and support climate‑friendly policies and leaders.”
}
]
}






Leave a Comment