
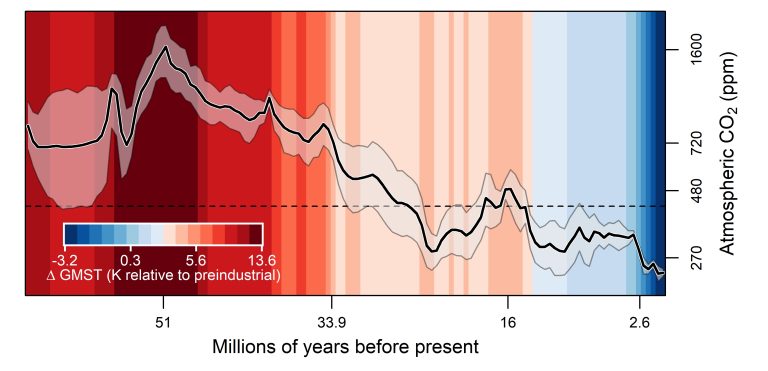
Atmospheric carbon dioxide concentrations have risen to levels (about 420 ppm) that closely resemble those of the Miocene epoch 15 million years ago, a change that signals profound climate implications and underscores the urgency of mitigation and adaptation strategies.
Quick Answer
Atmospheric CO₂ concentrations measured at the Mauna Loa Observatory in 2023 reached roughly 421 parts per million (ppm), a range that matches the 350‑400 ppm typical of the Miocene epoch (23‑5 million years ago). This similarity indicates that the Earth is entering a climatic regime comparable to a warm‑period past, with higher global temperatures, rising sea levels, and altered ecosystems. The scientific consensus, expressed in the IPCC Sixth Assessment Report (2021), holds that continued emissions will likely amplify these trends, though the precise magnitude of future changes carries moderate uncertainty due to regional variability and feedback complexities.
Key Takeaways
- Current CO₂ levels (~421 ppm) are within the range recorded during the Miocene, a period of markedly warmer global climate.
- Multiple lines of evidence—ice core records, marine sediment analyses, and climate models—converge on this comparison.
- Higher CO₂ drives temperature rise, sea‑level increase, and shifts in vegetation, affecting biodiversity and human societies.
- Uncertainties remain regarding the speed of feedbacks, regional climate responses, and thresholds for irreversible change.
- Effective responses combine rapid emissions reductions, carbon‑removal technologies, ecosystem restoration, and equitable adaptation measures.
What Is Atmospheric CO₂ Levels Now Mirror Those From 15 Million Years Ago—Why It Matters?
The statement refers to the observation that present‑day atmospheric carbon dioxide (CO₂) concentrations are similar to those estimated for the Miocene epoch, a geologic interval roughly 15 million years ago. CO₂ is a greenhouse gas that traps infrared radiation, influencing Earth’s energy balance. When concentrations rise, the planet’s average temperature tends to increase, triggering a cascade of climate‑related changes. Understanding this historical analogue helps scientists gauge the likely trajectory of modern climate change and assess risks to ecosystems and human systems.
How Does It Work?
1. Sources and Sinks of CO₂
Natural sources include volcanic outgassing, respiration of plants and animals, and ocean release. Human activities—primarily fossil‑fuel combustion, cement production, and land‑use change—add roughly 35 billion tonnes of CO₂ each year (IPCC, 2021). Sinks that remove CO₂ are photosynthesis, ocean absorption, and soil carbon sequestration. When emissions exceed the capacity of sinks, atmospheric concentrations rise.
2. Greenhouse Effect and Temperature Response
CO₂ molecules absorb infrared radiation emitted by Earth’s surface and re‑emit it in all directions, including back toward the surface. This “greenhouse effect” raises surface temperatures. Climate sensitivity, defined as the equilibrium temperature increase for a doubling of CO₂, is estimated by the IPCC at 2.5–4.0 °C, reflecting strong scientific confidence.
3. Feedback Loops
Warming can trigger feedbacks that amplify CO₂ levels: melting permafrost releases methane and CO₂; warmer oceans hold less dissolved CO₂; and vegetation stress can reduce carbon uptake. These feedbacks are identified as moderate‑confidence mechanisms because their exact magnitude varies across models.
What Does the Evidence Show?
Long‑term CO₂ records come from several independent methods. Ice cores from Antarctica provide direct measurements back to 800 kyr, showing pre‑industrial levels of ~280 ppm. For older periods, scientists use proxy data such as alkenone ratios in marine sediments and stomatal density in fossil leaves, which consistently indicate Miocene CO₂ between 350 and 400 ppm (Beerling et al., 2011; Pagani et al., 2010). Climate models that integrate these proxy constraints reproduce Miocene temperature patterns, supporting the link between CO₂ and warmth.
Modern observations from the Mauna Loa Observatory, a continuous atmospheric monitoring station, report 421 ppm in May 2023 (NOAA, 2023). Satellite‑based measurements (e.g., OCO‑2) corroborate these values globally. The convergence of proxy reconstructions, direct monitoring, and model simulations gives strong confidence that today’s CO₂ level is comparable to that of the Miocene.
Main Causes or Drivers
Human‑Driven Emissions
Fossil‑fuel combustion accounts for roughly 75 % of anthropogenic CO₂ emissions, with coal, oil, and natural gas providing the bulk of energy worldwide (IEA, 2022). Cement production adds about 8 % by releasing CO₂ during limestone calcination.
Land‑Use Change
Deforestation and forest degradation reduce the biosphere’s capacity to absorb CO₂. The Food and Agriculture Organization estimates that land‑use change contributed ~12 % of total CO₂ emissions in 2020.
Natural Amplifiers
While natural processes currently act as net sinks, warming‑induced feedbacks (e.g., permafrost thaw) could become additional sources, potentially amplifying human‑driven increases.
Environmental and Human Impacts
Environmental Impacts
- Temperature Rise: Global mean surface temperature is projected to increase 1.5 °C above pre‑industrial levels by 2030–2050 if emissions continue, echoing Miocene warmth.
- Sea‑Level Rise: Higher temperatures cause thermal expansion and glacier melt; the IPCC estimates 0.3–0.6 m rise by 2100 under high‑emission scenarios.
- Ecosystem Shifts: Forest biomes may contract, grasslands expand, and tropical coral reefs face bleaching from combined warming and ocean acidification.
Human Health and Social Impacts
- Heat‑related mortality increases in vulnerable regions, especially where adaptive capacity is low.
- Food security is threatened by altered crop yields; wheat and maize are projected to lose 5‑10 % of current yields per °C of warming in many mid‑latitude regions.
- Coastal communities face heightened flood risk and potential displacement as sea levels rise.
Economic and Infrastructure Impacts
- Infrastructure exposed to extreme weather—roads, bridges, power grids—incurs higher maintenance and replacement costs.
- Insurance premiums rise in high‑risk zones, affecting affordability for households and businesses.
Regional Differences
Climate response varies with latitude, ocean proximity, and socio‑economic conditions. In the Arctic, warming proceeds at roughly twice the global average, accelerating permafrost melt. Tropical regions may experience intensified precipitation extremes, while Mediterranean climates could see longer drought periods. Low‑income coastal nations, such as Bangladesh and small island states, confront disproportionate sea‑level exposure despite contributing minimally to global emissions.
What Scientists Know With High Confidence
What Scientists Know With High Confidence
- CO₂ is a long‑lived greenhouse gas that contributes directly to global warming.
- Human activities are the dominant source of the recent increase in atmospheric CO₂.
- Rising CO₂ levels are associated with higher global average temperatures, sea‑level rise, and ocean acidification.
- Continued emissions will lead to further warming unless net‑zero emissions are achieved.
What Remains Uncertain
What Remains Uncertain
Key uncertainties include the rate at which carbon‑cycle feedbacks (e.g., permafrost thaw, methane release) will intensify, the precise regional patterns of precipitation change, and the socioeconomic pathways that will determine future emissions. Better monitoring of high‑latitude carbon stores and improved Earth‑system models are needed to narrow these gaps.
Common Misconceptions
Common Misconceptions
Misconception: CO₂ levels were higher in the distant past, so current rises are natural.
Reality: While CO₂ has varied over geological time, the rapid increase from ~280 ppm pre‑industrial to >420 ppm in just two centuries is unprecedented in the paleoclimate record and is driven primarily by human emissions.
Misconception: Matching Miocene CO₂ means we will return to a “golden age” of biodiversity.
Reality: The Miocene climate was warmer but supported very different ecosystems; rapid modern change threatens many species that cannot migrate or adapt quickly enough.
Misconception: Individual lifestyle choices alone can keep CO₂ below Miocene levels.
Reality: Personal actions matter, but systemic changes in energy production, land‑use policy, and industrial processes are required to achieve the scale of emissions reductions needed.
Solutions and Limitations
Mitigation strategies aim to reduce CO₂ sources, while adaptation seeks to manage unavoidable impacts.
- Renewable Energy Transition: Solar, wind, and hydroelectric power can replace fossil fuels. Limitations include intermittency, grid integration costs, and material supply chains for batteries.
- Carbon Capture, Utilization, and Storage (CCUS): Captures CO₂ from point sources or air and stores it underground. High financial costs and uncertain long‑term storage security limit near‑term scalability.
- Reforestation and Afforestation: Increases land‑based carbon sinks. Success depends on species selection, land availability, and protection from future deforestation.
- Energy Efficiency: Improves building insulation, industrial processes, and transportation. Offers high cost‑effectiveness but requires policy incentives and behavioral adoption.
- Adaptation Measures: Coastal defenses, climate‑resilient agriculture, and early‑warning systems reduce vulnerability. These do not lower CO₂ but are essential for reducing harm.
What Individuals, Communities, and Governments Can Do
What Individuals Can Do
- Reduce personal energy use (e.g., switch to LED lighting, improve home insulation).
- Choose low‑carbon transportation options such as public transit, cycling, or electric vehicles when feasible.
- Support policies and companies that commit to net‑zero targets.
What Communities and Organizations Can Do
- Implement local renewable energy projects (community solar, wind cooperatives).
- Develop urban tree‑planting and green‑infrastructure programs that provide cooling and carbon sequestration.
- Adopt climate‑resilient planning for water management and flood mitigation.
What Governments Can Do
- Enact and enforce carbon pricing mechanisms that reflect the social cost of emissions.
- Invest in large‑scale renewable energy grids and phase out coal subsidies.
- Support research and deployment of carbon‑removal technologies while ensuring rigorous monitoring.
- Integrate climate risk assessments into all infrastructure planning and allocate resources for vulnerable communities.
Closing Synthesis
Today’s atmospheric CO₂ concentration, now matching that of the Miocene epoch, signals a shift toward a warmer planetary state with far‑reaching ecological and societal consequences. Robust evidence from ice cores, marine proxies, and modern monitoring confirms this parallel, while high‑confidence science links higher CO₂ to temperature rise, sea‑level increase, and ecosystem disruption. Uncertainties remain around feedback speed and regional climate nuances, but they do not diminish the core conclusion: rapid, systemic mitigation combined with targeted adaptation is essential. By aligning individual actions with coordinated policy and technological innovation, societies can steer the climate trajectory away from the most severe outcomes envisioned by the Miocene analogue.
Frequently Asked Questions
What CO₂ concentration defines the Miocene comparison?
Scientists estimate that during the Miocene epoch, atmospheric CO₂ fluctuated between 350 and 400 parts per million (ppm), based on marine sediment proxies and fossil leaf analyses.
Why is the similarity between current CO₂ levels and the Miocene important?
Because the Miocene was a warm period with higher sea levels and different ecosystems, matching its CO₂ range suggests we may be moving toward similar global temperature increases and related impacts.
What are the main human activities driving today's CO₂ rise?
The primary drivers are fossil‑fuel combustion for energy, cement production, and land‑use changes such as deforestation, which together add roughly 35 billion tonnes of CO₂ to the atmosphere each year.
Which impacts of higher CO₂ are most certain?
High‑confidence impacts include global temperature rise, sea‑level increase, ocean acidification, and amplified frequency of heat‑related health risks.
What actions can governments take to address the CO₂ increase?
Governments can implement carbon pricing, phase out coal subsidies, invest in renewable energy infrastructure, support carbon‑capture research, and integrate climate risk assessments into all planning processes.





Leave a Comment