

April 2024 marks the eleventh consecutive month in which global surface temperatures have set a new record, highlighting a persistent warming trend that reflects both natural variability and human‑driven climate change.
Quick Answer
Since June 2023, each month through April 2024 has recorded the highest global average surface temperature for that calendar month since systematic monitoring began in 1880. The primary driver is the accumulation of greenhouse gases—especially carbon dioxide and methane—from fossil‑fuel combustion, deforestation, and industrial agriculture, which trap infrared radiation and raise the planet’s energy balance. The consensus of major assessments (e.g., the IPCC Sixth Assessment Report, 2021) indicates that this streak is a clear signal of ongoing anthropogenic warming, and it already translates into heightened heat‑related health risks, strained water resources, and accelerated ecosystem disruption. Uncertainty remains in the exact magnitude of regional impacts and in future emission pathways.
Key Takeaways
- Eleven straight months of record global temperatures have been documented from June 2023 to April 2024.
- Human‑generated greenhouse gases are the dominant cause, with carbon dioxide concentrations exceeding 420 ppm in 2023.
- Warming amplifies heatwaves, droughts, and extreme weather, affecting agriculture, health, and infrastructure worldwide.
- High‑confidence findings include the link between greenhouse‑gas emissions and global‑average temperature rise.
- Uncertainties focus on regional climate responses, feedback strength, and the timing of tipping points.
- Effective responses combine rapid mitigation, targeted adaptation, and equitable policy measures.
What Is April Marks 11th Straight Month of Record Global Temperatures?
The phrase refers to the observation that, for eleven consecutive months, the global mean surface temperature (GMST) for each calendar month has surpassed all previously recorded values for that month since the start of the modern instrumental record in 1880. GMST is calculated by averaging temperature readings from thousands of land‑based stations, ships, buoys, and satellite‑derived datasets, weighted to represent the entire Earth surface. This streak does not imply that every single day is hotter than any past day, but that the monthly averages are unprecedented.
How Does It Work?
1. Greenhouse‑Gas Forcing
Carbon dioxide, methane, and nitrous oxide absorb infrared radiation emitted by Earth’s surface and re‑emit it downward, creating a radiative forcing that adds energy to the climate system. The Keeling Curve shows atmospheric CO₂ rising from ~315 ppm in 1958 to over 420 ppm in 2023, a change that accounts for roughly 1.8 W m⁻² of forcing (IPCC, 2021).
2. Energy Imbalance and Temperature Response
The added forcing creates an imbalance between incoming solar radiation and outgoing longwave radiation. The ocean absorbs most of the excess heat, but a portion raises atmospheric temperatures, which in turn warm land and sea surfaces. The climate system’s inertia means that temperatures continue to rise even if emissions were halted today.
3. Monthly Averaging
Scientists compile daily observations into monthly means, then compare each month’s mean to the historical distribution for that month. A “record” month occurs when the current mean exceeds the previous maximum, accounting for data homogenization and uncertainty.
What Does the Evidence Show?
Multiple independent lines of evidence converge on the conclusion that the planet is warming:
- Instrumental records: Global‑average surface temperature datasets from NASA GISTEMP, NOAA GlobalTemp, and the UK Met Office HadCRUT all show a rise of ~1.1 °C since the pre‑industrial baseline (1850–1900) (IPCC, 2021).
- Satellite observations: Microwave Sounding Unit (MSU) data confirm warming of the lower troposphere consistent with surface trends.
- Attribution studies: Model‑based detection‑and‑attribution analyses attribute more than 95 % of the observed warming since the mid‑20th century to anthropogenic greenhouse gases (IPCC, 2021; NOAA, 2023).
- Paleoclimate context: Ice‑core and sediment records indicate that recent temperatures are unprecedented in at least the last 2,000 years.
These observations collectively support the record‑month streak as a manifestation of the long‑term warming signal rather than a statistical fluke.
Main Causes or Drivers
Direct Human Causes
- Fossil‑fuel combustion: Power generation, transportation, and industry release ~36 Gt CO₂ yr⁻¹ (2022 data, IEA).
- Agriculture and waste: Methane from livestock and rice paddies, plus nitrous oxide from fertilizers, contribute ~10 % of total radiative forcing.
- Land‑use change: Deforestation reduces carbon uptake and releases stored carbon, accounting for ~5 % of CO₂ emissions.
Amplifying Natural Factors
- El Niño Southern Oscillation (ENSO): The 2023—2024 El Niño phase contributed additional warming of ~0.1 °C to global averages, but it does not drive the underlying trend.
- Solar variability: Satellite measurements show a slight decline in solar irradiance since the early 2000s, providing a modest cooling offset.
Environmental and Human Impacts
Environmental Impacts
- Accelerated melting of Arctic sea ice and Greenland ice sheet, contributing to sea‑level rise of ~3.3 mm yr⁻¹ (NASA, 2023).
- Increased frequency of marine heatwaves, affecting coral bleaching and fisheries.
- Shifts in phenology, such as earlier flowering and bird migration, disrupting ecosystem synchrony.
Human Health and Social Impacts
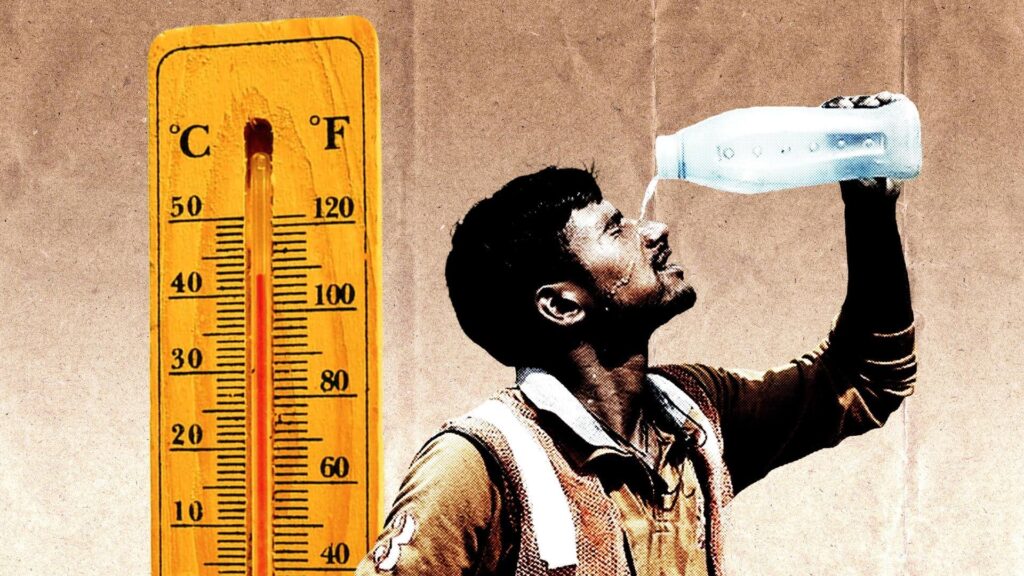
- Higher incidence of heat‑related illnesses and mortality, especially among older adults and outdoor workers.
- Exacerbation of air‑quality problems, as heat amplifies ground‑level ozone formation.
- Reduced agricultural yields in heat‑stressed regions, threatening food security for vulnerable populations.
Economic and Infrastructure Impacts
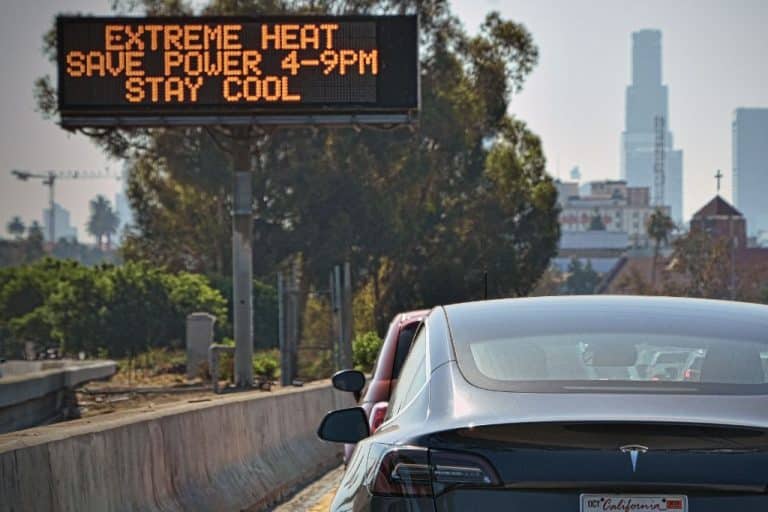
- Increased energy demand for cooling, raising electricity costs and straining grids during peak heat.
- Greater risk of infrastructure damage from thermal expansion, such as rail buckling and road deformation.
- Higher insurance losses from heat‑related wildfires and drought‑induced crop failures.
Regional Differences
While the global average rises uniformly, regional expressions differ:
- Arctic: Warming rates exceed the global mean by more than twice, a phenomenon known as Arctic amplification.
- Tropics: Heatwaves become more intense, but the absolute temperature increase is smaller than in high latitudes.
- Mid‑latitude continents: Combined heat and drought stress intensify, affecting agriculture in the U.S. Midwest, the Sahel, and parts of China.
- Coastal zones: Sea‑level rise and higher storm surge risk compound with heat stress, threatening low‑lying cities.
What Scientists Know With High Confidence
- Human activities are the dominant cause of observed global warming since the mid‑20th century.
- The planet’s energy budget is positive, meaning more energy is entering than leaving the climate system.
- Warming leads to more frequent and intense heatwaves, with clear links to mortality and agricultural loss.
- The Arctic is warming faster than the global average, driving permafrost thaw and sea‑ice decline.
What Remains Uncertain
Key uncertainties include the exact magnitude of climate feedbacks such as permafrost carbon release, the regional timing of precipitation changes, and the thresholds at which ecosystem collapse becomes irreversible. These gaps stem from limited observational coverage in remote areas, model resolution constraints, and the complex interplay of socioeconomic pathways that influence future emissions.
Common Misconceptions
Misconception: A single hot month proves climate change.
Reality: Individual months reflect natural variability; the significance lies in the persistent pattern of record‑breaking monthly averages over many years, which aligns with long‑term warming trends.
Misconception: Only the “rich” countries cause global warming.
Reality: While high‑income nations historically emitted the most CO₂, current emissions are dominated by rapidly growing economies, and per‑capita emissions still vary widely worldwide.
Misconception: Renewable energy alone will instantly stop temperature rise.
Reality: Renewables are essential for mitigation, but achieving net‑zero also requires energy efficiency, demand‑side management, and, in some scenarios, carbon‑removal technologies to address already‑emitted greenhouse gases.
Misconception: Climate models are unreliable because they predict the future.
Reality: Climate models have successfully reproduced past temperature trends and extreme‑event patterns; uncertainties grow with longer‑term projections, but they remain the best tools for scenario analysis.
Misconception: Adaptation can fully offset the harms of warming.
Reality: Adaptation reduces vulnerability but cannot eliminate exposure to higher temperatures; mitigation is required to limit the magnitude of future impacts.
Solutions and Limitations
Addressing the record‑month streak demands both mitigation—reducing greenhouse‑gas emissions—and adaptation—preparing societies for unavoidable changes.
- Mitigation: Rapid decarbonization of electricity (e.g., wind, solar, nuclear) can cut CO₂ emissions by up to 70 % by 2050 if policies align with IPCC pathways. Limitations include grid integration challenges, material supply constraints, and the need for supportive policy frameworks.
- Carbon‑removal: Afforestation, soil carbon sequestration, and direct air capture can offset a portion of emissions, but current capacities are small and costs remain high.
- Adaptation: Heat‑action plans, resilient infrastructure, and drought‑tolerant crops reduce exposure. Trade‑offs involve financial costs, potential land‑use conflicts, and varying effectiveness across regions.
- Nature‑based solutions: Restoring wetlands and mangroves provides coastal protection and carbon storage, yet they require adequate space and long‑term stewardship.
What Individuals, Communities, and Governments Can Do
What Individuals Can Do
- Reduce personal carbon footprints by using energy‑efficient appliances, choosing low‑carbon transportation, and limiting air travel.
- Support policies and companies that prioritize renewable energy and sustainable practices.
- Participate in local heat‑wave preparedness programs (e.g., checking on vulnerable neighbors).
What Communities and Organizations Can Do
- Develop and implement community‑wide climate action plans that include renewable energy targets and green infrastructure.
- Invest in early‑warning systems for heatwaves and wildfire risk reduction.
- Promote urban greening to mitigate the urban heat island effect.
What Governments Can Do
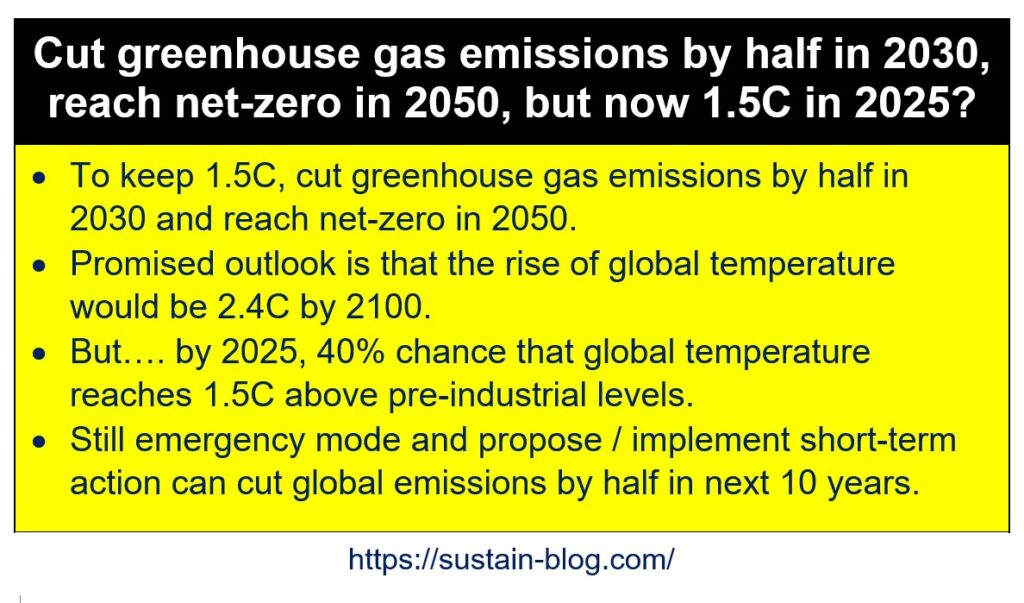
- Enact and enforce ambitious emissions‑reduction targets aligned with the Paris Agreement’s 1.5 °C goal.
- Provide financing for climate‑resilient agriculture, water management, and disaster response in vulnerable regions.
- Support research, development, and deployment of low‑carbon technologies while ensuring equitable access.
Closing Synthesis
The eleven‑month streak of record global temperatures underscores a persistent, human‑driven warming signal that is already reshaping ecosystems and societies. High‑confidence science links greenhouse‑gas emissions to this trend, while uncertainties remain about regional feedbacks and future thresholds. Mitigation, adaptation, and nature‑based strategies together offer the most viable pathway to limit further warming and protect vulnerable populations. Immediate, coordinated action across individuals, communities, and governments is essential to turn the tide before the record‑breaking months become the new norm.
Frequently Asked Questions
What does it mean that April 2024 is the 11th straight month of record global temperatures?
It means that for the eleventh month in a row, the average temperature across the entire planet for that calendar month has been higher than any previous measurement of the same month since systematic records began in 1880. The streak reflects a persistent upward trend rather than isolated weather events.
Which human activities are the main drivers of the recent record‑breaking temperatures?
The primary drivers are the burning of fossil fuels for electricity, transport, and industry, which releases large amounts of carbon dioxide; agriculture and waste management, which emit methane and nitrous oxide; and land‑use changes such as deforestation that reduce carbon uptake and release stored carbon.
How confident are scientists that greenhouse gases are responsible for the observed warming?
Scientists are highly confident—based on multiple lines of evidence from instrumental records, satellite data, and attribution studies—that the increase in greenhouse gases is the dominant cause of global warming since the mid‑20th century. This confidence is reflected in major assessments like the IPCC Sixth Assessment Report.
Which regions are experiencing the most pronounced effects of the record‑month temperature streak?
The Arctic is warming more than twice as fast as the global average, leading to rapid sea‑ice loss. Mid‑latitude continents, such as the United States, parts of China, and the Sahel, face intensified heatwaves and drought. Coastal zones also feel compounded stress from rising sea levels and higher storm surges.
What practical steps can individuals take to help reduce global warming?
Individuals can lower their carbon footprints by improving home energy efficiency, choosing low‑carbon transportation, reducing air travel, and supporting renewable energy policies. Engaging in community heat‑wave preparedness and advocating for climate‑friendly legislation also amplify personal impact.





Leave a Comment