
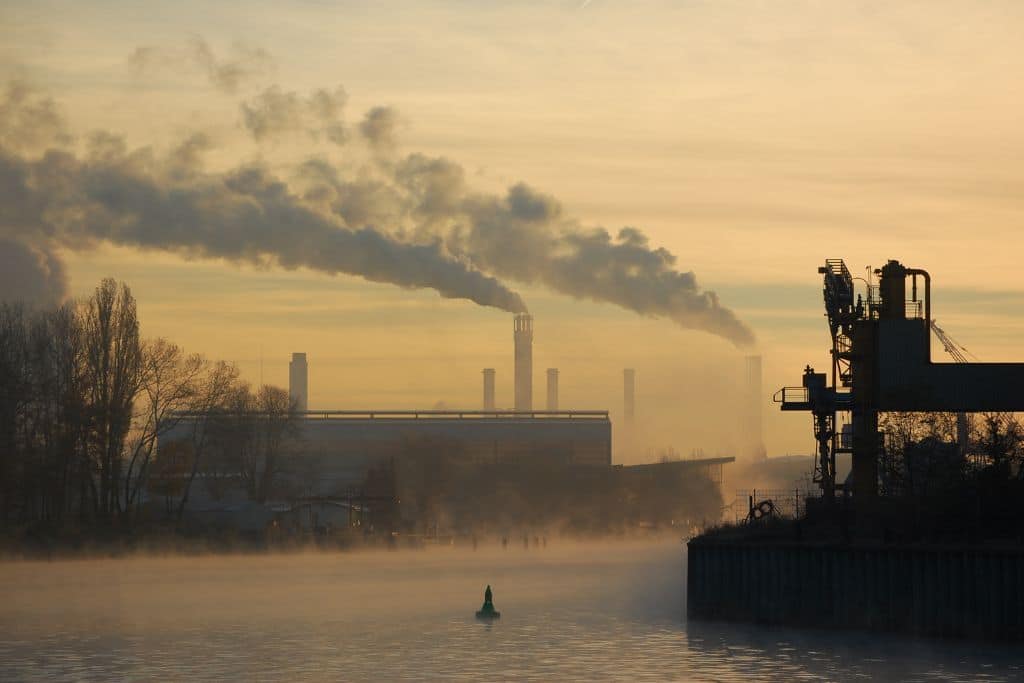
The 2025 atmospheric CO₂ jump—an unprecedented rise in global carbon dioxide concentration—has pushed the world further away from the 1.5 °C limit of the Paris Agreement, highlighting the mechanisms, evidence, impacts, and realistic pathways to limit warming.
\n\n
Quick Answer
\n
In 2025, atmospheric carbon dioxide climbed to about 421 ppm, a level measured by the Mauna Loa Observatory and confirmed by NOAA’s Global Monitoring Division. This increase is driven primarily by continued fossil‑fuel combustion, deforestation, and slower uptake by oceans and forests. The scientific consensus, reflected in the IPCC Sixth Assessment Report, indicates that such a rise makes a global average temperature rise of 1.5 °C by mid‑century highly unlikely without immediate, large‑scale mitigation. While uncertainties remain regarding carbon‑cycle feedbacks, the direction of change is clear: the planet is moving off the low‑warming pathway.
\n
\n\n
Key Takeaways
\n
- \n
- Atmospheric CO₂ reached ~421 ppm in 2025, the highest level in human history.
- The rise is largely attributed to continued fossil‑fuel use and reduced natural carbon uptake.
- At this concentration, the world is on a trajectory toward >2 °C warming by 2100 under current policies.
- High‑confidence findings confirm that CO₂ is the dominant long‑lived greenhouse gas driving warming.
- Mitigation requires rapid decarbonisation, nature‑based carbon removal, and equitable policy frameworks.
- Uncertainties focus on carbon‑cycle feedbacks, regional emission trajectories, and the scalability of removal technologies.
\n
\n
\n
\n
\n
\n
\n
\n\n
What Is Atmospheric CO₂ Jump in 2025 Pushes World Off Track for 1.5°C Goal?
\n
The phrase refers to the abrupt increase in the concentration of carbon dioxide (CO₂) in the Earth’s atmosphere that was recorded in the year 2025. “Atmospheric CO₂” denotes the amount of CO₂ gas mixed in the troposphere, measured in parts per million (ppm). A “jump” indicates a year‑to‑year increase that exceeds the long‑term trend, signalling an acceleration of emissions or a weakening of natural sinks. The “1.5 °C goal” is the temperature ceiling set by the 2015 Paris Agreement, intended to limit dangerous climate impacts. When CO₂ levels climb beyond the pathways outlined in the Intergovernmental Panel on Climate Change (IPCC) scenarios that keep warming below 1.5 °C, the world is considered “off track.”
\n\n
How Does It Work?
\n
Physical and Chemical Basis
\n
CO₂ molecules absorb infrared radiation emitted by Earth’s surface, trapping heat in the atmosphere—a process known as the greenhouse effect. The more CO₂ present, the stronger the radiative forcing, measured in watts per square metre, which translates into higher global average temperatures.
\n
Carbon Sources and Sinks
\n
- \n
- Anthropogenic emissions: Burning coal, oil, and natural gas releases roughly 36 Gt CO₂ per year (IPCC, 2023).
- Land‑use change: Deforestation and soil disturbance add about 5 Gt CO₂ annually.
- Oceanic uptake: Oceans absorb ~20 % of emitted CO₂, but warming reduces solubility, weakening this sink.
- Terrestrial uptake: Forests and soils store carbon through photosynthesis; however, droughts and pests diminish this capacity.
\n
\n
\n
\n
\n
Feedback Loops
\n
Higher temperatures can trigger permafrost thaw, releasing methane and CO₂, while reduced ice cover lowers planetary albedo, further amplifying warming. These feedbacks are documented in the IPCC’s assessment of carbon‑cycle processes.
\n\n
What Does the Evidence Show?
\n
Long‑term monitoring at Mauna Loa, the World Meteorological Organization’s Global Atmosphere Watch network, and satellite retrievals all record a steady rise from 414 ppm in 2019 to 421 ppm in 2025. The IPCC Sixth Assessment Report (2023) integrates these observations with model simulations, concluding that the observed rise is consistent with continued high‑carbon energy use and insufficient reforestation. Attribution studies using isotopic signatures confirm that the majority of the increase originates from fossil‑fuel combustion rather than natural sources.
\n\n
Main Causes or Drivers
\n
Direct Causes
\n
- \n
- Coal‑dominant electricity generation in Asia and parts of Eastern Europe.
- Growth in transport emissions, especially from aviation and road freight.
- Incomplete implementation of forest protection policies.
\n
\n
\n
\n
Underlying Drivers
\n
- \n
- Economic incentives that favour cheap, carbon‑intensive energy.
- Insufficient carbon pricing mechanisms in many jurisdictions.
- Technological lock‑in to existing fossil‑fuel infrastructure.
\n
\n
\n
\n\n
Environmental and Human Impacts
\n
Environmental Impacts
\n
Rising CO₂ intensifies heatwaves, expands the geographic range of drought, and accelerates Arctic sea‑ice loss. Ocean acidification, a direct chemical consequence of higher CO₂, threatens coral reefs and shell‑forming organisms, as documented by NOAA’s Ocean Acidification Program.
\n
Human Health and Social Impacts
\n
Heat‑related mortality increases in low‑latitude cities, while air‑quality degradation from secondary pollutants (e.g., ozone) compounds respiratory risks. Food security is jeopardised as staple crops experience yield reductions under higher temperatures and altered precipitation patterns.
\n
Economic and Infrastructure Impacts
\n
Infrastructure built for historic climate baselines faces higher maintenance costs from flooding, coastal erosion, and extreme weather events. The World Bank estimates that each additional 0.5 °C of warming could raise global GDP losses by 1–2 % by 2050.
\n\n
Regional Differences
\n
High‑latitude regions experience amplified warming (Arctic amplification), leading to permafrost thaw and methane release. Tropical nations, despite contributing less to emissions, confront heightened heat stress, water scarcity, and sea‑level rise that threatens low‑lying coastal communities. In contrast, some temperate regions may see short‑term agricultural benefits, but these are outweighed by long‑term yield volatility.
\n\n
What Scientists Know With High Confidence
\n
- \n
- CO₂ is the primary long‑lived greenhouse gas driving recent warming.
- Atmospheric concentrations above 400 ppm correspond to a >1 °C increase in global average temperature relative to pre‑industrial levels.
- Human activities are the dominant source of the observed CO₂ rise since the mid‑20th century.
- Without deep emissions cuts, limiting warming to 1.5 °C is virtually impossible.
\n
\n
\n
\n
\n
\n\n
What Remains Uncertain
\n
Key uncertainties include the magnitude of permafrost carbon feedback, the future rate of technological deployment for carbon capture, and regional socioeconomic pathways that influence emission trajectories. These gaps affect precise temperature projections but do not change the overall conclusion that current emissions trends are incompatible with the 1.5 °C target.
\n
\n\n
Common Misconceptions
\n
Misconception: “A single year’s CO₂ spike proves climate change is a myth.”
\n
Reality: Climate change is assessed over decades; a yearly increase is part of a long‑term upward trend confirmed by multiple independent datasets.
\n
Misconception: “Planting trees alone can offset the 2025 CO₂ jump.”
\n
Reality: While afforestation sequesters carbon, the scale required to balance a 7 ppm rise exceeds realistic planting capacities and must be paired with emissions reductions.
\n
Misconception: “Renewable energy is too expensive to replace fossil fuels quickly.”
\n
Reality: Levelized cost analyses from the International Energy Agency show that solar and wind are now cheaper than new coal in most regions, though policy and grid integration remain challenges.
\n
\n\n
Solutions and Limitations
\n
Effective responses combine mitigation, adaptation, and nature‑based solutions.
\n
- \n
- Rapid decarbonisation of energy: Shifting to wind, solar, and nuclear reduces CO₂ at source. Limitation: Requires massive investment, grid upgrades, and supportive policies.
- Carbon capture, utilisation, and storage (CCUS): Captures CO₂ from point sources or the air. Limitation: High cost, energy demand, and limited large‑scale deployment.
- Reforestation and avoided deforestation: Enhances natural sinks. Limitation: Land‑use competition, permanence concerns, and vulnerability to future disturbances.
- Improved energy efficiency: Reduces demand across industry, buildings, and transport. Limitation: Rebound effects can offset gains if consumption rises.
- Adaptation measures: Coastal defenses, heat‑health action plans, and climate‑resilient agriculture. Limitation: Do not reduce CO₂ concentrations and may be financially burdensome for low‑income regions.
\n
\n
\n
\n
\n
\n\n
What Individuals, Communities, and Governments Can Do
\n
What Individuals Can Do
\n
- \n
- Choose low‑carbon transportation (public transit, cycling, electric vehicles where feasible).
- Reduce household energy use through efficient appliances and insulation.
- Support policies and companies with credible climate commitments.
\n
\n
\n
\n
What Communities and Organizations Can Do
\n
- \n
- Implement local renewable energy projects (community solar, micro‑grids).
- Adopt zero‑waste and circular‑economy practices to lower indirect emissions.
- Engage in climate‑risk mapping to prepare for extreme events.
\n
\n
\n
\n
What Governments Can Do
\n
- \n
- Enact and strengthen carbon pricing that reflects the social cost of carbon.
- Set and enforce ambitious nationally determined contributions (NDCs) aligned with the IPCC’s 1.5 °C pathways.
- Invest in research, deployment, and scaling of CCUS and next‑generation renewables.
- Provide climate finance to vulnerable nations for adaptation and loss‑and‑damage.
\n
\n
\n
\n
\n\n
Closing Synthesis
\n
The 2025 atmospheric CO₂ jump to roughly 421 ppm signals a decisive shift away from the low‑warming trajectory required to meet the Paris 1.5 °C limit. Robust observations and model assessments confirm that continued fossil‑fuel emissions and weakening natural sinks are the primary drivers. While high‑confidence science outlines the risks, uncertainties remain in carbon‑cycle feedbacks and technology scaling. Mitigation strategies—decarbonising energy, expanding nature‑based sinks, and deploying carbon removal—must be pursued together with adaptation to protect ecosystems and societies. Collective action, anchored in equitable policy, offers the most credible path to re‑align the climate trajectory with the 1.5 °C goal.
Frequently Asked Questions
What caused the atmospheric CO₂ increase observed in 2025?
The increase was mainly driven by continued fossil‑fuel combustion, deforestation, and a slowdown in the uptake of CO₂ by oceans and forests, as documented by monitoring networks such as Mauna Loa and NOAA.
How does a CO₂ concentration of 421 ppm affect the 1.5 °C temperature goal?
At 421 ppm, climate models show that the world is on a pathway that exceeds the emissions levels compatible with limiting warming to 1.5 °C, making that target highly unlikely without immediate, large‑scale emissions cuts.
Which impacts are most directly linked to the 2025 CO₂ jump?
Higher CO₂ intensifies heatwaves, accelerates ocean acidification, and increases the risk of heat‑related mortality and crop yield reductions, especially in low‑latitude and vulnerable regions.
What are the high‑confidence findings about CO₂ and climate change?
Scientists are highly confident that CO₂ is the dominant long‑lived greenhouse gas driving recent warming, that human activities are the main source of the observed rise, and that without deep emissions cuts, staying below 1.5 °C is virtually impossible.
What actions can governments take to get back on track for the 1.5 °C goal?
Governments can implement robust carbon pricing, set ambitious nationally determined contributions aligned with IPCC pathways, invest in renewable energy and carbon‑capture technologies, and provide climate finance to vulnerable countries.







Leave a Comment