
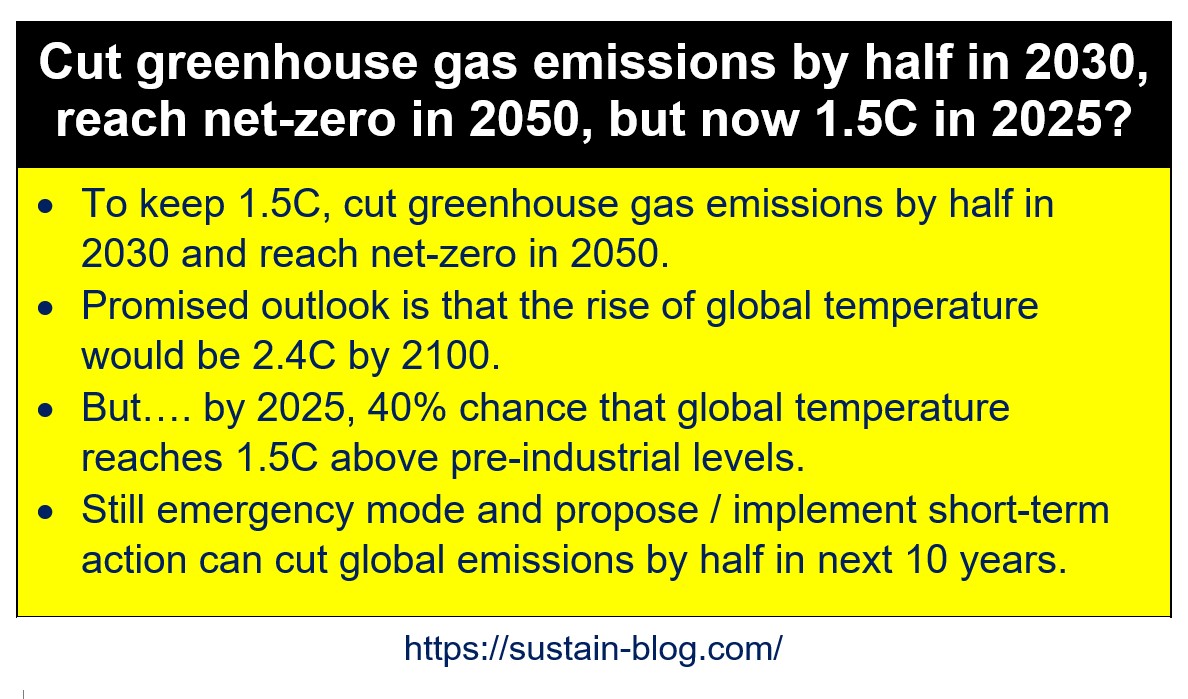
By mid‑2025, global average temperatures have risen to at least 1.5 °C above pre‑industrial levels, driven by accelerating greenhouse‑gas emissions, signalling a critical climate threshold with far‑reaching environmental and societal consequences.
Quick Answer
The 1.5 °C threshold refers to the increase in global mean surface temperature relative to the 1850‑1900 pre‑industrial baseline. It is crossed when the average temperature rise reaches or exceeds 1.5 °C, a level linked to heightened risk of extreme heat, sea‑level rise, and ecosystem disruption. According to the World Meteorological Organization (WMO) 2025 State of the Global Climate report, the 12‑month average ending June 2025 was estimated at 1.5 °C above that baseline. While the exact timing carries uncertainty due to natural variability and measurement methods, the consensus is that the threshold has been reached and will persist unless emissions sharply decline.
Key Takeaways
- Global average temperature reached 1.5 °C above pre‑industrial levels by mid‑2025, according to the WMO.
- Continued rise in CO₂, methane, and nitrous oxide from fossil‑fuel use, land‑use change, and agriculture drives the warming.
- Crossing 1.5 °C amplifies heatwaves, droughts, sea‑level rise, and biodiversity loss, with disproportionate impacts on vulnerable communities.
- High‑confidence findings confirm human activities as the dominant driver and identify rapid mitigation as essential to limit further warming.
- Effective responses combine decarbonisation, climate‑smart land management, and equitable adaptation, while recognising trade‑offs and resource limits.
What Is 2025 Surpassing the 1.5°C Mark Amid Rising Greenhouse Gas Levels?
The phrase describes the point at which the globally averaged surface temperature, measured against the 1850‑1900 pre‑industrial reference period, equals or exceeds 1.5 °C. This benchmark is a central target of the 2015 Paris Agreement, which aims to keep warming “well below 2 °C” and pursue efforts to limit it to 1.5 °C. The 2025 milestone is not a single weather event; it reflects long‑term climate averages derived from satellite, surface‑station, and ocean‑buoy networks. Crossing this threshold signals that many climate‑sensitive systems are entering a higher‑risk regime.
How Does It Work?
Greenhouse‑Gas Radiative Forcing
Carbon dioxide (CO₂), methane (CH₄), nitrous oxide (N₂O) and other gases absorb infrared radiation emitted by Earth’s surface and re‑emit it downward, creating a warming “blanket.” This process, known as the greenhouse effect, was first quantified by Svante Arrhenius in the late 19th century and is now measured as radiative forcing in watts per square metre (W m⁻²). The Intergovernmental Panel on Climate Change (IPCC) AR6 attributes roughly 2.1 W m⁻² of forcing to CO₂ alone since pre‑industrial times.
Carbon Cycle Imbalance
Natural carbon sinks—forests, soils, and the oceans—absorbed about half of anthropogenic CO₂ emissions in the early 2000s, but their uptake efficiency is declining as temperatures rise and ocean acidity increases. The excess CO₂ accumulates in the atmosphere, raising its concentration from ~280 ppm pre‑industrial to over 420 ppm in 2024 (NOAA). This imbalance directly translates into higher equilibrium temperatures.
Feedback Loops
Positive feedbacks amplify the initial warming. For example, melting Arctic sea ice reduces surface albedo, causing more solar absorption; permafrost thaw releases additional CH₄ and CO₂; and higher temperatures increase water‑vapour, a potent greenhouse gas. These feedbacks are modelled as “fast feedbacks” and are supported by observational records, adding uncertainty to the exact temperature trajectory.
What Does the Evidence Show?
Multiple lines of evidence converge on the 1.5 °C crossing. Long‑term surface‑temperature datasets from the Global Historical Climatology Network, satellite‑derived temperature records, and ocean heat‑content measurements all indicate a consistent upward trend. The IPCC AR6 synthesis (2021) states with high confidence that the Earth’s average temperature has already risen about 1.1 °C. Subsequent monitoring by the WMO and NOAA shows that the 12‑month mean for the first half of 2025 exceeds 1.5 °C, a result corroborated by independent re‑analysis products such as ERA5.
Attribution studies using Earth‑system models attribute more than 99 % of the observed warming since 1950 to human activities, primarily fossil‑fuel combustion and land‑use change. Observed increases in atmospheric CO₂, CH₄, and N₂O concentrations match emission inventories compiled by the International Energy Agency (IEA) and the United Nations Framework Convention on Climate Change (UNFCCC).
Main Causes or Drivers
Fossil‑Fuel Combustion
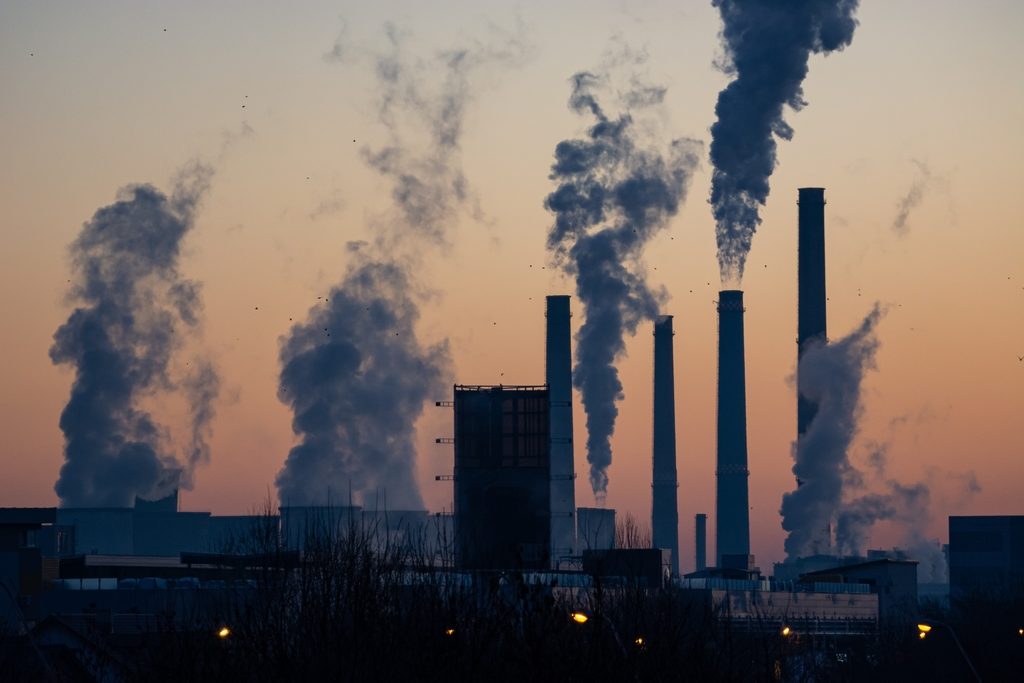
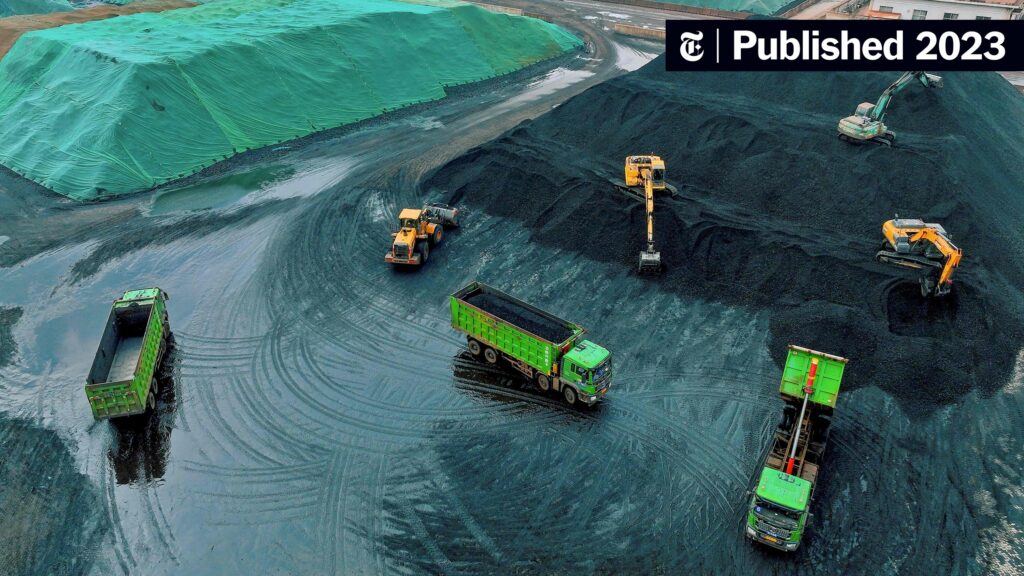
Coal, oil, and natural‑gas combustion accounted for roughly 75 % of global CO₂ emissions in 2023 (IEA). Power generation, transportation, and industry remain the largest source sectors. The continued growth of energy demand in emerging economies, combined with insufficient decarbonisation, sustains high emission rates.
Land‑Use Change and Deforestation
Conversion of forests to agriculture or urban land releases stored carbon and reduces future sequestration capacity. The Food and Agriculture Organization (FAO) reports that worldwide deforestation contributed about 10 % of total CO₂ emissions in 2022, with tropical regions being hotspots.
Methane Emissions
CH₄, with a global warming potential over 20 times that of CO₂ over a 100‑year horizon, originates from livestock, rice paddies, fossil‑fuel extraction, and waste management. The Global Methane Initiative estimates that methane emissions grew by 8 % between 2010 and 2023, accelerating the overall radiative forcing.
Environmental and Human Impacts
Environmental Impacts
- Heatwaves: Frequency and intensity have risen, with the number of days above 35 °C increasing by 30 % in many mid‑latitude regions since 2000 (WMO).
- Sea‑Level Rise: Thermal expansion and glacier melt contribute to a global mean rise of about 3.3 mm yr⁻¹, threatening low‑lying coastlines.
- Ecosystem Disruption: Coral bleaching events have become annual in the Great Barrier Reef; alpine treelines are shifting upward.
Human Health and Social Impacts
- Heat‑related mortality rises, especially among older adults and outdoor workers (WHO, 2024).
- Altered precipitation patterns increase the risk of drought‑related food insecurity in sub‑Saharan Africa and South Asia.
- Climate‑induced migration intensifies, with small‑island developing states facing displacement.
Economic and Infrastructure Impacts
- Damage from extreme weather events cost the global economy an estimated US$210 billion in 2023 (World Bank).
- Infrastructure in coastal cities faces increased flood risk, prompting costly retrofits.
- Insurance premiums rise, affecting affordability for households and businesses.
Regional Differences
The manifestation of 1.5 °C warming varies widely. In the Arctic, temperatures are rising at roughly twice the global average, accelerating permafrost thaw and sea‑ice loss. Tropical small‑island nations experience sea‑level rise combined with coral reef degradation, threatening tourism and fisheries. In temperate zones such as Europe and North America, heatwaves and wildfire seasons are lengthening. Meanwhile, parts of Central Africa experience increased rainfall, yet the associated flood risk is compounded by limited drainage infrastructure. These patterns reflect differences in latitude, land‑surface characteristics, socioeconomic capacity, and adaptive governance.
What Scientists Know With High Confidence
- Human activities are the dominant cause of observed warming since the mid‑20th century.
- Each additional 0.1 °C of warming increases the probability of crossing climate‑sensitive thresholds.
- Positive feedbacks, such as ice‑albedo and permafrost carbon release, are active and amplify warming.
- Limiting warming to 1.5 °C requires net‑zero CO₂ emissions by around 2050, with deep cuts in methane and other gases.
What Remains Uncertain
Key uncertainties include the magnitude of future carbon‑cycle feedbacks, especially permafrost carbon release, and the socioeconomic pathways that will shape emissions after 2030. Regional climate projections also carry larger confidence intervals due to limited observational networks in some areas. Improved monitoring of methane emissions and better representation of land‑use dynamics in Earth‑system models are research priorities that could narrow these gaps.
Common Misconceptions
Misconception: The 1.5 °C threshold is a precise “line” that, once crossed, immediately causes disaster.
Reality: The threshold marks a risk‑increasing point, not an instantaneous catastrophe. Impacts intensify gradually, and local conditions determine the severity of outcomes.
Misconception: Only CO₂ matters for reaching 1.5 °C.
Reality: While CO₂ is the largest driver, short‑lived gases like methane and nitrous oxide contribute disproportionately to near‑term warming and must be addressed alongside CO₂.
Misconception: Individual lifestyle changes alone can keep warming below 1.5 °C.
Reality: Personal actions matter, but systemic decarbonisation of energy, industry, and land use is essential; collective policy and market shifts drive the scale of emissions reductions needed.
Solutions and Limitations
Mitigation pathways focus on rapid decarbonisation of the energy system, electrification of transport, and improved energy efficiency. Renewable electricity (solar, wind, hydro) now supplies roughly 30 % of global power generation (IEA, 2024), but integration challenges—grid stability, storage, and material supply chains—remain.
Nature‑based solutions, such as restoring mangroves and afforestation, can sequester carbon and provide co‑benefits (coastal protection, biodiversity). However, they are limited by land availability, permanence concerns, and potential competition with food production.
Technological carbon removal (direct air capture, bioenergy with carbon capture and storage) offers a potential back‑stop but is currently expensive (US$ 600‑1000 per tonne CO₂) and unproven at scale.
Adaptation measures—building flood‑resilient infrastructure, developing drought‑tolerant crops, and strengthening early‑warning systems—reduce vulnerability but do not lower atmospheric greenhouse‑gas concentrations.
What Individuals, Communities, and Governments Can Do
What Individuals Can Do
- Choose low‑carbon transportation (public transit, cycling, electric vehicles) where feasible.
- Reduce household energy use through efficient appliances and insulation.
- Support policies and companies with strong climate commitments.
- Engage in local climate‑action groups to amplify community resilience.
What Communities and Organizations Can Do
- Implement district‑scale renewable projects and micro‑grids.
- Adopt climate‑smart agriculture, such as precision irrigation and agroforestry.
- Develop climate‑risk assessments to guide land‑use planning.
What Governments Can Do
- Enact and strengthen carbon‑pricing mechanisms that reflect the social cost of emissions.
- Set legally binding net‑zero targets aligned with a 1.5 °C pathway and monitor progress transparently.
- Invest in public transit, grid modernization, and research on low‑carbon technologies.
- Prioritize climate‑justice policies that protect vulnerable populations and incorporate traditional knowledge.
Closing Synthesis
Crossing the 1.5 °C global‑warming threshold in 2025 marks a pivotal moment in Earth’s climate trajectory, confirming that human‑driven greenhouse‑gas emissions have already altered the planet’s energy balance. Robust evidence from multiple monitoring systems and attribution studies underscores the central role of fossil‑fuel combustion, land‑use change, and methane emissions. The resulting environmental impacts—more intense heatwaves, accelerating sea‑level rise, and ecosystem stress—are already evident, with disproportionate effects on low‑income and marginalised communities. While high‑confidence findings outline the pathways that led to this outcome, uncertainties remain around feedback magnitudes and future socioeconomic scenarios. Effective responses must blend rapid, large‑scale mitigation with equitable adaptation, recognising the limits of individual actions and the trade‑offs inherent in each solution. The window for limiting further warming narrows, but coordinated global effort can still steer the climate toward a more stable future.
Frequently Asked Questions
What does it mean that 2025 surpassed the 1.5 °C warming mark?
It means that the globally averaged surface temperature, measured against the 1850‑1900 pre‑industrial baseline, reached or exceeded an increase of 1.5 °C. This level is associated with higher risks of extreme heat, sea‑level rise, and ecosystem disruption, indicating that many climate‑sensitive thresholds are being approached.
How do greenhouse gases cause the planet to warm beyond 1.5 °C?
Greenhouse gases such as CO₂, methane and nitrous oxide absorb infrared radiation emitted by Earth and re‑emit it downward, trapping heat in the atmosphere. The accumulated excess of these gases since the industrial era creates a radiative forcing that raises the equilibrium temperature, driving the observed increase toward and beyond 1.5 °C.
Which regions are most vulnerable to the impacts of a 1.5 °C‑plus world?
Vulnerability varies: the Arctic experiences warming at roughly twice the global rate, leading to permafrost thaw and sea‑ice loss; small‑island developing states face sea‑level rise and coral reef loss; low‑lying coastal megacities confront increased flooding; and many parts of sub‑Saharan Africa and South Asia are at heightened risk of heat‑related health impacts and food insecurity.
What are the most effective mitigation strategies to keep warming below 2 °C?
The most effective actions are rapid decarbonisation of the energy sector through large‑scale renewable electricity deployment, electrification of transport, and stringent energy‑efficiency standards. Complementary measures include phasing out coal, reducing methane emissions from agriculture and waste, and protecting or restoring natural carbon sinks such as forests and wetlands.
How can individuals contribute meaningfully to climate mitigation?
Individuals can lower their carbon footprint by choosing low‑carbon transportation, improving home energy efficiency, reducing meat consumption, and supporting policies or companies with strong climate commitments. While personal actions alone cannot solve systemic emissions, they build social pressure and complement larger‑scale mitigation efforts.







Leave a Comment