
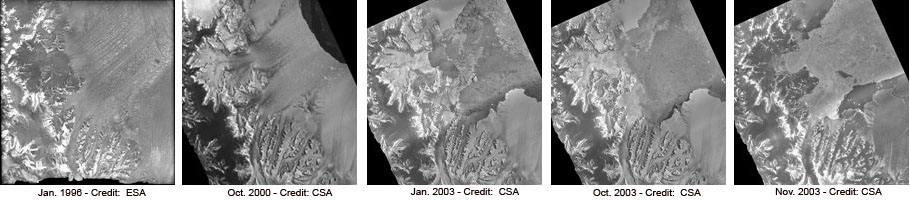
GLIMS (Global Land Ice Measurements from Space) combines satellite remote‑sensing data with automated processing to monitor glacier extent, thickness, flow and mass balance, providing an essential, global view of cryospheric change.
Quick Answer
GLIMS is an international database that ingests imagery from radar, optical and laser‑altimetry satellites, extracts glacier outlines and surface elevation changes with standardized algorithms, and makes the results publicly available. By mapping glacier termini, surface velocity and volume loss, GLIMS reveals the accelerating response of ice to warming temperatures, informing sea‑level rise projections and water‑resource planning. Uncertainty remains in regions with persistent cloud cover or limited ground validation, but the overall trend of global glacier retreat is robust.
Key Takeaways
- GLIMS curates a global, multi‑satellite record of glacier geometry and dynamics dating back to the early 1990s.
- Synthetic aperture radar (SAR) from Sentinel‑1, optical data from Landsat, and laser altimetry from ICESat‑2 are the primary sensors.
- Automated change‑detection algorithms quantify terminus retreat, surface velocity and ice‑volume loss with meter‑scale precision.
- Evidence from GLIMS confirms that glaciers worldwide have lost an estimated 267 ± 30 gigatonnes of ice per year between 2000 and 2020.
- Data support sea‑level rise estimates, water‑security assessments and climate‑model validation, while gaps remain in high‑latitude and cloudy regions.
What Is How GLIMS Uses Satellites to Track Glaciers From Space?
GLIMS (Global Land Ice Measurements from Space) is a collaborative initiative led by the National Snow and Ice Data Center (NSIDC) that aggregates satellite observations to produce a consistent, open‑access inventory of glacier outlines and change metrics. The system covers all glaciers larger than 0.01 km², spanning polar, temperate and tropical mountain ranges. Unlike regional field surveys, GLIMS provides a synoptic, repeatable view of the cryosphere, enabling scientists to compare glacier behavior across continents and time periods.
How Does It Work?
Data Acquisition
Multiple satellite platforms supply the raw imagery:
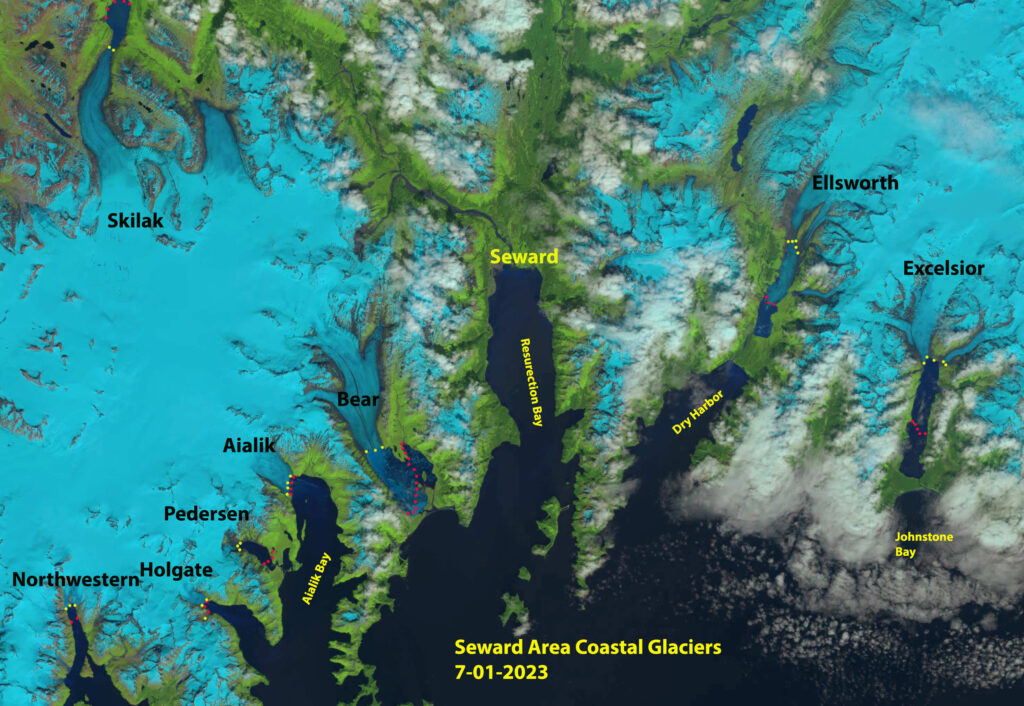
- Sentinel‑1 (European Space Agency) delivers C‑band synthetic aperture radar, penetrating cloud and darkness, ideal for mapping surface velocity and detecting crevasse patterns.
- Landsat 8/9 (USGS/NASA) provides multispectral optical imagery at 30 m resolution, useful for delineating glacier margins during snow‑free periods.
- ICESat‑2 (NASA) carries a photon‑counting laser altimeter that measures surface elevation changes with centimeter‑scale accuracy.
- Additional sensors such as Sentinel‑2, TerraSAR‑X and WorldView supplement coverage in specific regions.
Automated Processing
GLIMS employs a standardized workflow:
- Pre‑processing removes atmospheric effects, georeferences images and harmonizes spatial resolution.
- Machine‑learning classifiers (e.g., random forests) separate ice from rock, vegetation and snow based on spectral and backscatter signatures.
- Edge‑detection algorithms generate glacier outlines, which are then compared across successive dates to identify terminus advance or retreat.
- Interferometric SAR (InSAR) and feature‑tracking techniques compute surface velocity vectors, while altimetry data quantify thickness change.
- All derived products are stored in a relational database and made available via web services, APIs and downloadable shapefiles.
Quality Assurance
Every glacier product undergoes validation against in‑situ GPS surveys, aerial photogrammetry and independent satellite studies. Uncertainty estimates are attached to each metric; for example, terminus position error is typically ±15 m for clear‑sky optical scenes and ±30 m for SAR‑derived outlines.
What Does the Evidence Show?
Long‑term GLIMS records, combined with peer‑reviewed assessments such as the Intergovernmental Panel on Climate Change (IPCC) Sixth Assessment Report (2021), demonstrate a consistent pattern of glacier mass loss. Global glacier area has shrunk by roughly 9 % since 1990, and mass balance measurements indicate an average net loss of 0.4 m w.e. (water equivalent) per year. Regional syntheses confirm rapid retreat in the Himalayas, Andes, Alps and Alaska, while some maritime glaciers in New Zealand exhibit temporary advances linked to increased precipitation.
Main Causes or Drivers
Climate‑Driven Temperature Rise
Surface melt is directly proportional to rising air temperatures. The World Meteorological Organization reports a global mean temperature increase of 1.1 °C since pre‑industrial times, intensifying melt seasons and extending the duration of ablation.
Precipitation Changes
Shifts in snowfall patterns affect accumulation zones. In many mid‑latitude mountain ranges, reduced winter snowfall diminishes the glacier’s mass‑balance buffer, accelerating net loss.
Oceanic Forcing
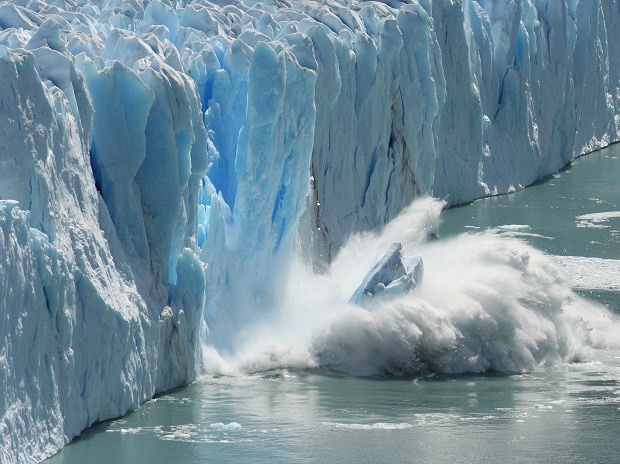
For tide‑water glaciers, warmer ocean waters erode glacier fronts, promoting calving and rapid retreat, as observed in Greenland’s Jakobshavn Isbræ.
Internal Ice Dynamics
Ice flow acceleration can be triggered by basal lubrication from meltwater, a feedback that GLIMS captures through velocity increases measured by InSAR.
Environmental and Human Impacts
Environmental Impacts
Glacier melt contributes to sea‑level rise; the IPCC attributes about 0.7 mm yr⁻¹ of the 2020–2100 projected rise to glacier loss. Downstream ecosystems lose cold water inputs, affecting salmon habitats in the Pacific Northwest and alpine wetlands in the Andes.
Human Health and Social Impacts
Communities that depend on glacier meltwater for irrigation, drinking water and hydropower face seasonal water scarcity as glacier volume declines. In the Himalaya, reduced melt threatens the water security of over 200 million people.
Economic and Infrastructure Impacts
Glacier‑related tourism (e.g., trekking routes on the Khumbu Glacier) suffers when ice retreats, exposing unstable moraine fields. Infrastructure built on permafrost or glacier forefields becomes vulnerable to landslides and rockfalls.
Regional Differences
Glacier response varies with climate regime:
- High‑latitude Arctic: Many Arctic glaciers experience modest retreat due to increased precipitation offsetting melt.
- Tropical Andes: Rapid retreat driven by strong warming and limited snowfall.
- Alpine Europe: Mixed behavior; some glaciers retreat while a few high‑altitude ice caps show temporary stability.
- Antarctic Peninsula: Pronounced thinning linked to oceanic warming, captured by ICESat‑2 altimetry.
What Scientists Know With High Confidence
What Scientists Know With High Confidence
- Global glacier area and volume have been decreasing since the early 1990s.
- Temperature rise is the primary driver of accelerated glacier melt worldwide.
- Satellite‑based measurements from GLIMS correlate strongly with independent in‑situ mass‑balance observations.
- Glacier loss contributes measurably to global sea‑level rise.
What Remains Uncertain
What Remains Uncertain
Key uncertainties include the precise mass‑balance contribution of small, debris‑covered glaciers, the long‑term response of glacier dynamics to extreme precipitation events, and the degree to which sub‑glacial hydrology modulates ice flow. Improved ground‑based validation in remote regions and higher‑resolution radar missions are needed to reduce these gaps.
Common Misconceptions
Common Misconceptions
Misconception: Glaciers only melt during summer.
Reality: Glaciers lose mass year‑round through surface melt, sublimation, basal sliding and iceberg calving; winter accumulation often does not fully offset summer loss.
Misconception: Satellite images are too coarse to see glacier change.
Reality: Modern SAR and optical satellites provide resolutions of 10–30 m, enabling detection of meter‑scale terminus shifts and centimeter‑scale elevation changes when combined with repeat observations.
Misconception: All glaciers are retreating at the same rate.
Reality: Retreat rates differ widely; maritime glaciers may be stable or advancing, while inland, high‑altitude glaciers often retreat faster due to limited snowfall.
Misconception: GLIMS data are only for scientists.
Reality: GLIMS products are openly downloadable and visualized through web portals, allowing educators, policymakers and citizens to explore glacier change.
Misconception: Glacier loss is reversible if temperatures stop rising.
Reality: Even if warming halts, many glaciers have crossed thresholds that prevent rapid regrowth; recovery would require decades to centuries of sustained cooling.
Solutions and Limitations
Addressing glacier loss involves both mitigation of climate drivers and adaptation to inevitable changes:
- Mitigation: Reducing greenhouse‑gas emissions limits future temperature rise, which directly slows glacier melt. However, mitigation alone cannot reverse loss already incurred.
- Adaptation: Water‑resource planning that incorporates glacier‑melt forecasts helps communities adjust to reduced runoff. Adaptation measures require accurate GLIMS data but may be constrained by economic resources.
- Conservation: Protecting high‑altitude catchments preserves snow accumulation zones, yet climate forcing often outweighs local protection.
- Monitoring Expansion: Launching additional radar satellites (e.g., NISAR) will fill data gaps in cloudy regions, though mission costs and data processing demands are significant.
What Individuals, Communities, and Governments Can Do
What Individuals Can Do
Support policies that accelerate decarbonization, reduce personal carbon footprints, and use reputable sources (including GLIMS visualizations) to raise awareness about glacier change.
What Communities and Organizations Can Do
Integrate GLIMS melt projections into local water‑management plans, develop early‑warning systems for glacial lake outburst floods, and partner with universities for citizen‑science glacier monitoring.
What Governments Can Do
Invest in high‑latitude and mountainous monitoring networks, fund research on glacier dynamics, and incorporate GLIMS data into national climate‑adaptation strategies and international reporting under the UNFCCC.
Synthesis of Key Insights
GLIMS transforms satellite observations into a global, continuously updated picture of glacier health, revealing a clear, high‑confidence trend of worldwide retreat driven chiefly by rising temperatures. While uncertainties remain for small, debris‑covered glaciers and complex sub‑glacial processes, the available evidence robustly links glacier loss to sea‑level rise and water‑security challenges. Ongoing satellite missions, expanded ground validation, and coordinated policy action together offer the best path to mitigate impacts and adapt to the changing cryosphere.
Frequently Asked Questions
What is GLIMS and how does it monitor glaciers?
GLIMS (Global Land Ice Measurements from Space) is an open‑access database that ingests satellite imagery—such as Sentinel‑1 radar, Landsat optical data and ICESat‑2 laser altimetry—to automatically map glacier outlines, surface velocity and elevation change. The processed products are stored in a global catalog that researchers and the public can download.
Which satellites provide data for GLIMS?
GLIMS primarily uses ESA’s Sentinel‑1 synthetic aperture radar for year‑round mapping, NASA’s Landsat series for optical imagery, and NASA’s ICESat‑2 for laser altimetry. Additional sensors like Sentinel‑2, TerraSAR‑X and commercial high‑resolution satellites supplement coverage in specific regions.
How accurate are satellite measurements of glacier change?
Terminus positions derived from clear‑sky optical scenes are accurate to about ±15 m, while radar‑based outlines have an uncertainty of roughly ±30 m. Elevation change from ICESat‑2 reaches centimeter‑scale precision, and surface velocity from InSAR is reliable within a few centimeters per day after validation against GPS surveys.
Why is tracking glacier melt important for coastal communities?
Glacier melt contributes about 0.7 mm per year to global sea‑level rise, adding to the risk of coastal flooding, erosion and salt‑water intrusion. Accurate GLIMS data improve sea‑level projections, helping planners design resilient infrastructure and adaptation measures for vulnerable shoreline populations.
How can the public access GLIMS glacier data?
GLIMS data are freely available through the NSIDC website, where users can download glacier shapefiles, view interactive maps, or query the database via an API. The portal also offers tutorials and visualizations that make the information accessible to educators, policymakers and citizen scientists.





Leave a Comment