

NASA’s satellite observations and research reveal seven fundamental insights about Earth’s warming, from rising temperatures to solutions, shaping our understanding of climate change.
Quick Answer
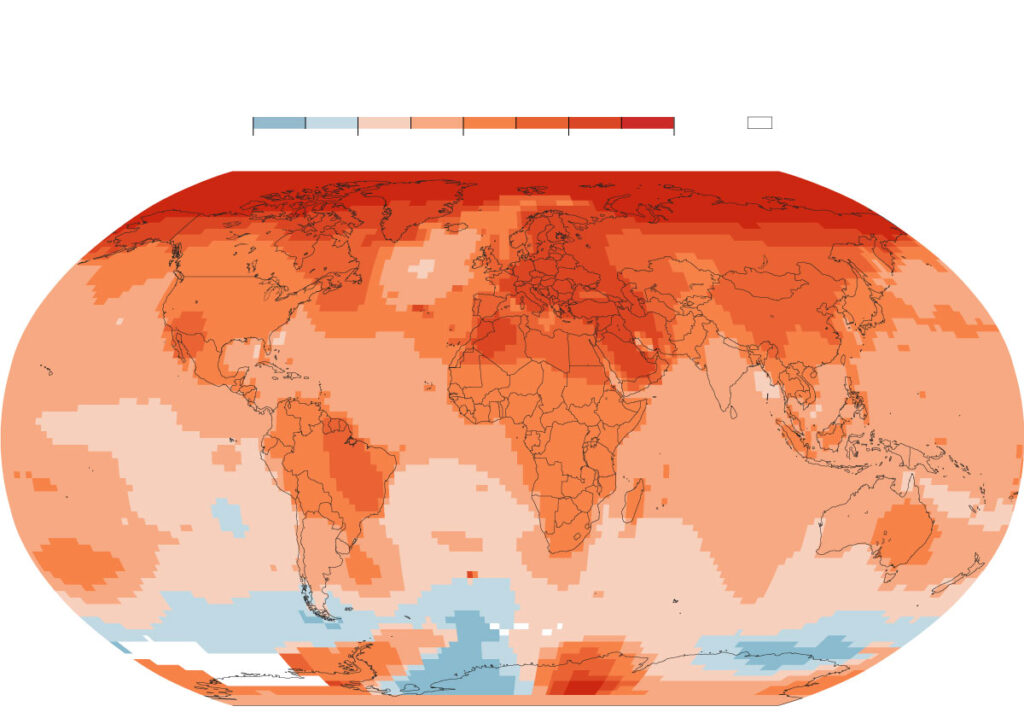
NASA, through decades of satellite monitoring and climate modeling, has documented a clear warming trend, accelerating ice loss, ocean changes, and increased extreme events. The agency’s data show that global average surface temperature has risen about 1.2 °C since the late 19th century, driven primarily by human‑generated greenhouse gases. This warming underlies sea‑level rise, intensified storms, and ecosystem stress, while also highlighting pathways for mitigation and adaptation. Uncertainty remains in regional climate feedbacks and the exact timing of tipping points, but the overall trajectory is well established.
Key Takeaways
- Global surface temperatures have risen ~1.2 °C since the late 1800s, a change linked to anthropogenic greenhouse‑gas emissions.
- Satellite records confirm rapid retreat of Greenland and Antarctic ice sheets, contributing to sea‑level rise.
- Oceans are warming, absorbing excess CO₂, and becoming more acidic, threatening marine ecosystems.
- Deforestation and land‑use change amplify atmospheric CO₂, while climate change fuels more frequent extreme weather.
- NASA’s research informs both mitigation technologies and adaptation strategies, highlighting where action can be most effective.
What Is Seven Key Things NASA Has Taught Us About Climate Change?
The phrase refers to seven major, evidence‑based insights that emerge from NASA’s Earth‑observing missions, climate models, and interdisciplinary studies. These insights span temperature trends, cryosphere dynamics, ocean chemistry, land‑surface changes, extreme weather attribution, biodiversity risk, and viable solutions. They differ from generic climate summaries because they are grounded in space‑based measurements and NASA‑led analyses that provide a global, consistent view of the planet’s climate system.
How Does It Work?
1. Satellite Observation of Temperature
Instruments such as the Atmospheric Infrared Sounder (AIRS) and MODIS measure infrared radiation emitted by Earth’s surface and atmosphere. By converting radiance to temperature, scientists generate global temperature grids that are averaged over months and years to reveal trends.
2. Monitoring Ice Mass Balance
Laser altimeters (ICESat‑2) and gravimetric missions (GRACE‑FO) detect changes in ice sheet elevation and mass. Repeated passes allow calculation of ice loss rates, which are summed to estimate contributions to sea‑level rise.
3. Ocean Heat and Chemistry
Argo floats, satellite altimetry, and spectrometers track sea‑surface temperature, salinity, and pH. The ocean’s heat uptake is quantified by integrating temperature anomalies over depth, while pH sensors reveal acidification trends.
4. Land‑Surface Change Detection
Multispectral imaging identifies forest cover loss, urban expansion, and vegetation health (NDVI). These data quantify carbon fluxes from deforestation and land‑use change.
5. Extreme Event Attribution
Climate models, initialized with observed conditions, simulate counterfactual worlds without anthropogenic warming. Comparing model ensembles isolates the added risk of heatwaves, hurricanes, and wildfires attributable to human influence.
6. Biodiversity and Ecosystem Response
NASA’s Earth Observing System (EOS) combines habitat mapping with temperature and precipitation trends to predict range shifts and extinction risk for vulnerable species.
7. Evaluating Solutions
Remote sensing tracks renewable‑energy infrastructure, reforestation progress, and carbon‑capture sites, providing feedback on the effectiveness of mitigation actions.
What Does the Evidence Show?
Multiple, independent lines of evidence converge on the same conclusions. Long‑term surface temperature records from NASA’s GISTEMP, NOAA, and the UK Met Office all indicate a ~1.2 °C rise since 1880 (IPCC, 2021). Ice‑sheet mass loss measured by GRACE‑FO shows Greenland losing ~280 Gt yr⁻¹ and Antarctica ~150 Gt yr⁻¹ in the 2010s, enough to raise global sea level by ~0.8 mm yr⁻¹ (NASA, 2022). Ocean heat content has increased by ~24 × 10²² J per decade, while surface pH has fallen from 8.2 to 8.1, a 30 % increase in acidity (NOAA, 2023). Attribution studies consistently find that the probability of extreme heat events has more than doubled under current warming (NASA, 2021). Together, these observations form a robust, high‑confidence picture of a warming planet.
Main Causes or Drivers
Direct Human Drivers
Combustion of fossil fuels releases carbon dioxide (CO₂), methane (CH₄), and nitrous oxide (N₂O), enhancing the greenhouse effect. The Global Carbon Project estimates that fossil‑fuel CO₂ emissions averaged 36.4 Gt C yr⁻¹ in 2022.
Land‑Use Change
Deforestation reduces the biosphere’s capacity to absorb CO₂. MODIS data show a net loss of ~10 million ha of forest per year in tropical regions (NASA, 2020).
Feedback Mechanisms
Melting ice reduces surface albedo, leading to additional solar absorption—a positive feedback. Similarly, warmer oceans release less CO₂, slowing a natural sink.
Environmental and Human Impacts
Environmental Impacts
Rising temperatures drive shifts in species ranges, coral bleaching, and permafrost thaw. Sea‑level rise threatens low‑lying habitats, while ocean acidification impairs calcifying organisms such as corals and shellfish.
Human Health and Social Impacts
Heat‑related mortality increases, especially among the elderly and outdoor workers. Changes in vector‑borne disease patterns have been linked to expanding mosquito habitats.
Economic and Infrastructure Impacts
Coastal flooding damages property and incurs billions in repair costs. Extreme storms disrupt supply chains, and agricultural yields become more variable, affecting food security.
Regional Differences
High‑latitude regions experience amplified warming (up to 2 °C in the Arctic) due to ice‑albedo feedback, while tropical oceans show the greatest heat uptake. Small island states face disproportionate sea‑level risk, whereas interior continental areas may see intensified drought. These patterns reflect differences in geography, land‑cover, and socioeconomic vulnerability.
What Scientists Know With High Confidence
- Human activities are the dominant cause of observed global warming since the mid‑20th century.
- The planet’s average surface temperature has risen by about 1.2 °C relative to pre‑industrial levels.
- Ice‑sheet mass loss in Greenland and Antarctica contributes measurably to sea‑level rise.
- Ocean heat content is increasing, and surface ocean pH is decreasing, confirming acidification.
- The frequency and intensity of heatwaves and heavy precipitation events have risen in a warming world.
What Remains Uncertain
Key uncertainties involve the timing and magnitude of climate feedbacks such as permafrost carbon release, cloud‑cover changes, and the exact regional response of monsoon systems. While models agree on the direction of change, the precise rate of sea‑level rise by 2100 varies between 0.3 m and 1.0 m depending on emission scenarios and ice‑sheet dynamics. Improved observations and higher‑resolution modeling are needed to narrow these ranges.
Common Misconceptions
Misconception: “Climate change is just about hotter summers.”
Reality: Climate change affects the entire Earth system, including ice melt, ocean chemistry, extreme weather, and ecosystem shifts—not merely temperature averages.
Misconception: “NASA only studies space, not Earth.”
Reality: NASA’s Earth‑observing satellites have been the primary source of global climate data for four decades, providing the most comprehensive view of planetary change.
Misconception: “Individual actions can solve climate change alone.”
Reality: Personal lifestyle changes matter, but systemic policy, infrastructure, and large‑scale technology deployment are required to reduce greenhouse‑gas emissions at the scale needed.
Solutions and Limitations
Mitigation strategies include rapid decarbonization of energy, large‑scale renewable deployment, and improving energy efficiency. NASA’s satellite data help locate optimal sites for wind and solar farms, yet challenges such as intermittency, storage costs, and grid integration remain. Carbon‑capture and storage (CCS) can remove CO₂ from point sources, but current deployment is limited and expensive. Nature‑based solutions—reforestation, wetland restoration—enhance carbon sinks, but they require land, long‑term stewardship, and cannot replace emissions cuts. Adaptation measures such as resilient infrastructure, early‑warning systems, and climate‑smart agriculture reduce vulnerability, yet they do not address the root cause of warming.
What Individuals, Communities, and Governments Can Do
What Individuals Can Do
Reduce household energy use (e.g., efficient appliances, insulation), choose low‑carbon transportation, and support policies that expand renewable energy. Engaging in local tree‑planting or habitat restoration projects provides co‑benefits for air quality and community resilience.
What Communities and Organizations Can Do
Implement community energy micro‑grids, adopt green building standards, and develop climate‑risk assessments to guide land‑use planning. Organizations can set science‑based emissions targets and invest in employee commuting programs.
What Governments Can Do
Enact carbon pricing, fund research and deployment of clean technologies, and enforce building codes that require energy efficiency. Investing in robust monitoring networks, many of which are operated by NASA and NOAA, improves early‑warning capacity and informs adaptive planning.
Synthesis
NASA’s seven core insights—rising temperatures, ice loss, ocean change, land‑use impacts, extreme‑event attribution, biodiversity risk, and evidence‑backed solutions—form a coherent framework for understanding climate change. High‑confidence findings confirm that human activities drive warming, while uncertainties revolve around feedback strength and regional outcomes. Effective response demands a mix of mitigation, adaptation, and nature‑based actions, each with clear trade‑offs. By leveraging NASA’s observational legacy, societies can make informed choices that curb emissions, protect vulnerable ecosystems, and build resilience for a changing climate.
Frequently Asked Questions
What are the seven key insights NASA provides about climate change?
NASA highlights seven core findings: (1) global surface temperature has risen about 1.2 °C since the late 1800s, (2) Greenland and Antarctic ice sheets are losing mass rapidly, (3) oceans are warming and becoming more acidic, (4) deforestation and land‑use change increase atmospheric CO₂, (5) extreme weather events are becoming more frequent and intense, (6) biodiversity faces heightened extinction risk, and (7) satellite data guide mitigation and adaptation strategies.
How does NASA measure global temperature trends from space?
NASA uses instruments such as the Atmospheric Infrared Sounder (AIRS) and MODIS to detect infrared radiation emitted by Earth’s surface and atmosphere. The measured radiance is converted to temperature, producing global temperature grids that are averaged over months and years, revealing long‑term warming trends.
Why is ocean acidification a concern, and how is it linked to NASA’s observations?
Ocean acidification occurs when the sea absorbs excess CO₂, lowering pH and reducing carbonate availability for organisms like corals and shellfish. NASA’s satellite and in‑situ sensors track surface pH trends, showing a decline from 8.2 to 8.1, confirming a 30 % increase in acidity that threatens marine ecosystems and fisheries.
What are the main uncertainties in predicting future sea‑level rise?
Uncertainties stem from the timing and magnitude of feedbacks such as permafrost carbon release, cloud changes, and ice‑sheet dynamics. Model projections for 2100 range from 0.3 m to 1.0 m of rise, depending on emission scenarios and how quickly Greenland and Antarctica lose ice. Better observations and higher‑resolution models are needed to narrow these ranges.
What actions can individuals take to help address climate change according to NASA’s research?
Individuals can reduce household energy use by improving insulation, using efficient appliances, and adopting low‑carbon transportation. Supporting renewable‑energy policies, participating in local tree‑planting or habitat restoration, and advocating for climate‑smart community planning are additional steps that align with NASA‑derived evidence on effective mitigation and adaptation.





Leave a Comment