
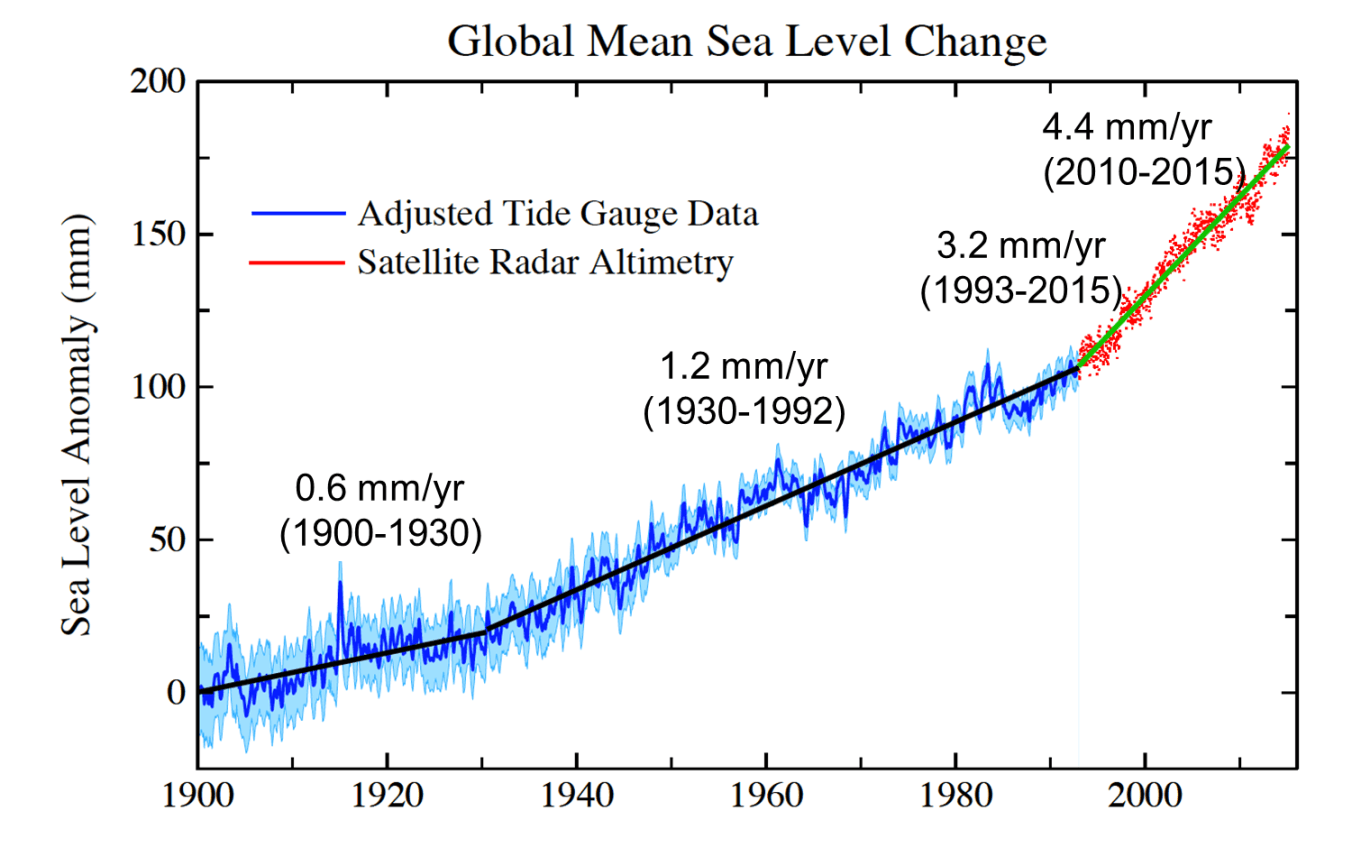
Sea level has risen about 20–25 cm (8–9 in) since 1900, and the rate of rise has more than doubled in the last three decades, driven by thermal expansion and melting ice, with significant but regionally variable impacts.
Quick Answer
Sea level has risen roughly 20–25 cm (8–9 in) worldwide since 1900, and the average rate of increase accelerated from about 1.4 mm yr⁻¹ in the 20th century to 3.3 mm yr⁻¹ after 1993. The primary mechanisms are thermal expansion of warming seawater and increased melt from glaciers and the Greenland and Antarctic ice sheets, as documented by the IPCC Sixth Assessment Report (2021) and long‑term tide‑gauge records. This acceleration raises the likelihood of more frequent coastal flooding, ecosystem loss, and displacement of vulnerable communities, although precise future rates depend on greenhouse‑gas emissions and ice‑sheet dynamics.
Key Takeaways
- Global mean sea level rose ~20–25 cm (8–9 in) from 1900 to 2023.
- The long‑term rise rate has accelerated from ~1.4 mm yr⁻¹ to ~3.3 mm yr⁻¹ in the past three decades.
- Thermal expansion and ice‑sheet/glacier melt together account for >90 % of the observed rise.
- Impacts vary by region, with low‑lying deltas and small islands facing the greatest exposure.
- High‑confidence findings exist, but uncertainties remain in ice‑sheet dynamics and future emission pathways.
What Is Sea Level Rise in the Past 100 Years: How Fast Is It Accelerating?
Sea‑level rise (SLR) refers to the long‑term increase in the average height of the world’s oceans relative to the solid Earth. When we speak of “the past 100 years,” we are considering the period from roughly 1900 to the present, a span covered by instrumental tide‑gauge records, satellite altimetry, and proxy reconstructions. The term “acceleration” describes a measurable increase in the rate of rise over time, not a sudden jump. Understanding SLR is essential because ocean height directly influences coastal flooding, erosion, salt‑water intrusion, and the stability of habitats such as mangroves and coral reefs.
How Does It Work?
Physical mechanisms
- Thermal expansion: As seawater warms, its volume increases. This is a well‑understood physical response described by the equation of state for water. Global‑average ocean heat content rose by about 24 × 10²² J between 1971 and 2018, contributing roughly 30–40 % of observed sea‑level rise (IPCC, 2021).
- Glacial and ice‑sheet melt: Surface melting of mountain glaciers and accelerated discharge from the Greenland and Antarctic ice sheets add fresh water to the oceans. Satellite gravimetry (GRACE) shows that ice‑sheet mass loss increased from ~200 Gt yr⁻¹ in the 1990s to >450 Gt yr⁻¹ in the 2010s.
- Land‑water storage changes: Human activities such as groundwater extraction and reservoir construction alter the amount of water stored on land, indirectly affecting sea level. Global groundwater depletion adds an estimated 0.2–0.4 mm yr⁻¹.
Feedbacks and thresholds
Ice‑sheet dynamics involve feedbacks such as melt‑water lubrication of bedrock and marine‑ice sheet instability, which can cause nonlinear acceleration. While these processes are observed, their future trajectories remain a major source of uncertainty.
What Does the Evidence Show?
Multiple, independent lines of evidence converge on a clear picture of accelerating SLR:
- Tide‑gauge records: The Permanent Service for Mean Sea Level (PSMSL) reports an average global rise of 1.4 mm yr⁻¹ for the 20th century, based on over 2,000 stations.
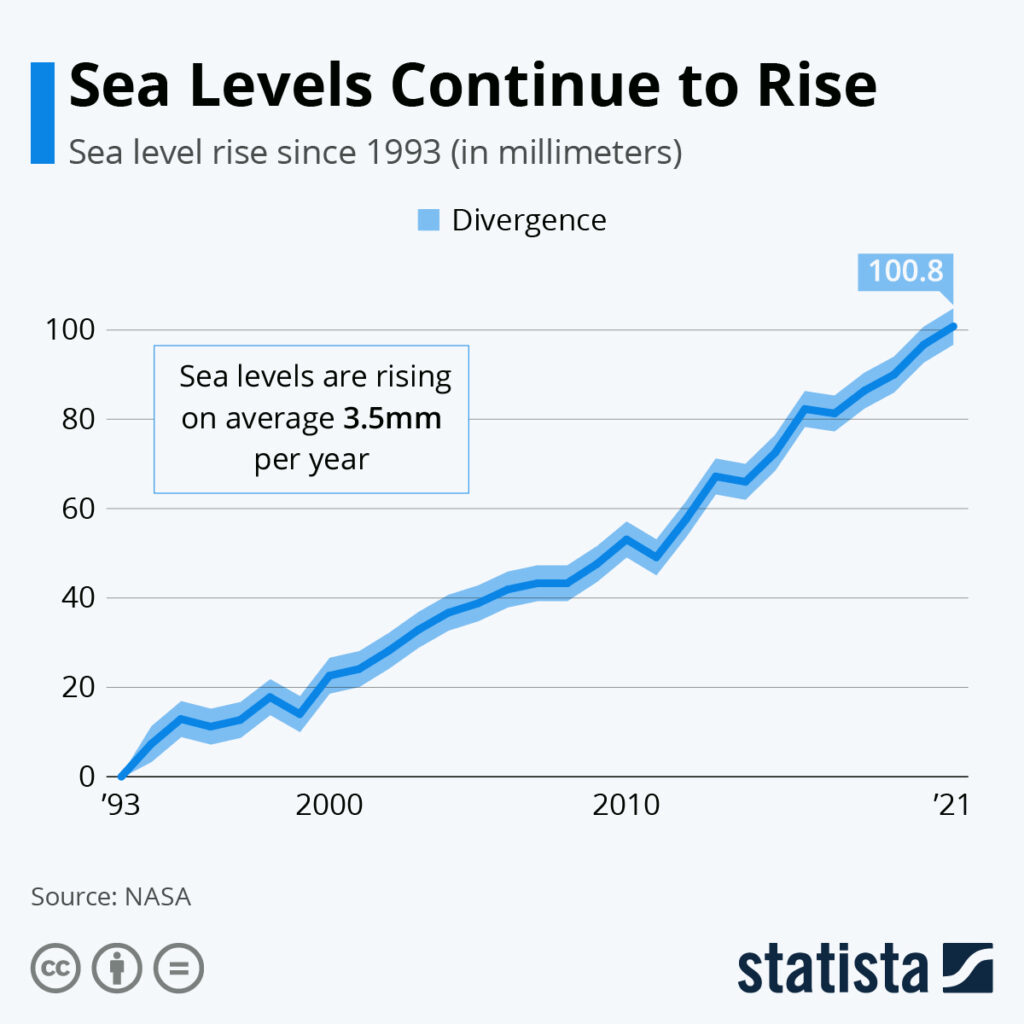
- Satellite altimetry: Since 1993, satellite missions (TOPEX/Poseidon, Jason‑1/2/3) have measured a global mean rise of 3.3 mm yr⁻¹, more than double the earlier rate.
- GRACE gravity data: Shows increasing mass loss from Greenland (≈200 Gt yr⁻¹ in the early 2000s to ≈350 Gt yr⁻¹ in the 2010s) and Antarctica (≈150 Gt yr⁻¹ to ≈250 Gt yr⁻¹), confirming the melt contribution.
- IPCC assessment: The Sixth Assessment Report (2021) synthesises these observations and concludes that the rate of SLR has accelerated and will continue to do so under all emissions scenarios.
Collectively, these data sets give strong confidence that sea level is rising faster now than in the previous century.
Main Causes or Drivers
Direct causes
- Thermal expansion of seawater (≈30–40 % of total rise).
- Melting of mountain glaciers (≈10–15 %).
- Mass loss from the Greenland Ice Sheet (≈25 %).
- Mass loss from the Antarctic Ice Sheet (≈20 %).
Underlying drivers
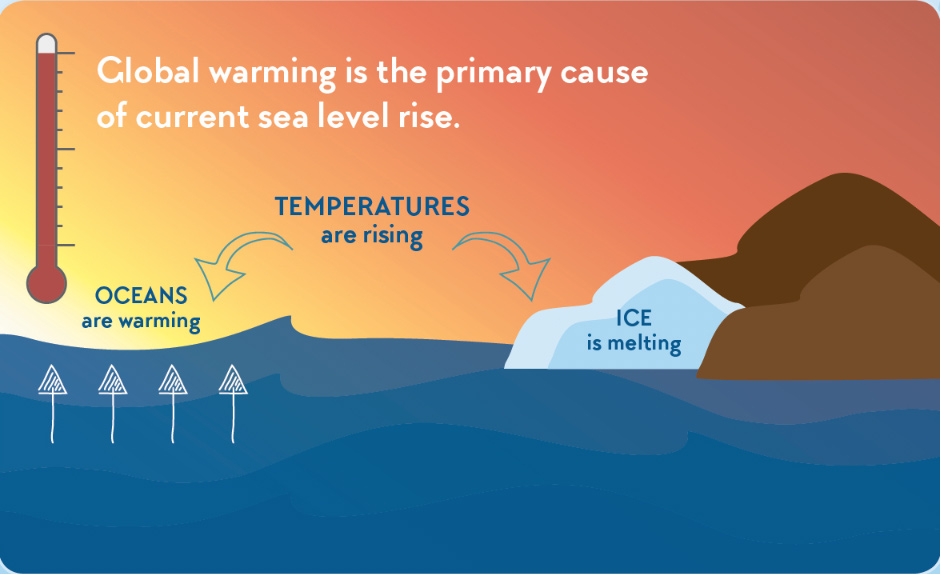
Human‑induced greenhouse‑gas emissions raise global temperatures, which in turn drive both thermal expansion and ice melt. Natural variability (e.g., volcanic eruptions, solar cycles) modulates short‑term trends but does not explain the long‑term acceleration.
Environmental and Human Impacts
Environmental Impacts
- Coastal wetlands and mangroves experience landward migration; where space is limited, they may be lost, reducing carbon sequestration and storm buffering.
- Coral reefs suffer from increased sedimentation and altered light regimes, compounding bleaching stress.
- Ocean circulation patterns can be subtly altered by changing density gradients, with potential feedbacks to regional climate.
Human Health and Social Impacts
- Higher baseline tides increase the frequency of “sunny‑day flooding,” exposing homes, roads, and utilities to water damage.
- Salt‑water intrusion contaminates freshwater aquifers, threatening drinking water supplies and agriculture.
- Populations in low‑lying deltas (e.g., the Mekong, Nile, Ganges‑Brahmaputra) face heightened displacement risk, creating climate‑related migration pressures.
Economic and Infrastructure Impacts
- Coastal property values decline where flood risk rises, affecting tax bases and insurance markets.
- Adaptation investments (e.g., sea walls, elevated infrastructure) can run into billions of dollars for major metros such as Miami, New York, and Shanghai.
Regional Differences
Sea‑level change is not uniform. Factors such as ocean dynamics, land subsidence, and gravitational effects cause regional deviations of up to ±30 % from the global mean.
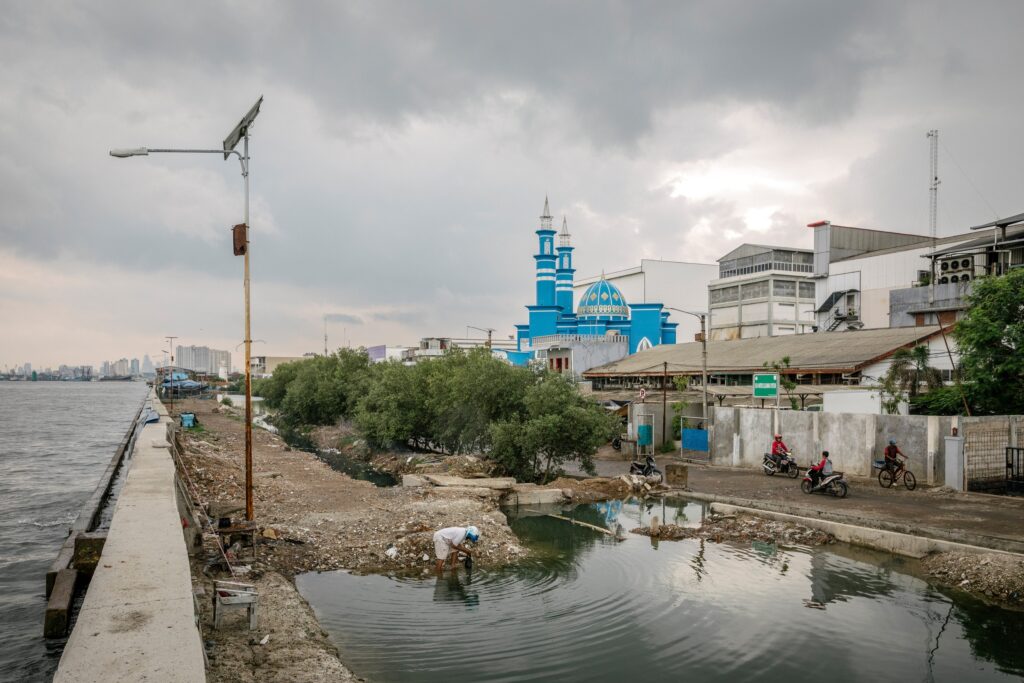
- Western Pacific: The combination of thermal expansion and land subsidence leads to rates exceeding 4 mm yr⁻¹ in parts of the Philippines and Indonesia.
- North Atlantic: The Gulf Stream slowdown contributes to slightly lower rise rates along the U.S. East Coast compared with the global average.
- Southern Indian Ocean: Antarctic melt‑water redistribution causes a modest sea‑level dip near Antarctica but a rise elsewhere.
What Scientists Know With High Confidence
What Scientists Know With High Confidence
- Global mean sea level has risen about 20–25 cm since 1900.
- The rate of rise has accelerated, reaching ~3.3 mm yr⁻¹ since the early 1990s.
- Thermal expansion and ice‑sheet melt together account for the majority of observed sea‑level rise.
- All major climate‑assessment bodies agree that continued greenhouse‑gas emissions will increase future sea‑level rise.
What Remains Uncertain
What Remains Uncertain
Key uncertainties revolve around the future behaviour of the Antarctic Ice Sheet, especially the West Antarctic sector, where marine‑ice sheet instability could add several metres of sea level over centuries. Model representations of ice‑sheet grounding‑line dynamics differ, leading to a range of projected contributions for 2100 (0.5–2.5 m under high‑emission scenarios). Additionally, regional land‑movement data are sparse in many developing‑country coastlines, limiting precise local risk assessments.
Common Misconceptions
Common Misconceptions
Misconception: Sea‑level rise is only a concern for distant future generations.
Reality: Current acceleration means many coastal communities already experience increased flood frequency and property loss.
Misconception: All sea‑level rise is caused by melting ice.
Reality: About one‑third of the observed rise is due to thermal expansion of warming seawater, a separate physical process.
Misconception: Sea‑level rise is the same everywhere.
Reality: Regional variations arise from ocean currents, gravitational redistribution of meltwater, and land subsidence or uplift.
Misconception: Building sea walls will solve the problem.
Reality: Sea walls can protect specific assets but may exacerbate erosion elsewhere and are costly; they do not address the underlying drivers.
Solutions and Limitations
Responses fall into three broad categories: mitigation, adaptation, and ecosystem‑based approaches.
- Mitigation: Reducing CO₂ emissions limits future warming, thereby slowing thermal expansion and ice melt. The limitation is that global mitigation requires coordinated policy and economic transformation, which takes decades.
- Hard‑engineered adaptation: Sea walls, surge barriers, and elevated infrastructure can protect high‑value assets. Limitations include high capital costs, potential ecological harm, and the need for periodic upgrades as sea level continues to rise.
- Nature‑based solutions: Restoring mangroves, salt‑marshes, and coral reefs provides shoreline stabilization, carbon storage, and biodiversity benefits. These approaches are cost‑effective but depend on suitable space and may be vulnerable to sea‑level thresholds themselves.
- Land‑use planning: Restricting development in high‑risk zones reduces future exposure. Implementation faces political resistance and requires robust zoning enforcement.
What Individuals, Communities, and Governments Can Do
What Individuals Can Do
- Support policies that aim for net‑zero emissions, such as voting for climate‑action legislation.
- Participate in local coastal‑restoration projects, e.g., planting mangroves or volunteering for wetland monitoring.
- Reduce personal carbon footprints by adopting energy‑efficient appliances, low‑carbon transportation, and sustainable consumption.
What Communities and Organizations Can Do
- Develop and regularly update local flood‑risk maps that incorporate the latest sea‑level projections.
- Invest in “living shorelines” that blend engineered structures with native vegetation.
- Establish emergency‑response plans for frequent minor flooding events.
What Governments Can Do
- Integrate sea‑level projections into national infrastructure planning, building codes, and zoning regulations.
- Fund long‑term monitoring networks (tide gauges, satellite altimetry) to improve data coverage, especially in vulnerable regions.
- Provide financing mechanisms (e.g., resilience bonds) that enable municipalities to implement large‑scale adaptation measures.
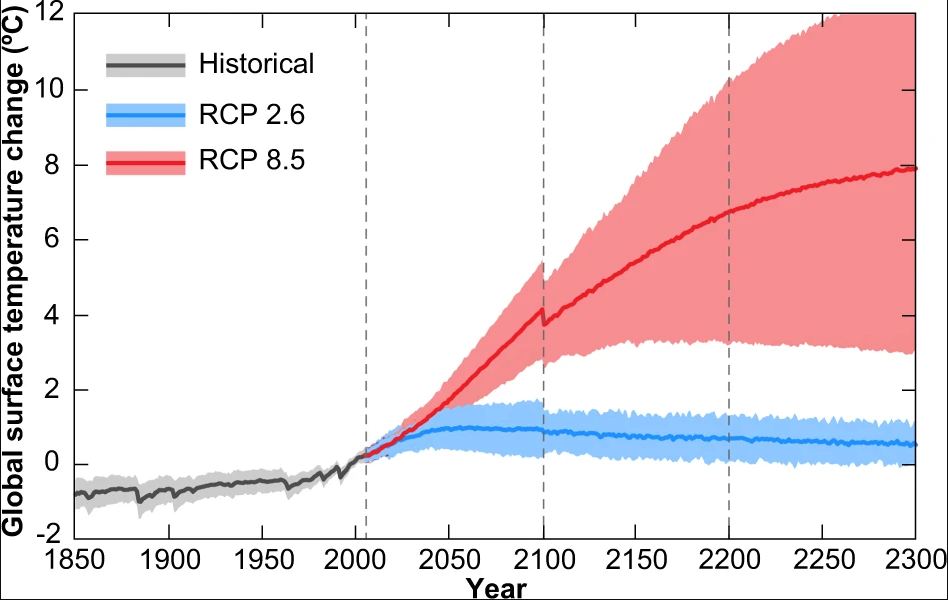
- Lead international climate‑mitigation negotiations to keep global temperature rise below 1.5 °C, thereby limiting future sea‑level acceleration.
Synthesis of Findings
Over the past century the world’s oceans have risen roughly 20–25 cm, and the speed of that rise has more than doubled in recent decades because warming water expands and ice sheets melt faster. High‑confidence evidence confirms the trend, while uncertainties remain around the long‑term response of the Antarctic Ice Sheet and the precise regional impacts. Solutions must combine aggressive greenhouse‑gas mitigation with targeted adaptation—both engineered and nature‑based—while recognizing economic, social, and ecological trade‑offs. By acting now, societies can reduce future exposure, protect coastal ecosystems, and safeguard the livelihoods of millions who live near the sea.
Frequently Asked Questions
How much has global sea level risen in the last 100 years?
Global mean sea level has risen roughly 20–25 cm (8–9 in) since 1900, based on tide‑gauge records and satellite altimetry.
What are the main drivers behind the accelerating sea‑level rise?
The acceleration is driven mainly by thermal expansion of warming seawater and increased melt from glaciers, the Greenland Ice Sheet, and the Antarctic Ice Sheet.
Why does sea‑level rise differ between regions?
Regional differences arise from ocean currents, land subsidence or uplift, and the redistribution of meltwater’s gravitational pull, causing some areas to experience higher or lower rates than the global average.
What are the most reliable findings about sea‑level rise?
High‑confidence findings include a 20–25 cm rise since 1900, a doubling of the rise rate to about 3.3 mm yr⁻¹ after 1993, and that thermal expansion plus ice‑sheet melt account for over 90 % of observed change.
What actions can governments take to address accelerating sea‑level rise?
Governments can integrate sea‑level projections into planning codes, fund monitoring networks, provide financing for adaptation projects, and pursue aggressive emission‑reduction policies to limit future acceleration.





Leave a Comment