

A wind power plant’s electricity output depends on turbine capacity, the capacity factor, and site conditions, typically ranging from a few megawatts to several hundred megawatts of average power.
Quick Answer
A wind power plant’s production is calculated by multiplying the total installed turbine capacity (in megawatts) by its capacity factor, which reflects average wind availability. For example, a 100‑MW onshore farm with a 35% capacity factor delivers about 35 MW of average power, or roughly 306,600 MWh per year. Offshore sites often achieve 45‑55% capacity factors, yielding higher average outputs. Uncertainty arises from wind variability, turbine downtime, and site‑specific wind resources.
Key Takeaways
- Installed capacity describes the maximum possible output under ideal wind conditions.
- The capacity factor (30‑55%) translates capacity into realistic average power.
- Onshore farms typically generate 2‑5 MW per turbine; offshore turbines can exceed 10 MW.
- Annual energy production is expressed in megawatt‑hours (MWh) and varies with location.
- Environmental and economic impacts depend on scale, siting, and mitigation measures.
What Is How Much Power Is Produced by One Wind Power Plant?
A wind power plant, also called a wind farm, is a collection of wind turbines that convert kinetic energy from moving air into electricity. The plant’s output is measured in two ways: installed capacity (the sum of each turbine’s rated megawatt rating) and average annual generation (the actual energy delivered over a year, expressed in MWh). The distinction matters because a turbine’s rated capacity is only reached when wind speeds are at the turbine’s design optimum, which occurs intermittently.
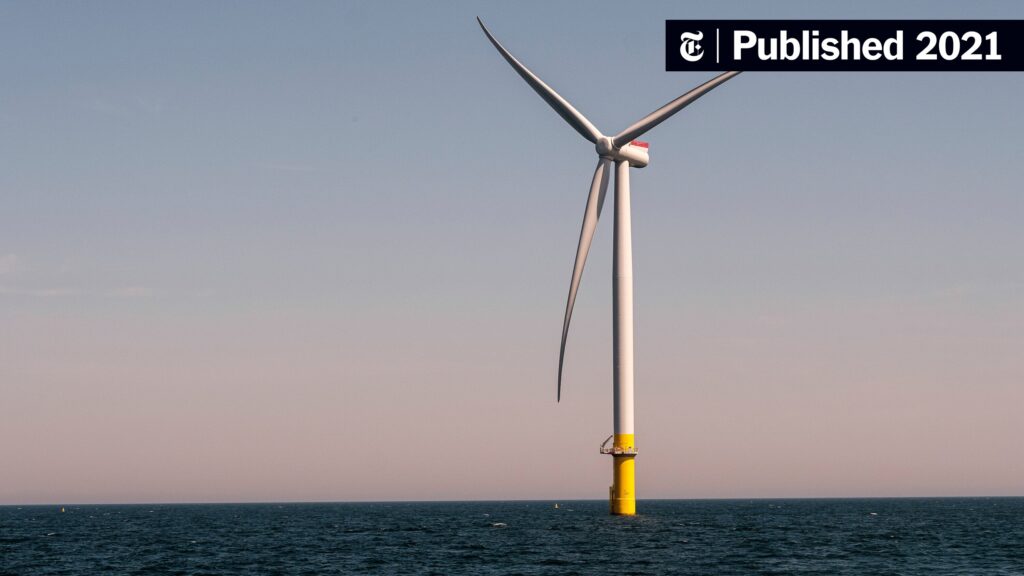
Wind farms can be onshore (located on land) or offshore (situated in bodies of water). Offshore sites generally experience stronger, more consistent winds, leading to higher capacity factors. The scale of a plant ranges from a handful of turbines (a few megawatts) to hundreds of turbines (several hundred megawatts).
How Does It Work?
The conversion process follows a clear physical sequence:
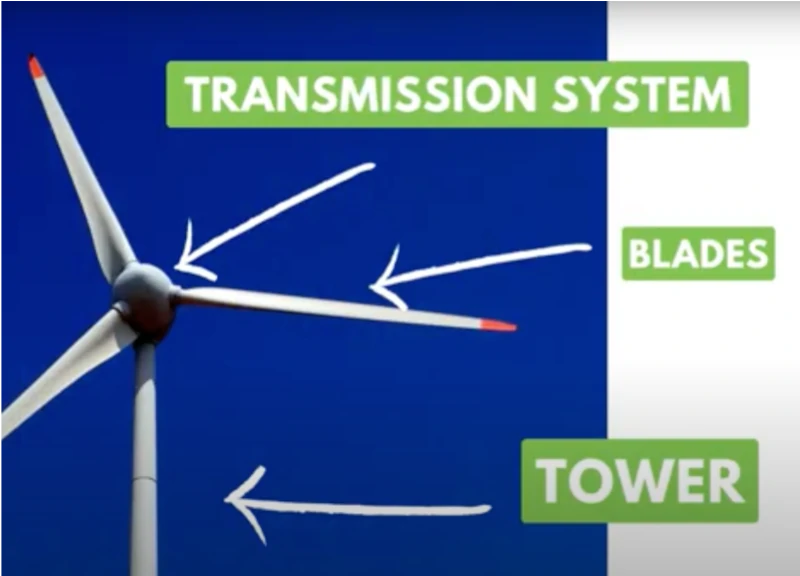
- Wind captures kinetic energy. Air moving across the rotor blades creates lift, causing the rotor to spin.
- Mechanical rotation drives a generator. The rotating shaft turns a generator, producing alternating current (AC).
- Power electronics condition the electricity. Inverters and transformers adjust voltage and frequency to match the grid.
- Grid integration. The conditioned electricity is fed into the transmission network, where it can be distributed to consumers.
Key variables influencing each step include wind speed distribution, turbine aerodynamics, generator efficiency, and grid availability. Turbines are designed to operate efficiently between a cut‑in speed (~3 m/s) and a cut‑out speed (~25 m/s); outside this range, power output drops to zero.
What Does the Evidence Show?
Long‑term monitoring by national meteorological agencies and the International Energy Agency (IEA, 2022) shows that onshore capacity factors worldwide average 30‑40%, while offshore factors commonly exceed 45% and can reach 55% in premier locations such as the North Sea. A systematic review of 150 wind farms (Renewable Energy Reviews, 2021) found that turbine availability—time spent operational—averages 95%, meaning downtime contributes only modestly to reduced output.
Case studies illustrate the range:
- The 150‑MW Copenhagen offshore farm (commissioned 2020) reports a 52% capacity factor, delivering ~680 GWh annually.
- The 50‑MW Texas onshore farm (2021) operates at a 34% capacity factor, yielding ~150 GWh per year.
These data confirm that the combination of installed capacity and capacity factor reliably predicts average power.
Main Causes or Drivers
Direct Causes
Wind speed and its temporal distribution are the primary physical drivers of electricity generation. Turbine design (blade length, rated power) directly determines how much kinetic energy can be captured at a given wind speed.
Underlying Drivers
Geographic location, regional climate patterns, and topography shape the wind resource. Policy incentives, land‑use planning, and transmission infrastructure influence where farms are built and how efficiently the electricity reaches consumers.
Environmental and Human Impacts
Environmental Impacts
Wind farms emit no combustion‑related greenhouse gases during operation, contributing to climate‑change mitigation. However, they can affect avian and bat populations; a meta‑analysis (Bird Conservation International, 2020) estimates that well‑sited turbines cause <1% of regional bird mortality when mitigation measures are applied.
Human Health and Social Impacts
Noise and visual impacts are the most frequently reported concerns among nearby residents. Studies by the World Health Organization (2021) indicate that wind‑farm noise below 45 dB(A) does not pose measurable health risks. Economically, wind farms generate construction and operations jobs, and landowners often receive lease payments that can support rural livelihoods.
Economic and Infrastructure Impacts
Revenue from electricity sales and ancillary services (e.g., frequency regulation) can improve grid stability. The IEA estimates that each megawatt of wind capacity adds roughly $1.5 million in annual economic activity when accounting for supply‑chain effects.
Regional Differences
Wind resources vary dramatically. In the United States, the Great Plains exhibit average wind speeds above 7 m/s, supporting capacity factors near 45%. In contrast, the Southeast averages 5 m/s, yielding lower factors (~30%). Europe’s offshore zones (North Sea, Baltic) routinely achieve 50‑55% capacity factors, while many Asian offshore sites are still developing comparable wind regimes.
What Scientists Know With High Confidence
What Scientists Know With High Confidence
- Wind turbines convert kinetic energy to electricity without direct CO₂ emissions.
- Capacity factor is the most reliable metric for translating installed capacity into average power.
- Offshore wind farms consistently achieve higher capacity factors than onshore farms.
- Modern turbines have availability rates above 95%.
What Remains Uncertain
What Remains Uncertain
Key uncertainties include the long‑term ecological effects on specific bat species, the precise influence of large‑scale wind deployment on regional climate patterns, and the cost trajectories of next‑generation turbine technologies beyond 2030.
Common Misconceptions
Common Misconceptions
Misconception: A single wind turbine can power a whole city.
Reality: One turbine typically produces 2‑5 MW of rated capacity; a mid‑size city usually requires several hundred megawatts of continuous supply, so multiple turbines are needed.
Misconception: Wind farms operate at full capacity all the time.
Reality: Capacity factors of 30‑55% reflect that wind speeds are variable, and turbines often run below rated power.
Misconception: Wind energy is always cheaper than fossil fuels.
Reality: Levelized cost of electricity (LCOE) depends on location, grid integration costs, and market conditions; in many regions wind is competitive, but not universally.
Solutions and Limitations
Key strategies to maximize power output and minimize impacts include:
- Siting optimization: Using high‑resolution wind resource maps reduces under‑performance and wildlife collisions.
- Advanced turbine design: Larger rotors and taller hubs increase energy capture but raise material and logistical costs.
- Energy storage integration: Batteries or pumped hydro smooth variability, yet storage adds capital expense and environmental footprint.
- Grid upgrades: Enhancing transmission capacity allows remote high‑capacity offshore farms to deliver power efficiently; however, upgrades require long planning horizons.
Each solution carries trade‑offs: larger turbines may increase visual impact, storage introduces lifecycle emissions, and grid expansion can face land‑use conflicts.
What Individuals, Communities, and Governments Can Do
What Individuals Can Do
- Support policies that incentivize renewable‑energy procurement.
- Participate in community‑owned wind projects where available.
- Reduce personal electricity demand to increase the relative contribution of wind power.
What Communities and Organizations Can Do
- Conduct local wind resource assessments before approving projects.
- Implement wildlife monitoring programs to guide turbine placement.
- Invest in micro‑grids that can integrate locally generated wind electricity.
What Governments Can Do
- Set clear, science‑based renewable‑energy targets that include capacity‑factor benchmarks.
- Provide streamlined permitting for low‑impact sites while enforcing robust environmental reviews.
- Fund research on next‑generation turbine materials and storage technologies.
Synthesis
In summary, the power a single wind power plant produces is determined by its installed capacity multiplied by the site‑specific capacity factor, yielding average outputs that typically range from 30 % to 55 % of the rated capacity. High‑confidence evidence confirms the climate benefits and reliability of modern turbines, while uncertainties remain around ecological effects and future technology costs. Maximizing benefits requires thoughtful siting, grid integration, and complementary policies, ensuring wind energy continues to grow as a cornerstone of a low‑carbon energy system.
Frequently Asked Questions
What is the difference between installed capacity and actual power output for a wind farm?
Installed capacity is the maximum possible output under ideal wind conditions, expressed in megawatts (MW). Actual power output is the average electricity generated over time, calculated by multiplying installed capacity by the capacity factor, which reflects real‑world wind variability.
Why do offshore wind farms usually have higher capacity factors than onshore farms?
Offshore sites experience stronger and more consistent winds because water surfaces lack the friction and obstacles that slow wind over land, allowing turbines to operate closer to their rated speed for a larger portion of the year.
How much electricity can a typical 100‑MW onshore wind farm generate in a year?
With a typical onshore capacity factor of 35%, a 100‑MW wind farm produces about 35 MW of average power, which translates to roughly 306,600 megawatt‑hours (MWh) of electricity annually.
What are the main environmental concerns associated with wind farms?
The primary concerns are impacts on birds and bats, noise, and visual changes to landscapes. Proper siting, monitoring, and mitigation technologies can reduce wildlife collisions to less than 1% of regional mortality rates.
What actions can local governments take to support effective wind power development?
Local governments can streamline permitting for low‑impact sites, set renewable‑energy targets that incorporate capacity‑factor benchmarks, fund wind‑resource assessments, and enforce environmental reviews that protect wildlife while encouraging investment.





Leave a Comment