

Since 1880 global sea level has risen roughly 8–9 inches (20–23 cm), a change documented through tide gauges and satellite altimetry that signals ongoing climate warming and ice melt.
Quick Answer
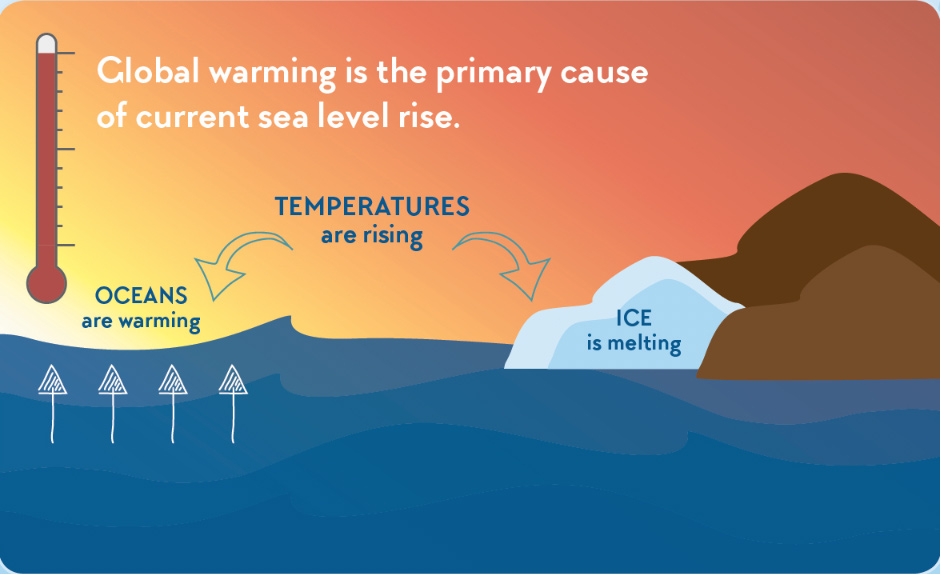
Global mean sea level has increased by about 8 to 9 inches (20 to 23 centimeters) since 1880, as measured by a network of tide gauges and, since the early 1990s, satellite altimeters. The rise is driven primarily by thermal expansion of warming ocean water and the addition of meltwater from glaciers and the Greenland and Antarctic ice sheets. While the overall trend is well established, the exact rate varies regionally and has accelerated in recent decades. The implication is higher coastal flood risk, ecosystem stress, and greater vulnerability for low‑lying populations.
Key Takeaways
- Sea level has risen ~8–9 inches (20–23 cm) globally since 1880.
- Thermal expansion accounts for roughly half of the rise; the rest comes from melting glaciers and ice sheets.
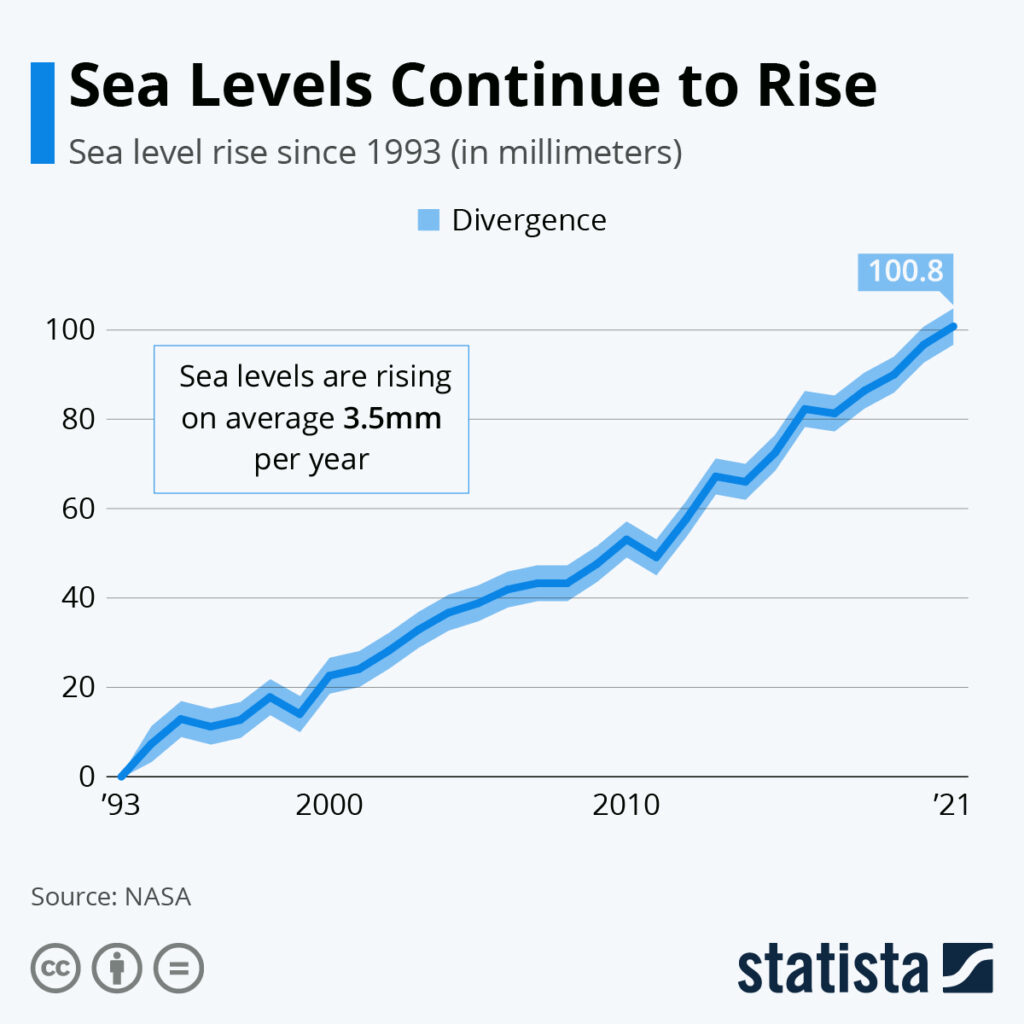
- The rate of increase has accelerated from about 0.6 mm/yr (late 19th’s) to over 3.3 mm/yr in the 21st century.
- Regional variations arise from land movement, ocean currents, and gravitational effects of ice loss.
- High confidence exists that human‑driven warming is the dominant cause of the observed rise.
What Is How Much Has Sea Level Risen Since 1880? A Historical Breakdown?
The phrase refers to the measured increase in the average height of the world’s oceans relative to a fixed land reference point, starting from the year 1880. Scientists use long‑term tide‑gauge records, anchored to the solid Earth, and satellite altimetry that measures the distance from a satellite to the sea surface. The metric captures both natural variability (e.g., El Niño) and long‑term trends driven by climate change.
How Does It Work?
Physical mechanisms
- Thermosteric expansion: As water warms, its density decreases and it expands, raising sea level.
- Glacial melt: Mountain glaciers and the Greenland Ice Sheet lose mass, adding freshwater to the oceans.
- Antarctic ice dynamics: Ice‑sheet discharge through iceberg calving and basal melting contributes additional volume.
- Land‑water redistribution: Groundwater extraction and reservoir storage can temporarily lower sea level, while post‑glacial rebound lifts land in some regions, creating apparent sea‑level fall.
Measurement timeline
From 1880 to the 1950s, sea‑level change was inferred from coastal tide gauges, which provided sparse but continuous records. The launch of the TOPEX/Poseidon satellite in 1992 introduced global, repeatable altimetry, revealing a faster acceleration. Combining both data streams yields a continuous 140‑year reconstruction.
What Does the Evidence Show?
Multiple independent data sets converge on the same conclusion. The Intergovernmental Panel on Climate Change (IPCC) Fifth Assessment Report (2013) synthesised tide‑gauge and satellite records to estimate a global mean rise of 0.19 meters (7.5 inches) between 1901 and 2010. A 2021 update from the IPCC reports 0.20–23 meters (8–9 inches) since 1880, with the rate increasing from ~0.6 mm/yr (1880–1990) to 3.3 mm/yr (2000–2020). Peer‑reviewed meta‑analyses of tide‑gauge networks (e.g., Church & White 2011) and satellite altimetry (e.g., Nerem et al. 2018) support these values within their uncertainties.
Main Causes or Drivers
Human‑induced warming
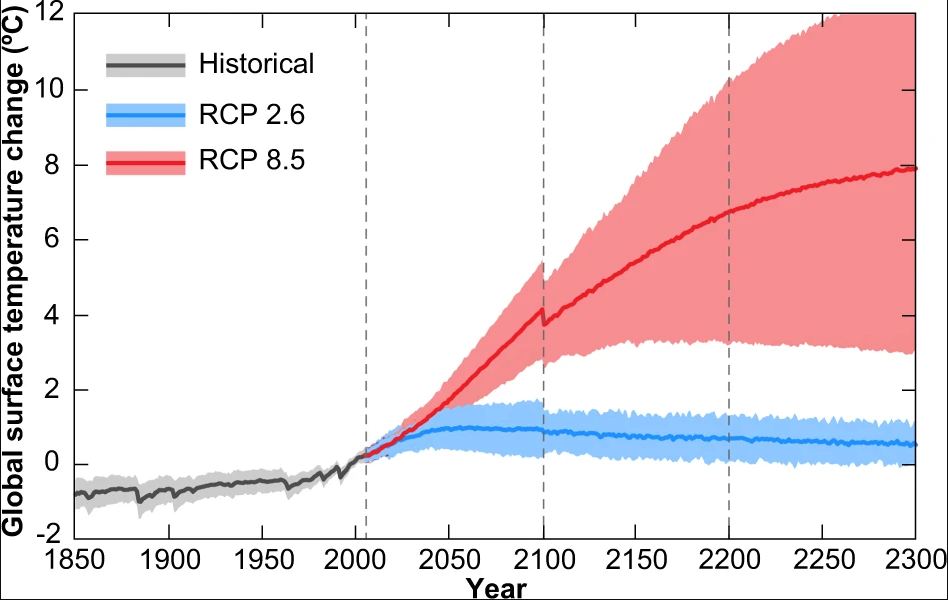
Anthropogenic greenhouse‑gas emissions have raised global mean surface temperature by about 1.1°C since pre‑industrial times, driving both thermal expansion and ice melt. The IPCC attributes >90% of observed sea‑level rise since the mid‑20th century to human activities.
Natural variability
Oscillations such as the Atlantic Multidecadal Oscillation and the Pacific Decadal Oscillation cause decadal fluctuations of a few centimeters, but they do not explain the long‑term upward trend.
Environmental and Human Impacts
Environmental Impacts
Coastal wetlands and mangroves experience increased inundation, leading to habitat loss and reduced carbon sequestration. Higher sea level accelerates shoreline erosion and threatens coral reef resilience by altering light regimes.
Human Health and Social Impacts
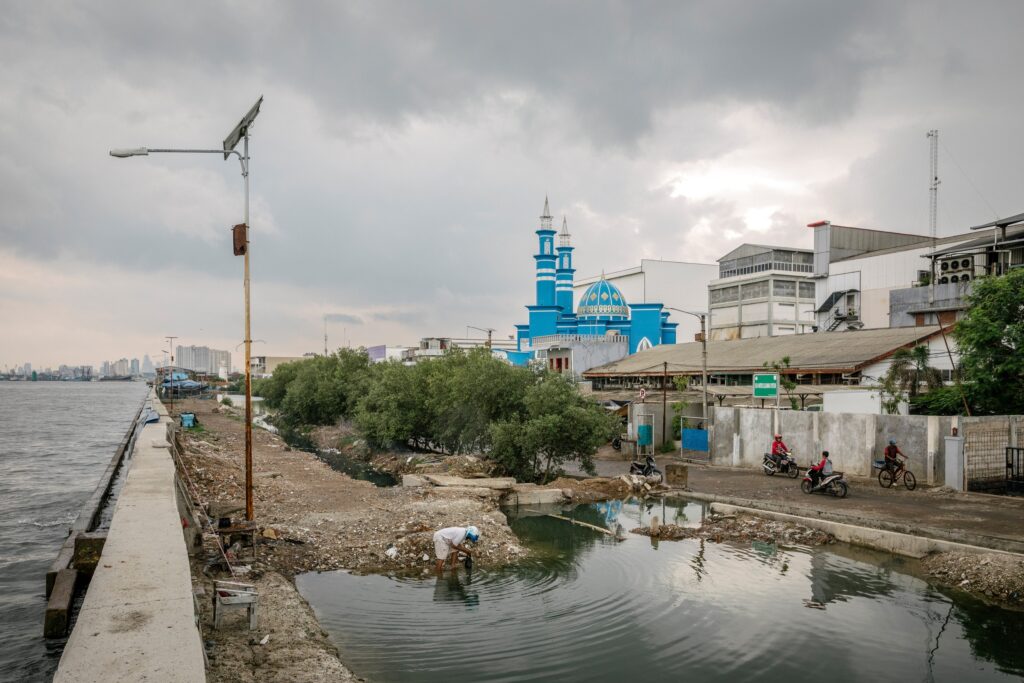
Elevated sea level amplifies storm‑surge heights, raising flood risk for coastal cities. Saltwater intrusion compromises freshwater supplies, potentially affecting drinking water quality and agriculture.
Economic and Infrastructure Impacts
Infrastructure built on low‑lying land—roads, ports, and housing—faces higher repair costs and, in some cases, relocation. The World Bank estimates that without adaptation, cumulative global coastal damages could exceed $1 trillion by 2050.
Regional Differences
Sea‑level change is not uniform. The western Pacific, for example, records rises up to 10 mm/yr due to wind‑driven water pile‑up, while parts of the U.S. Gulf Coast experience slower rates because of land subsidence offsetting ocean rise. In the northern Atlantic, post‑glacial rebound lifts the land, creating apparent sea‑level fall relative to the shoreline.
What Scientists Know With High Confidence
- Global mean sea level has risen ~20–23 cm since 1880.
- Thermal expansion and melting of land ice are the primary contributors.
- The rate of rise has accelerated in the past three decades.
- Human greenhouse‑gas emissions are the dominant driver of the acceleration.
What Remains Uncertain
Key uncertainties include the future contribution of the Antarctic Ice Sheet, especially the potential for rapid ice‑shelf collapse, and the exact magnitude of regional sea‑level fingerprints caused by uneven mass loss. Improved satellite gravimetry and longer tide‑gauge records are needed to narrow these gaps.
Common Misconceptions
Misconception: Sea‑level rise is only a future problem.
Reality: The rise has already occurred—about 8–9 inches since 1880—and is ongoing, already affecting many coastal communities.
Misconception: All sea‑level rise is caused by melting ice.
Reality: Roughly half of the observed increase is due to thermal expansion of warming seawater, not just ice melt.
Misconception: Tide‑gauge records are unreliable.
Reality: Modern analyses correct for land movement using GPS, providing robust, globally consistent estimates.
Solutions and Limitations
Addressing sea‑level rise requires both mitigation of greenhouse‑gas emissions and adaptation to the inevitable changes.
- Mitigation: Rapid decarbonisation reduces future thermal expansion and ice melt, but cannot reverse already committed sea‑level rise.
- Coastal adaptation: Hard defenses (sea walls) protect specific assets but can be costly and may shift risk elsewhere; nature‑based solutions (restoring mangroves, wetlands) offer flood buffering with co‑benefits for biodiversity, though they require suitable space and long‑term maintenance.
- Managed retreat: Relocating infrastructure from high‑risk zones eliminates exposure but involves social, economic, and political challenges.
What Individuals, Communities, and Governments Can Do
What Individuals Can Do
Support policies that limit carbon emissions, reduce personal energy use, and advocate for resilient coastal planning in local elections.
What Communities and Organizations Can Do
Implement local flood‑risk assessments, invest in green infrastructure (e.g., living shorelines), and develop emergency‑response plans that consider rising baseline water levels.
What Governments Can Do
Enact and enforce ambitious emission‑reduction targets, fund large‑scale monitoring networks, and integrate sea‑level projections into land‑use planning, building codes, and disaster‑risk financing.
Closing Synthesis
Since 1880, the world’s oceans have risen about 8–9 inches, a change firmly documented through tide‑gauge and satellite observations. The rise is driven by warming‑induced expansion and accelerated ice melt, with human activities identified as the primary cause. While the overall trend is clear, uncertainties remain regarding future Antarctic contributions and regional variations. Effective action combines rapid greenhouse‑gas mitigation with targeted adaptation—such as protecting natural coastal buffers and planning for managed retreat—tailored to local conditions. Understanding the historical trajectory equips societies to make informed decisions that protect both people and ecosystems from the advancing tide.
Frequently Asked Questions
How much has global sea level risen since 1880?
Global mean sea level has increased by roughly 8 to 9 inches (20 to 23 centimeters) since 1880, based on tide‑gauge records and satellite altimetry.
What are the main physical processes that cause sea‑level rise?
The two dominant processes are thermal expansion of warming seawater and the addition of meltwater from glaciers, the Greenland Ice Sheet, and the Antarctic Ice Sheet.
Why does sea‑level rise vary between different regions?
Regional variation arises from factors such as land uplift or subsidence, ocean currents, gravitational effects of ice‑mass loss, and local atmospheric pressure patterns.
What evidence gives scientists high confidence that human activities drive sea‑level rise?
Multiple lines of evidence—including IPCC assessments, long‑term tide‑gauge trends, and satellite observations—show that over 90% of the acceleration since the mid‑20th century is attributable to anthropogenic greenhouse‑gas emissions.
What actions can communities take to adapt to rising sea levels?
Communities can conduct flood‑risk assessments, restore natural buffers like mangroves and wetlands, invest in resilient infrastructure, and develop managed‑retreat plans for the most vulnerable areas.





Leave a Comment