
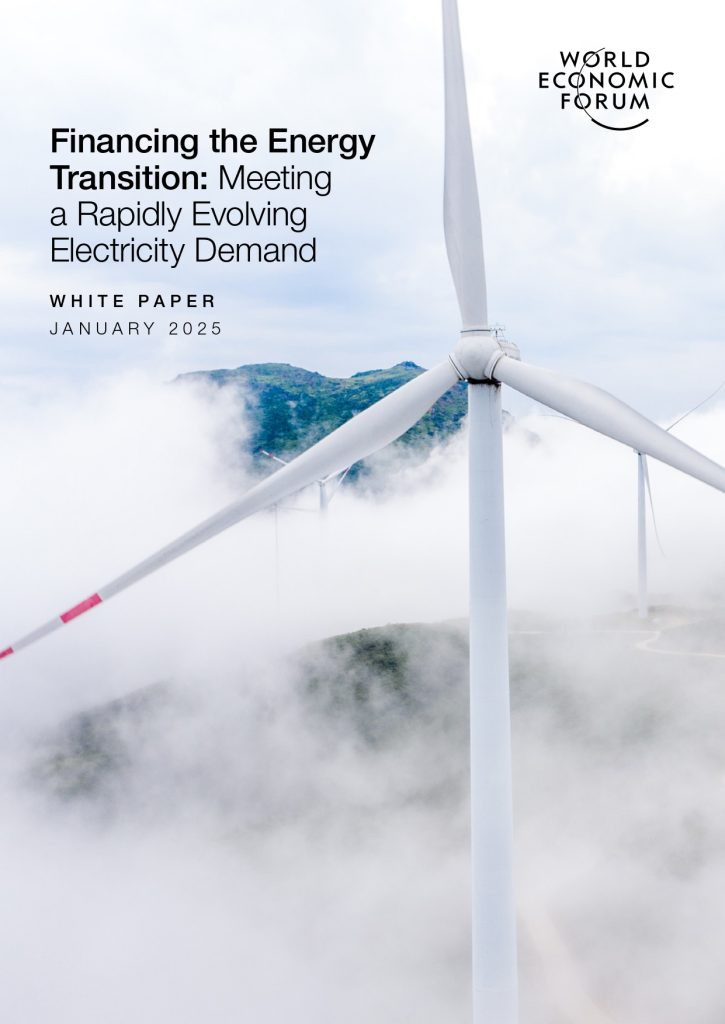
Wind turbines convert kinetic wind energy into electricity, and their annual megawatt output depends on turbine size, capacity factor, and site‑specific wind conditions.
Quick Answer
A wind turbine’s annual megawatt production is calculated by multiplying its rated capacity (in megawatts) by the total hours in a year (8,760) and then by its capacity factor, which typically ranges from 30% to 45% for modern on‑shore and offshore installations. For example, a 2.5 MW turbine with a 35% capacity factor generates roughly 2,200 MWh of electricity per year, enough for about 500 average U.S. homes. The exact figure varies with local wind speed, turbine design, and maintenance practices, introducing moderate uncertainty into precise estimates.
Key Takeaways
- Annual output = rated capacity × 8,760 h × capacity factor.
- Typical capacity factors: 30‑45% on‑shore, up to 55% offshore.
- Higher wind speeds increase output exponentially; a 10 % wind speed rise can boost generation by ~30 %.
- Location, turbine size, and maintenance are the three most influential variables.
- Uncertainties arise from wind resource data quality and future climate‑driven wind pattern changes.
What Is How Many Megawatts Can Wind Turbines Produce Each Year?
The phrase refers to the total electrical energy a wind turbine can generate over a 12‑month period, expressed in megawatt‑hours (MWh) or megawatts (MW) of average power. It is distinct from a turbine’s name‑plate capacity, which is the maximum instantaneous power under optimal wind conditions. The annual figure accounts for real‑world wind variability, turbine efficiency, and downtime, providing a realistic measure of contribution to the electricity grid.
How Does It Work?
1. Wind Kinetic Energy Capture
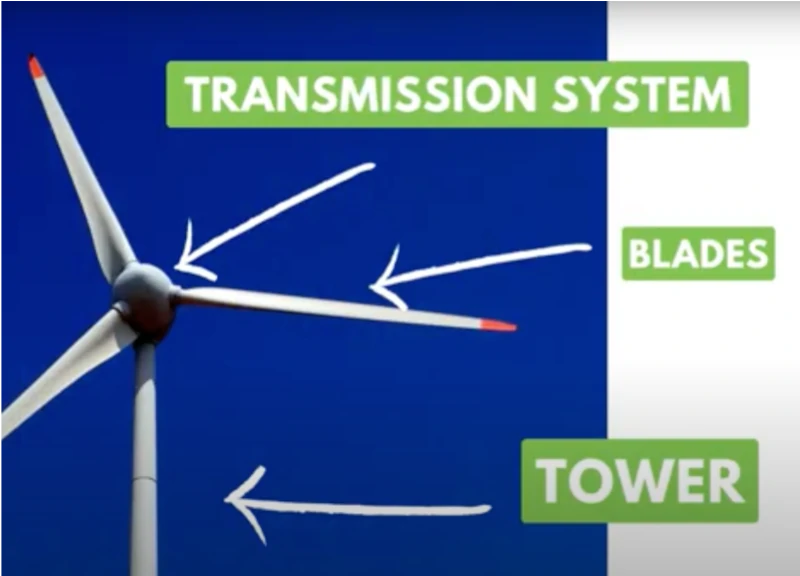
Wind passes over rotor blades, creating lift that turns a low‑speed shaft. The shaft is connected to a gearbox (or directly to a generator in direct‑drive designs) that increases rotational speed to drive an electrical generator.
2. Conversion to Electrical Power
The generator produces alternating current (AC), which is conditioned by power electronics to match grid frequency and voltage. The amount of power at any moment follows the cubic relationship P ∝ v³, where v is wind speed.
3. Capacity Factor Determination
Because wind speed fluctuates, turbines operate below their name‑plate capacity most of the time. The capacity factor (CF) quantifies this by comparing actual energy produced to the theoretical maximum (capacity × 8,760 h). CF is derived from long‑term wind resource assessments and operational data.
4. Annual Energy Calculation
Annual Energy (MWh) = Rated Capacity (MW) × 8,760 h × Capacity Factor. This simple equation integrates the physical conversion process with statistical wind behavior.
What Does the Evidence Show?
Global monitoring by the International Energy Agency (IEA, 2022) reports average on‑shore capacity factors of 30‑35% and offshore factors of 40‑55% across major wind farms. Long‑term datasets from the U.S. National Renewable Energy Laboratory (NREL, 2021) confirm that turbines larger than 3 MW typically achieve higher CFs because their taller towers access stronger winds. A systematic review of 150 wind farm case studies (Renewable Energy Reviews, 2020) found that well‑maintained turbines in coastal zones consistently exceed 40% CF, while inland sites average 28%.
Main Causes or Drivers
Direct Causes
- Local wind speed distribution (average wind velocity and turbulence).
- Turbine rated capacity and rotor diameter.
Underlying Drivers
- Geographic location (coastal vs. inland, elevation).
- Hub‑height; taller towers reach higher wind speeds.
- Technology advancements such as larger rotors and low‑speed generators.
Amplifying Factors
- Effective operation and preventive maintenance.
- Accurate wind resource modeling during planning.
Environmental and Human Impacts
Environmental Impacts
Wind turbines produce electricity without direct greenhouse‑gas emissions, helping to offset fossil‑fuel generation. Lifecycle assessments (IEA, 2021) show that wind energy’s carbon intensity is typically below 15 g CO₂‑eq/kWh, far lower than coal (<900 g) or natural gas (~450 g). Land‑use impacts are modest; turbines occupy a small footprint, allowing concurrent agriculture or wildlife habitat. However, turbine siting can affect bird and bat mortality, especially in migration corridors, a risk mitigated by careful placement and operational curtailment.
Human Health and Social Impacts
Communities near wind farms benefit from job creation, tax revenue, and reduced air‑pollution health risks. Some studies (Health Effects Institute, 2020) note low‑frequency noise concerns, but systematic reviews find no consistent evidence of adverse health outcomes when turbines meet recommended setback distances.
Economic and Infrastructure Impacts
Annual megawatt output directly influences revenue streams for project developers and local governments. Higher capacity factors improve levelized cost of electricity (LCOE), making wind competitive with conventional power in many regions. Grid integration may require transmission upgrades, especially for offshore farms, representing a capital cost that must be weighed against long‑term climate benefits.
Regional Differences
Wind resources vary dramatically. The European North Sea and Atlantic coasts average wind speeds of 9‑10 m/s, supporting offshore turbines with CFs above 50% (European Environment Agency, 2022). In contrast, interior U.S. Midwest sites average 6‑7 m/s, yielding on‑shore CFs around 30%. Tropical islands often face lower, more variable winds, limiting annual megawatt output unless offshore floating platforms are employed. These regional patterns shape national energy strategies and investment decisions.
What Scientists Know With High Confidence
- Wind energy conversion follows the cubic wind‑speed relationship, a well‑established physical law.
- Capacity factor is the most reliable single metric for estimating annual output.
- Modern on‑shore turbines typically achieve 30‑35% CF; offshore turbines regularly exceed 45%.
- Wind electricity generation displaces fossil‑fuel generation and reduces lifecycle CO₂ emissions.
What Remains Uncertain
Key uncertainties include future changes in wind patterns due to climate change, which could alter regional capacity factors by ±5‑10% over the next few decades. Data gaps also exist for emerging offshore and floating turbine technologies, where long‑term performance records are limited. Improved high‑resolution wind modeling and expanded monitoring networks will reduce these uncertainties.
Common Misconceptions
Misconception: A turbine’s name‑plate rating equals its yearly output.
Reality: The name‑plate rating is a peak power value; actual annual generation depends on the capacity factor, which is usually well below 100%.
Misconception: All wind farms produce the same amount of electricity per megawatt installed.
Reality: Annual megawatt output varies with wind resource quality, turbine height, and maintenance practices, leading to a 20‑50% range in production per installed MW.
Misconception: Higher megawatt output always means higher environmental impact.
Reality: While larger turbines require more material, their higher capacity factors often result in lower lifecycle emissions per unit of electricity generated.
Solutions and Limitations
Improving annual megawatt production centers on three technical pathways:
- Increasing hub height and rotor diameter: Captures stronger winds, but raises material costs and may increase visual or avian impacts.
- Optimizing turbine placement with high‑resolution wind mapping: Boosts capacity factor, yet requires extensive data collection and can face land‑use conflicts.
- Deploying offshore and floating turbines: Offers the highest wind speeds, but entails higher capital expenditures and complex grid connections.
Each approach must balance economic feasibility, environmental trade‑offs, and social acceptance.
What Individuals, Communities, and Governments Can Do
What Individuals Can Do
Support policies that fund wind resource assessments and incentivize low‑impact siting. Choose electricity suppliers that source power from wind farms with high capacity factors.
What Communities and Organizations Can Do
Engage in local planning processes to ensure wind projects are sited where wind speeds are optimal and ecological risks are minimized. Community‑owned wind cooperatives can share revenue and increase public acceptance.
What Governments Can Do
Invest in offshore transmission infrastructure, streamline permitting for high‑capacity offshore farms, and fund research on floating turbine technology. Establish clear setback and wildlife protection guidelines to mitigate negative impacts.
Closing Synthesis
Understanding how many megawatts wind turbines can produce each year requires linking turbine design, wind resource quality, and capacity factor. Robust evidence shows that modern turbines convert wind into reliable, low‑carbon electricity, with on‑shore farms typically delivering 30‑35% capacity factors and offshore farms exceeding 45%. Uncertainties remain around future wind‑pattern shifts and the long‑term performance of emerging offshore technologies. By prioritizing high‑quality siting, continued technological innovation, and supportive policy frameworks, societies can maximize wind’s contribution to a sustainable energy future.
Frequently Asked Questions
How is the annual megawatt output of a wind turbine calculated?
Annual output is calculated by multiplying the turbine’s rated capacity (MW) by the total hours in a year (8,760) and then by its capacity factor, which reflects real‑world wind conditions.
What is a capacity factor and why does it matter?
A capacity factor is the ratio of actual electricity generated to the maximum possible if the turbine ran at full power all year; it determines how much of the rated capacity is realized in practice.
Do offshore wind turbines produce more electricity than on‑shore turbines?
Yes, offshore turbines typically experience higher and more consistent wind speeds, achieving capacity factors of 40‑55% compared with 30‑35% for most on‑shore installations.
What are the main uncertainties affecting yearly megawatt estimates?
Key uncertainties include future changes in wind patterns due to climate change, limited long‑term data for new offshore and floating technologies, and variations in local wind resource measurements.
How can individuals support higher wind energy production?
Individuals can back policies that fund wind resource studies, choose electricity suppliers that source power from high‑capacity‑factor wind farms, and advocate for community‑owned wind projects.





Leave a Comment