
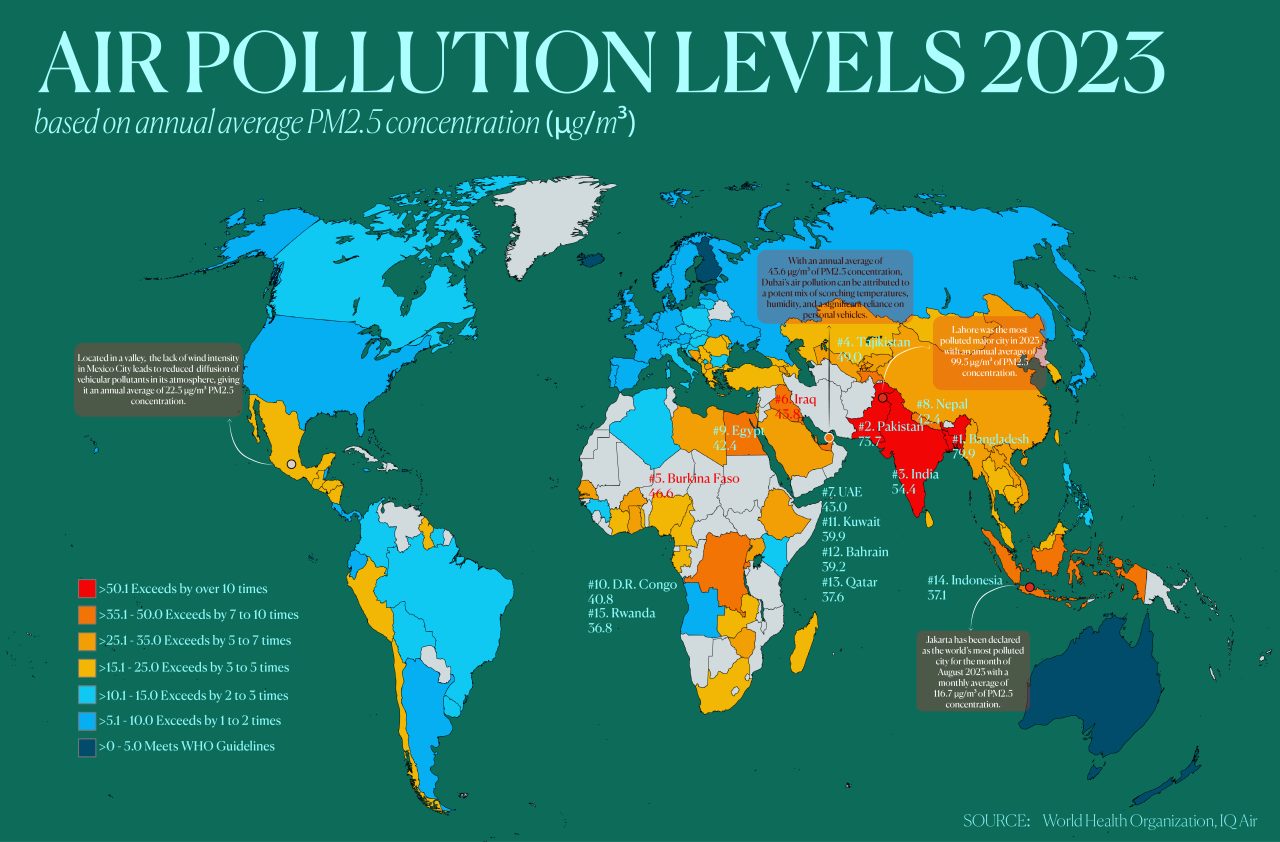
Global air pollution levels, measured through pollutants such as particulate matter and ozone, remain above health‑based guidelines in most regions, posing significant risks to ecosystems and human well‑being.
Quick Answer
Global air pollution refers to the concentration of harmful gases and particles—most notably fine particulate matter (PM2.5), coarse particles (PM10), nitrogen oxides (NOx), sulfur dioxide (SO₂), carbon monoxide (CO), and ground‑level ozone (O₃)—averaged across the planet’s atmosphere. Monitoring networks and satellite retrievals show that the 2019 global mean PM2.5 concentration was about 44 µg m⁻³, far exceeding the World Health Organization’s 2021 guideline of 5 µg m⁻³. The evidence is strong that elevated pollution contributes to respiratory and cardiovascular disease, ecosystem degradation, and climate warming, though exact future trends depend on policy actions and economic pathways.
Key Takeaways
- Since 2010, more than 99 % of the world’s population lives in areas where PM2.5 exceeds WHO health‑based limits.
- Satellite and ground‑based data converge on a global average PM2.5 of ~44 µg m⁻³ for 2019, while ozone levels regularly surpass the 100 ppb threshold that can impair lung function.
- Major sources include fossil‑fuel combustion, industrial processes, biomass burning, and residential heating, with regional hotspots in South‑Asia, East‑Asia, and parts of Africa.
- Health impacts are strongest for children, the elderly, and low‑income communities that often reside near pollution sources.
- Effective solutions combine stricter regulations, clean‑energy transitions, improved public transport, and real‑time monitoring, but each faces economic and equity trade‑offs.
What Is Global Air Pollution Levels Explained: What the Latest Studies Show?
Global air pollution levels quantify the average concentration of air‑borne pollutants across the Earth’s surface and atmosphere. The term encompasses both primary pollutants—emitted directly from sources such as traffic, power plants, and wildfires—and secondary pollutants that form through atmospheric chemistry, notably ozone. Measurements are expressed in mass per volume (µg m⁻³) for particles and parts per billion (ppb) for gases. Understanding these levels is crucial because they influence climate, ecosystem health, and public health worldwide.
How Does It Work?
Emission Sources and Atmospheric Transport
1. Primary emissions release gases and particles directly into the lower troposphere. 2. Atmospheric transport carries pollutants across borders via wind patterns, allowing distant sources to affect local air quality. 3. Photochemical reactions between nitrogen oxides (NOx) and volatile organic compounds (VOCs) under sunlight produce ground‑level ozone. 4. Secondary particle formation occurs when gases such as SO₂ and NOx undergo oxidation, forming sulfates and nitrates that contribute to PM2.5. 5. Deposition and removal happen through wet (rain) and dry (settling) processes, returning pollutants to land or ocean surfaces.
Monitoring and Data Integration
Ground‑based monitoring stations, operated by agencies like the U.S. Environmental Protection Agency (EPA) and the European Environment Agency (EEA), provide high‑frequency concentration data. Satellite sensors (e.g., NASA’s MODIS and ESA’s Sentinel‑5P) retrieve column‑integrated aerosol optical depth and trace‑gas concentrations, which are calibrated against surface observations. Integrated assessment models, such as those used by the Intergovernmental Panel on Climate Change (IPCC), combine emissions inventories, meteorology, and chemistry to estimate global averages and future scenarios.
What Does the Evidence Show?
Long‑term monitoring compiled in the WHO Global Ambient Air Quality Database (2021) indicates that worldwide average PM2.5 levels have remained relatively stable since the early 2010s but are still three to nine times higher than the recommended guideline. A systematic review published in The Lancet Planetary Health (2022) linked exposure to PM2.5 with an estimated 4.2 million premature deaths annually, a figure corroborated by the Global Burden of Disease study. Satellite‑derived analyses (e.g., NASA’s OMI data) reveal that ground‑level ozone has increased in many subtropical regions, consistent with warming temperatures reported by the IPCC AR6. Together, these lines of evidence demonstrate a persistent, health‑threatening pollution burden that is unevenly distributed.
Main Causes or Drivers
Direct Human Sources
- Combustion of coal, oil, and gas for electricity and heat (accounting for ~30 % of global PM2.5 emissions, UNEP 2022).
- Road traffic, especially diesel engines, emitting NOx, CO, and ultrafine particles.
- Industrial processes such as cement production and metal smelting releasing SO₂ and heavy metals.
- Residential biomass burning for cooking and heating, a primary source in low‑income regions.
Underlying Drivers
- Rapid urbanization increasing vehicle density and energy demand.
- Economic growth patterns that prioritize fossil‑fuel infrastructure.
- Regulatory gaps and enforcement challenges, particularly in developing nations.
- Climate‑induced changes, such as higher temperatures that accelerate ozone formation.
Environmental and Human Impacts
Environmental Impacts
Fine particles act as cloud condensation nuclei, altering cloud albedo and precipitation patterns—a feedback loop identified in IPCC assessments. Acidic deposition from SO₂ and NOx harms soils, freshwater bodies, and forest ecosystems, reducing biodiversity. Ozone at ground level impairs photosynthesis, decreasing crop yields by up to 10 % in heavily polluted regions (FAO, 2020).
Human Health and Social Impacts
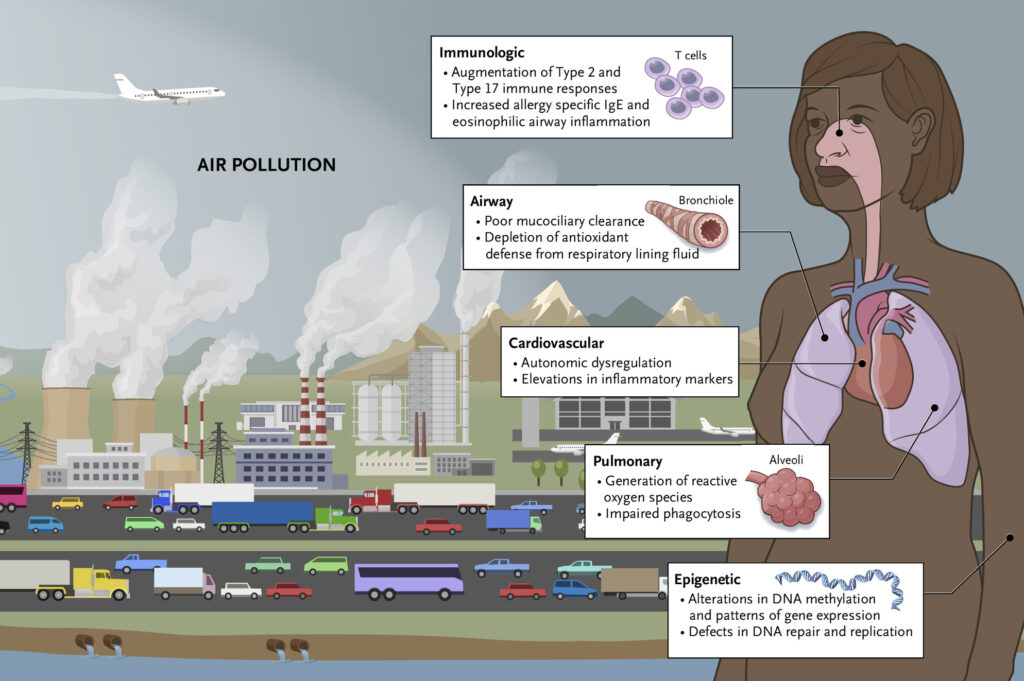
Exposure to PM2.5 and ozone is associated with increased incidence of asthma, chronic obstructive pulmonary disease, stroke, and lung cancer. Vulnerable groups—children, the elderly, and low‑income communities near industrial zones—experience higher exposure and lower access to healthcare. The World Bank estimates that premature mortality from air pollution costs the global economy roughly $5 trillion per year in lost labor and health expenditures.
Economic and Infrastructure Impacts
Air‑quality emergencies lead to temporary school closures, reduced outdoor work productivity, and increased healthcare utilization. In megacities, smog events can trigger travel delays and strain energy grids as cooling demand rises.
Regional Differences
South‑Asia, particularly India and Pakistan, records the highest annual average PM2.5 concentrations—often exceeding 100 µg m⁻³—driven by traffic, coal power, and agricultural residue burning. East‑Asia, especially northern China, has seen improvements after aggressive clean‑air policies, yet still experiences seasonal PM spikes. In contrast, many European Union cities now average below 15 µg m⁻³, reflecting stringent emission standards. Sub‑Saharan Africa displays limited monitoring, but satellite data suggest growing pollution from urbanization and biomass use.
What Scientists Know With High Confidence
- Elevated PM2.5 exposure is causally linked to increased mortality and cardiovascular disease (multiple cohort studies, WHO).
- Ground‑level ozone formation is temperature‑dependent, meaning climate warming will likely raise ozone concentrations in many regions (IPCC AR6).
- Regulatory actions—such as the U.S. Clean Air Act amendments and EU Air Quality Directive—have demonstrably reduced concentrations of SO₂, NOx, and lead.
- Satellite observations reliably capture large‑scale trends in aerosol loading and trace‑gas concentrations when calibrated with surface stations.
What Remains Uncertain
Key uncertainties include the precise health impact of ultrafine particles (<0.1 µm), the long‑term effectiveness of emerging low‑carbon technologies in reducing secondary aerosol formation, and the extent to which future socioeconomic pathways will alter emission trajectories. Limited ground‑level monitoring in low‑income regions hampers accurate assessment of local exposure, making it difficult to fully quantify health burdens in those areas.
Common Misconceptions
Misconception: “Air pollution is only a problem in developing countries.”
Reality: While many low‑income regions face severe pollution, high‑income nations also experience hazardous episodes, especially in urban centers and during wildfire seasons. Moreover, transboundary transport can carry pollutants across continents.
Misconception: “Only fine particles (PM2.5) matter for health.”
Reality: Coarse particles (PM10), ozone, nitrogen dioxide, and sulfur dioxide each have documented health effects. The combined exposure—often termed “multi‑pollutant risk”—can be more harmful than any single pollutant alone.
Misconception: “Switching to electric cars instantly eliminates air‑pollution problems.”
Reality: Electric vehicles reduce tail‑pipe emissions but still rely on electricity generation; if the grid is fossil‑fuel‑heavy, overall emissions may shift rather than disappear. Lifecycle analyses show that substantial benefits arise when the electricity mix becomes cleaner.
Solutions and Limitations
Effective responses fall into three broad categories:
- Prevention and Regulation: Implementing stricter emission standards for industry and transport, as exemplified by the EU’s 2021 Ambient Air Quality Directive. Limitations include enforcement costs and potential economic resistance.
- Technological and Infrastructure Shifts: Deploying renewable energy, upgrading to low‑NOx combustion, and expanding electric‑public‑transport fleets. Trade‑offs involve high upfront capital and the need for grid modernization.
- Nature‑Based and Behavioral Approaches: Urban greening, promoting active transport, and encouraging reduced residential biomass use. These actions provide co‑benefits for heat mitigation and biodiversity but may be limited by land availability and cultural practices.
What Individuals, Communities, and Governments Can Do
What Individuals Can Do
- Monitor local air quality using free apps linked to governmental sensors.
- Limit outdoor activity during high‑pollution alerts, especially for children and older adults.
- Adopt energy‑efficient appliances and reduce reliance on solid fuels for cooking.
- Support policies and candidates that prioritize clean‑energy legislation.
What Communities and Organizations Can Do
- Establish low‑emission zones and promote car‑free days.
- Invest in community‑owned renewable energy projects.
- Organize citizen‑science monitoring networks to fill data gaps.
- Provide public education campaigns on indoor air quality and ventilation.
What Governments Can Do
- Enforce and regularly update national ambient air quality standards aligned with WHO guidelines.
- Phase out coal plants and subsidize clean‑energy alternatives.
- Allocate funding for expanded monitoring, especially in underserved regions.
- Integrate air‑quality considerations into urban planning, transportation, and climate‑mitigation policies.
Synthesis
The latest scientific assessments make clear that global air pollution remains a pervasive, health‑threatening problem, driven largely by fossil‑fuel combustion, industrial activity, and biomass burning. Robust evidence links fine particulate matter and ozone to premature mortality and ecosystem damage, while uncertainties persist around ultrafine particles and future emission pathways. Solutions that combine stringent regulation, clean‑energy transitions, and community engagement offer the most credible path forward, though each carries economic and equity considerations. Continued monitoring, especially in data‑sparse regions, will be essential to track progress and protect public health for generations to come.
Frequently Asked Questions
What is meant by “global air pollution levels”?
Global air pollution levels refer to the average concentrations of pollutants such as PM2.5, PM10, ozone, NOx, SO₂, and CO measured across the Earth’s atmosphere, using ground stations and satellite data to assess overall air‑quality conditions.
Which pollutants are most harmful to human health?
Fine particulate matter (PM2.5) and ground‑level ozone are considered the most harmful, with strong evidence linking PM2.5 to premature deaths and ozone to respiratory problems; NO₂, SO₂, and coarse particles (PM10) also pose significant health risks.
How do scientists measure and monitor air pollution worldwide?
Scientists combine data from national monitoring networks (e.g., EPA, EEA) with satellite observations (NASA MODIS, ESA Sentinel‑5P) and integrate them into atmospheric models to produce consistent, global estimates of pollutant concentrations.
What are the biggest regional differences in air pollution?
South‑Asia experiences the highest PM2.5 levels, often above 100 µg m⁻³, due to traffic, coal power, and crop‑residue burning; East‑Asia shows improvement after strict policies but still has seasonal spikes; many European cities now stay below 15 µg m⁻³, while monitoring gaps remain in Sub‑Saharan Africa.
What actions can individuals take to reduce personal exposure to air pollution?
Individuals can check real‑time air‑quality indexes, limit outdoor activities during high‑pollution alerts, use energy‑efficient appliances, avoid solid‑fuel cooking, and support clean‑energy policies through voting and community involvement.








Leave a Comment