

What Are Climate Indicators?
Climate indicators are quantifiable measurements that capture the state of Earth’s climate system over time. They translate complex physical processes—such as heat transfer, water cycles, and atmospheric chemistry—into data points that scientists can track, compare, and interpret. By monitoring a suite of indicators, researchers can detect trends, assess impacts, and evaluate the effectiveness of mitigation and adaptation strategies.
Why Climate Indicators Matter
Understanding how the planet is changing is essential for policymakers, businesses, and the public. Indicators provide the evidence base for international agreements, national climate policies, and local resilience planning. They also help separate natural variability from human‑driven change, informing climate attribution studies and guiding investment in clean technologies.
Historical Foundations of Climate Measurement
The systematic observation of climate began in the 17th century with the first thermometers and rain gauges. Over the centuries, networks expanded:
- 19th‑century temperature stations laid the groundwork for global temperature series.
- Early 20th‑century ship logs supplied sea‑surface temperature data across the oceans.
- Mid‑20th‑century radiosonde balloons introduced vertical profiles of temperature, humidity, and pressure.
- Late 20th‑century satellite era revolutionized coverage, delivering continuous observations of sea level, ice extent, and atmospheric composition.
These historic records are the backbone of modern climate indicators, allowing scientists to construct continuous timelines that stretch back more than a century.
Core Categories of Climate Indicators
Climate scientists organize indicators into several interrelated groups. Each group captures a distinct facet of the climate system.
1. Surface Temperature Indicators
Surface temperature is the most widely recognized indicator of global warming. It includes:
- Land‑based temperature records from weather stations and automated sensors.
- Sea‑surface temperature (SST) datasets derived from ships, buoys, and satellites.
- Global temperature anomalies expressed as deviations from a baseline period (usually 1951‑1980 or 1981‑2010).
Data are compiled by agencies such as NASA’s GISS, NOAA’s GlobalTemp, and the UK Met Office’s HadCRUT. Long‑term trends show a clear upward trajectory of roughly 0.18 °C per decade since the 1970s.
2. Precipitation and Hydrological Indicators
Changes in rainfall patterns affect water security, agriculture, and flood risk. Key indicators include:
- Global average precipitation derived from rain gauges, radar, and satellite microwave sensors.
- Regional drought indices such as the Palmer Drought Severity Index (PDSI) and Standardized Precipitation‑Evapotranspiration Index (SPEI).
- River discharge trends measured at major gauging stations worldwide.
These metrics reveal a “wet‑get‑wetter, dry‑get‑drier” pattern in many mid‑latitude regions, while the tropics experience intensified rainfall events.
3. Sea Level Rise
Sea level is a cumulative indicator of thermal expansion, melting ice, and changes in land water storage. Measurements come from:
- Tide‑gauge networks that have recorded local sea level for over a century.
- Satellite altimetry (e.g., TOPEX/Poseidon, Jason‑3) providing global mean sea‑level estimates with millimetre precision.
The current rate of global mean sea‑level rise is about 3.3 mm per year, accelerating compared with the 20th‑century average of 1.5 mm per year.
4. Cryosphere Indicators
The cryosphere encompasses all frozen water components—glaciers, ice sheets, sea ice, and permafrost. Important indicators are:
- Glacier mass balance measured by field surveys and satellite gravimetry (GRACE).
- Arctic sea‑ice extent tracked by passive microwave sensors (e.g., NSIDC).
- Antarctic ice‑sheet contribution to sea‑level rise, derived from satellite laser altimetry (ICESat‑2).
- Permafrost temperature monitored by borehole networks.
Since the late 1970s, Arctic sea‑ice minimum extent has declined by more than 40 %, and many mountain glaciers have retreated at unprecedented rates.
5. Ocean Heat Content
Oceans absorb over 90 % of excess Earth‑system heat, making ocean heat content (OHC) a critical indicator of energy imbalance. OHC is calculated from:
- Argo float profiles that measure temperature and salinity down to 2000 m.
- Deep‑ocean observations from ship‑based CTD casts.
Since 2000, the upper 2000 m of the global ocean has warmed by roughly 0.3 °C, representing a massive heat reservoir that drives sea‑level rise and influences weather patterns.
6. Atmospheric Greenhouse‑Gas Concentrations
Greenhouse gases (GHGs) trap infrared radiation, amplifying warming. The most tracked gases are carbon dioxide (CO₂), methane (CH₄), and nitrous oxide (N₂O). Indicators include:
- Mauna Loa CO₂ record—the longest continuous measurement of atmospheric CO₂, showing concentrations above 420 ppm in 2023.
- Global GHG mixing ratios from the World Data Centre for Greenhouse Gases.
- Isotopic signatures that help differentiate fossil‑fuel emissions from natural sources.
The rise in CO₂ alone accounts for roughly two‑thirds of the radiative forcing driving recent warming.
7. Carbon Cycle and Flux Indicators
The carbon cycle links sources (e.g., fossil‑fuel combustion, land‑use change) with sinks (e.g., forests, oceans). Key indicators are:
- Global carbon budget tables that balance emissions, land‑use fluxes, and atmospheric growth.
- Net ecosystem exchange (NEE) measured by eddy‑covariance towers.
- Oceanic CO₂ uptake derived from surface water pCO₂ observations.
Since 2000, terrestrial and oceanic sinks have absorbed about half of anthropogenic CO₂ emissions, but their capacity may be declining.
8. Extreme‑Weather Frequency and Intensity
Changes in the occurrence of heatwaves, hurricanes, floods, and droughts provide a direct link between climate change and societal impacts. Indicators include:
- Heat‑wave duration index (HWDI) tracking consecutive days above temperature thresholds.
- Maximum wind speed of tropical cyclones from best‑track datasets.
- Heavy‑precipitation event frequency derived from gauge networks and satellite rainfall estimates.
Statistical analyses show that heat‑wave intensity has increased by about 0.5 °C per decade in many regions, while the proportion of Category 4‑5 hurricanes has risen modestly.
9. Phenology and Ecosystem Indicators
Phenology records the timing of biological events—leaf‑out, flowering, migration—that respond sensitively to temperature and precipitation. Data sources include:
- Citizen‑science platforms such as Nature’s Calendar and iNaturalist.
- Long‑term ecological research (LTER) plots.
On average, spring events in the Northern Hemisphere now occur 2‑5 days earlier than in the 1950s, a clear signal of warming.
10. Satellite‑Based Radiative‑Balance Indicators
Satellites measure the Earth’s energy budget directly, offering a top‑down view of climate change:
- Outgoing longwave radiation (OLR) and reflected shortwave radiation (RSR) from instruments like CERES.
- Top‑of‑atmosphere (TOA) net flux anomalies that indicate whether the planet is gaining or losing energy.
Positive TOA net fluxes confirm that the Earth system is accumulating heat, consistent with rising OHC and surface temperatures.
How Scientists Combine Indicators into a Coherent Picture
Individual indicators tell part of the story; together they reveal the full climate narrative. Researchers use several approaches to synthesize data:
Multi‑Indicator Indices
Indices such as the Global Climate Change Index or the Climate Risk Index aggregate temperature, precipitation, and extreme‑event metrics into a single score that can be tracked over time.
Attribution Studies
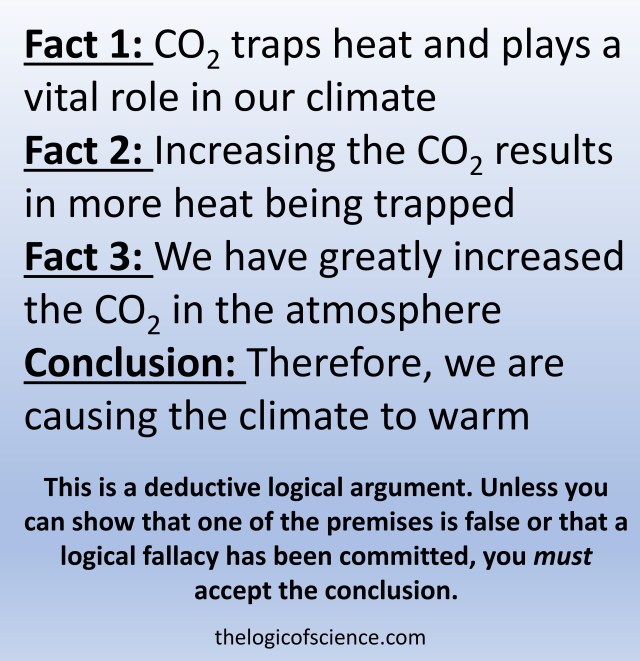
By comparing observed indicator trends with outputs from climate models that include or exclude human influences, scientists can attribute changes to specific drivers. For example, the increase in atmospheric CO₂ and the concurrent rise in global temperature are linked through radiative‑forcing calculations.
Coupled Climate Models
General circulation models (GCMs) simulate the interaction of atmosphere, ocean, land, and ice. Model outputs are validated against observed indicators—such as sea‑level rise and Arctic sea‑ice extent—to assess model fidelity. Successful models are then used to project future indicator trajectories under different emission scenarios (e.g., SSP1‑2.6, SSP5‑8.5).
Data Assimilation Techniques
Advanced statistical methods merge observations with model predictions, producing reanalysis datasets (e.g., ERA5, MERRA‑2) that provide a physically consistent, gridded view of the climate system. These reanalyses serve as reference baselines for many indicators.
Benefits of Robust Climate Indicators
Accurate indicators deliver several tangible advantages:
- Policy Guidance: Nations rely on indicator trends to set emission targets, design adaptation plans, and report progress under the Paris Agreement.
- Risk Management: Insurance and finance sectors use extreme‑weather indicators to price risk and allocate capital.
- Public Communication: Clear, visualizable metrics (e.g., CO₂ concentration graphs) help convey climate realities to non‑specialists.
- Scientific Insight: Indicators highlight feedback mechanisms—such as ice‑albedo feedback—that are critical for understanding future trajectories.
Challenges and Uncertainties
Despite their power, climate indicators face several limitations:
- Spatial Coverage Gaps: Remote regions like the high Arctic or deep ocean have sparse observations, leading to higher uncertainty.
- Instrumental Biases: Changes in measurement techniques (e.g., satellite sensor drift) require careful homogenization.
- Natural Variability: Decadal oscillations (e.g., El Niño‑Southern Oscillation) can mask long‑term trends, demanding sophisticated statistical separation.
- Attribution Complexity: Multiple interacting drivers (land‑use change, aerosols) can produce similar indicator signals, complicating cause‑and‑effect statements.
Addressing these challenges involves expanding observation networks, improving calibration protocols, and investing in data‑sharing platforms.
Future Directions in Climate Indicator Science
Emerging technologies promise to sharpen our view of a changing planet.
1. Next‑Generation Satellite Constellations
Small‑sat constellations will deliver higher spatial and temporal resolution for temperature, moisture, and greenhouse‑gas columns, reducing data gaps over oceans and developing regions.
2. Artificial‑Intelligence Analytics
Machine‑learning algorithms can detect subtle patterns across disparate indicator datasets, improving early‑warning systems for heatwaves and rapid ice loss.
3. Citizen‑Science Expansion
Mobile apps and low‑cost sensors enable volunteers to contribute ground‑truth data for phenology, air quality, and micro‑climate observations, enriching indicator networks.
4. Integrated Assessment Platforms
Web‑based portals that combine climate indicators with socioeconomic data (e.g., population density, infrastructure) will aid decision‑makers in evaluating climate‑risk exposure.
Practical Guidance: How to Use Climate Indicators
Whether you are a researcher, educator, or community planner, the following steps can help you incorporate indicators into your work:
- Identify the Relevant Indicators based on your geographic focus and sector (e.g., sea‑level rise for coastal planning).
- Access Reliable Data Sources such as NASA’s Earthdata, NOAA’s Climate.gov, or the World Data Centre for Greenhouse Gases.
- Check Data Quality by reviewing metadata, homogenization methods, and uncertainty estimates.
- Analyze Trends using statistical tools (linear regression, Mann‑Kendall test) to discern long‑term signals.
- Communicate Findings with clear visualizations—time‑series graphs, heat‑maps, and infographics—tailored to your audience.
By following this workflow, you can turn raw indicator data into actionable insights.
Conclusion
Climate indicators are the measurement backbone that turns Earth’s complex, interlinked processes into understandable, actionable information. From surface temperature and greenhouse‑gas concentrations to sea‑level rise and extreme‑weather frequency, each indicator tells a piece of the story of a warming planet. Together, they enable scientists to attribute change, guide policy, and empower communities to adapt. As observation technologies advance and data analytics grow more sophisticated, these indicators will become even more precise, ensuring that humanity can track, understand, and ultimately respond to the planet’s evolving climate.
Frequently Asked Questions
What are the main types of climate indicators used by scientists?
Scientists track temperature, precipitation, sea level, ice extent, ocean heat content, greenhouse‑gas concentrations, carbon‑cycle fluxes, extreme‑weather frequency, phenology, and satellite‑based radiative‑balance metrics.
How is global sea‑level rise measured today?
Sea‑level rise is measured using a combination of century‑long tide‑gauge records and modern satellite altimetry, which together show an accelerating rise of about 3.3 mm per year.
Why is the Mauna Loa CO₂ record important?
The Mauna Loa record is the longest continuous measurement of atmospheric CO₂, providing a clear benchmark that shows concentrations surpassing 420 ppm, a key driver of radiative forcing.
What role do satellite observations play in climate indicator science?
Satellites deliver global, consistent data on temperature, ice cover, sea level, greenhouse‑gas columns, and Earth’s energy budget, filling gaps where ground stations are sparse.
How can communities use climate indicators for adaptation planning?
Communities can select relevant indicators (e.g., heat‑wave duration or flood frequency), analyze local trends, and integrate the results into risk assessments, infrastructure design, and emergency‑response strategies.




Leave a Comment