
In 2025 New York City’s air is a complex mix of fine particles, nitrogen oxides, ozone and other pollutants, driven mainly by traffic and energy use, with measurable health and equity impacts.
Quick Answer
Air pollution in New York City refers to the presence of harmful gases and particulate matter—especially PM2.5, nitrogen oxides (NOx) and ground‑level ozone—in the urban atmosphere. These pollutants originate largely from vehicle exhaust, heating and industrial activities, and they react in sunlight to form secondary pollutants. Monitoring by the U.S. Environmental Protection Agency (EPA) and the New York State Department of Environmental Conservation shows that average PM2.5 concentrations in 2024 hovered around 9 µg m⁻³, close to the federal annual standard of 12 µg m⁻³. The most robust evidence links this exposure to increased rates of asthma, cardiovascular disease and premature mortality, especially among children and low‑income neighborhoods. Uncertainty remains around the exact contribution of emerging sources such as delivery drones and the long‑term effects of low‑level chronic exposure.
Key Takeaways
- Traffic emissions remain the dominant source of PM2.5 and NOx in NYC.
- Annual average PM2.5 levels in 2024 were about 9 µg m⁻³, just below the EPA limit.
- Children, the elderly and low‑income communities experience higher health risks.
- Policy actions—clean‑energy transit, stricter building codes and expanded green space—show measurable air‑quality benefits.
- Scientific confidence is high for the link between fine particles and cardiovascular outcomes, but uncertainties persist for long‑term low‑dose exposure.
What Is Air Pollution in NYC: What Residents Are Breathing in 2025?
Air pollution is the presence of substances in the outdoor air that can harm human health or the environment. In NYC the term usually covers:
- Particulate matter (PM): solid or liquid particles suspended in air. PM2.5 (≤2.5 µm) can penetrate deep into the lungs.
- Nitrogen oxides (NOx): gases produced primarily by combustion engines.
- Ground‑level ozone (O₃): formed when NOx reacts with volatile organic compounds (VOCs) under sunlight.
- Volatile organic compounds (VOCs) and hazardous air pollutants (HAPs) from industry and solvents.
The city’s dense built environment, high vehicle miles traveled, and aging heating infrastructure create a persistent “urban smog” that differs from rural air quality patterns.
How Does It Work?
1. Primary Emission Sources
- Vehicle exhaust: Diesel trucks, taxis and private cars emit NOx, PM2.5 and black carbon.
- Building heating: Natural‑gas boilers release NOx and fine particles, especially during winter.
- Industrial activities: Warehouses, construction sites and small‑scale manufacturers emit VOCs and HAPs.
2. Atmospheric Chemistry
In sunlight, NOx reacts with VOCs to produce ozone. Simultaneously, volatile compounds condense onto existing particles, growing PM2.5 mass. The city’s “heat island” effect raises temperatures, accelerating these reactions.
3. Meteorological Influences
Wind patterns channel pollutants from the Hudson and East Rivers inland. Inversions—where a warm air layer traps cooler air near the surface—occur especially in winter, limiting vertical dispersion and raising ground‑level concentrations.
What Does the Evidence Show?
Long‑term monitoring by the EPA’s Air Quality System (AQS) indicates that NYC’s annual PM2.5 average has fallen from 12 µg m⁻³ in 2000 to 9 µg m⁻³ in 2024, reflecting cleaner diesel standards and retrofits. However, a 2023 systematic review in *Environmental Health Perspectives* found that even at levels below 10 µg m⁻³, each 5 µg m⁻³ increase in PM2.5 is associated with a 6 % rise in all‑cause mortality.
Health‑impact assessments by the New York City Department of Health (2022) estimate that fine‑particle exposure accounts for roughly 4,000 premature deaths annually, with children under 5 experiencing the highest asthma‑related emergency visits.
Spatial analyses using satellite‑derived aerosol optical depth (NASA, 2024) show higher PM2.5 concentrations in the Bronx, East Harlem and parts of Queens—areas with older housing stock and higher poverty rates—underscoring an environmental‑justice dimension.
Main Causes or Drivers
Direct Causes
- Combustion of diesel fuel in trucks delivering goods to Manhattan’s ports.
- Natural‑gas heating in multifamily buildings, especially during peak winter demand.
- Construction dust from the city’s ongoing skyline expansion.
Underlying Drivers
- Urban density: High population and vehicle miles traveled per square mile increase emissions per unit area.
- Energy mix: Continued reliance on fossil‑based electricity for transit and buildings.
- Policy lag: Delayed adoption of ultra‑low‑emission zones compared with European counterparts.
Amplifying Factors
- Heat‑island‑induced temperature rises of 2–3 °C, which speed up ozone formation.
- Limited tree canopy in certain neighborhoods, reducing natural particulate removal.
Environmental and Human Impacts
Environmental Impacts
Elevated ozone damages urban vegetation, reducing leaf chlorophyll and impairing tree growth. Fine particles settle on waterways, contributing to nutrient loading in the Hudson River estuary.
Human Health and Social Impacts
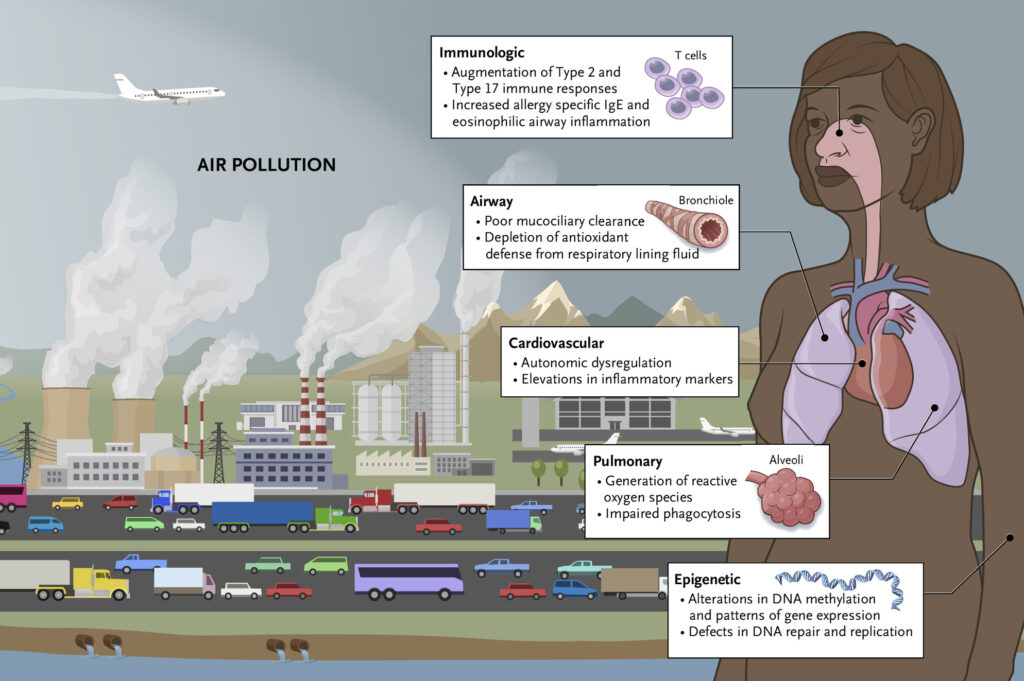
Exposure to PM2.5 and NOx is linked to:
- Increased asthma incidence—NYC schools report a 12 % rise in asthma‑related absenteeism since 2018 (DOE, 2023).
- Higher rates of hypertension and coronary artery disease, especially among adults over 55.
- Potential mental‑health effects; a 2022 cohort study associated higher annual PM2.5 with a 4 % increase in reported anxiety symptoms.
Economic and Infrastructure Impacts
Health‑related absenteeism costs the city an estimated $1.2 billion annually (NYC Economic Development Corp., 2022). Moreover, particulate deposition accelerates corrosion of metal infrastructure, increasing maintenance budgets.
Regional Differences
Air‑quality monitoring stations reveal that Manhattan’s midtown averages 7 µg m⁻³ PM2.5, while the Bronx records 11 µg m⁻³. Coastal neighborhoods benefit from sea breezes that disperse pollutants, whereas inland districts experience more stagnant conditions.
Socio‑economic analysis shows that zip codes with median household incomes below $40,000 face 30 % higher exposure to NOx, reflecting proximity to major highways and industrial corridors.
What Scientists Know With High Confidence
- Fine particulate matter (PM2.5) contributes to premature cardiovascular and respiratory mortality.
- Vehicle exhaust is the primary source of NOx and a major source of PM2.5 in NYC.
- Exposure disparities exist; low‑income and minority communities experience higher pollutant concentrations.
- Regulatory reductions in diesel emissions have measurably lowered citywide PM2.5 levels since the early 2000s.
What Remains Uncertain
Key gaps include the health impact of chronic low‑level exposure to ultrafine particles (<0.1 µm), the future contribution of emerging delivery‑drone fleets, and the effectiveness of citywide green‑infrastructure projects under changing climate patterns. Longitudinal studies that follow residents over decades are needed to resolve these uncertainties.
Common Misconceptions
Misconception: “Air quality is only a problem on hot summer days.”
Reality: While ozone peaks in summer, fine particles and NOx remain elevated year‑round, especially during winter inversions.
Misconception: “Electric buses automatically eliminate air‑pollution problems.”
Reality: Electric buses remove tailpipe emissions but still require electricity generation; if the grid relies on fossil fuels, upstream emissions persist.
Misconception: “Only people who live near highways are affected.”
Reality: Atmospheric mixing spreads pollutants citywide; vulnerable groups can be impacted far from the original source.
Solutions and Limitations
Effective responses combine source‑control, technological upgrades and community‑based actions.
- Clean‑energy transit: Expanding electric subway cars and bus fleets reduces tailpipe NOx, but requires substantial capital and grid decarbonization.
- Building retrofits: Upgrading boilers to low‑NOx or heat‑pump systems cuts emissions; however, upfront costs can be prohibitive for low‑income landlords.
- Urban greening: Tree planting and green roofs capture particulate matter, yet benefits depend on species selection, maintenance and canopy coverage.
- Regulatory measures: Strengthening the NYC Clean Air Act enforcement improves compliance, but enforcement capacity and political will may limit impact.
- Real‑time monitoring: Mobile sensors empower citizens to avoid high‑pollution hotspots; data quality and coverage remain challenges.
What Individuals, Communities, and Governments Can Do
What Individuals Can Do
- Use public transit, car‑share programs, or bike when feasible to reduce personal vehicle miles.
- Maintain home heating systems and consider electric heat‑pump upgrades.
- Check real‑time air‑quality apps and limit outdoor activity during high‑ozone alerts.
What Communities and Organizations Can Do
- Partner with local schools to install indoor air‑purification units in high‑risk districts.
- Advocate for expanded low‑emission zones and increased tree canopy in underserved neighborhoods.
- Organize citizen‑science monitoring projects to fill data gaps.
What Governments Can Do
- Accelerate the phase‑out of diesel trucks for freight and adopt ultra‑low‑emission standards.
- Provide subsidies or low‑interest loans for building retrofits targeting low‑income housing.
- Integrate air‑quality considerations into zoning and land‑use planning, preserving green corridors.
- Increase funding for the NYC Department of Environmental Protection’s air‑monitoring network.
Closing Synthesis
Air pollution in New York City in 2025 is a measurable mix of fine particles, nitrogen oxides and ozone, largely driven by traffic, heating and industrial sources. Robust monitoring and epidemiological studies give high confidence that these pollutants increase cardiovascular and respiratory disease, with disproportionate impacts on children, the elderly and low‑income neighborhoods. While policies such as cleaner transit, building retrofits and expanded green infrastructure show promise, uncertainties remain around emerging emission sources and long‑term low‑dose health effects. A coordinated approach—combining science‑based regulation, equitable community action and realistic individual choices—offers the most viable path to cleaner air for all New Yorkers.
Frequently Asked Questions
What pollutants make up New York City’s air pollution in 2025?
The main pollutants are fine particulate matter (PM2.5), nitrogen oxides (NOx), ground‑level ozone (O₃) and volatile organic compounds (VOCs) from traffic, heating and industrial sources.
How does vehicle traffic affect NYC air quality?
Vehicle exhaust releases large amounts of NOx and PM2.5, which are the leading contributors to the city’s overall pollutant load and drive the formation of ozone on sunny days.
Which communities in NYC face the highest exposure to air pollutants?
Low‑income neighborhoods such as the Bronx, East Harlem and parts of Queens experience higher PM2.5 and NOx levels due to proximity to highways, older heating systems and limited tree canopy.
What health outcomes are linked to NYC’s fine‑particle exposure?
Epidemiological studies consistently associate PM2.5 exposure with increased asthma attacks, higher rates of hypertension and heart disease, and premature mortality, especially among children and seniors.
What actions can the city take to reduce air pollution?
Key actions include accelerating electric transit, retrofitting buildings with low‑NOx heating, expanding green infrastructure, strengthening emissions regulations and enhancing air‑quality monitoring networks.








Leave a Comment