
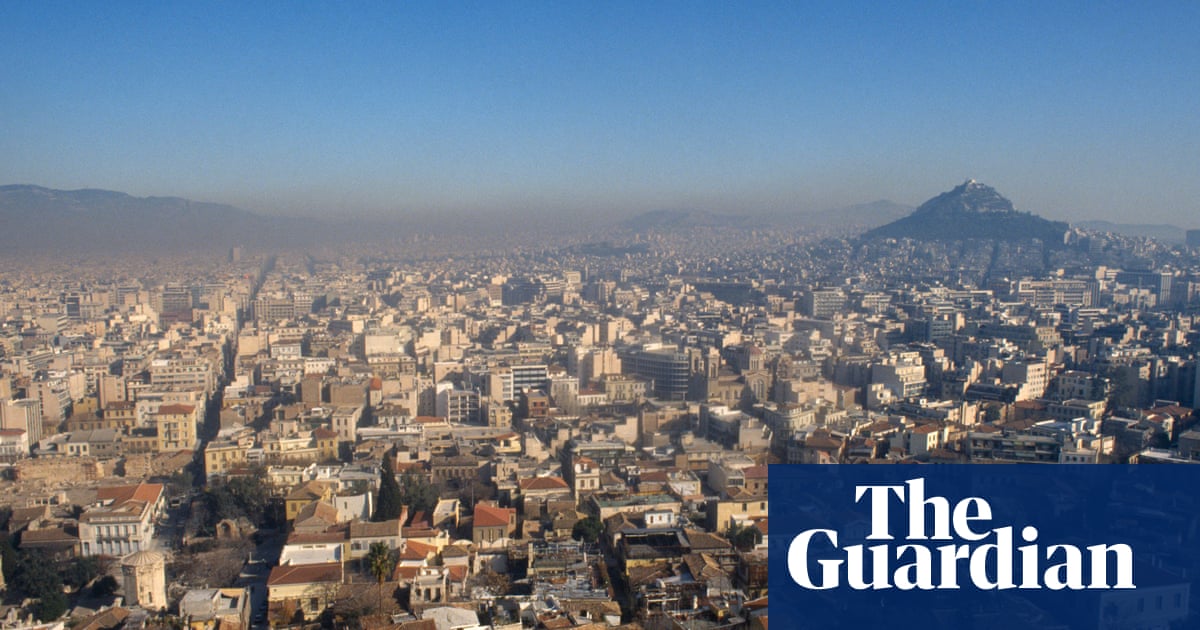
By 2025 an estimated 95% of Europeans are projected to live in areas where air‑pollution concentrations exceed health‑based limits, a situation that threatens public health, ecosystems and economic productivity across the continent.
Quick Answer
Air pollution exposure is measured against World Health Organization (WHO) guideline values for fine particulate matter (PM2.5) and nitrogen dioxide (NO2). Modelling by the European Environment Agency (EEA) for 2025 shows that 95% of the European population will reside in zones where annual PM2.5 averages exceed 10 µg m⁻³ or NO2 exceeds 40 µg m⁻³. The main drivers are urban traffic, industrial emissions and agricultural ammonia. Evidence from long‑term monitoring and health‑risk assessments indicates increased rates of respiratory and cardiovascular disease, reduced life expectancy, and ecosystem stress. While the projection is robust, uncertainties remain around future policy implementation and technology uptake.
Key Takeaways
- EEA modelling predicts that 95% of Europeans will be exposed to pollutant levels above WHO health thresholds in 2025.
- Key pollutants are fine particulate matter (PM2.5) and nitrogen dioxide (NO2), both linked to traffic, industry and agriculture.
- High exposure is associated with premature mortality, chronic disease, and reduced ecosystem services.
- Regional differences stem from population density, energy mix, and enforcement of emission standards.
- Solutions require coordinated policy, technology, urban design and behavioural change, each with distinct trade‑offs.
What Is 95% of Europeans Exposed to Unsafe Air Pollution Levels in 2025?
The statement refers to a statistical projection that, by the year 2025, 95 percent of people living in the European Economic Area will be located in air‑quality monitoring zones where the measured concentrations of PM2.5 or NO2 surpass the WHO’s recommended limits for long‑term exposure. The projection is based on the European Environment Agency’s scenario analysis, which combines observed emission trends with anticipated economic growth, transport patterns and policy trajectories.
How Does It Work?
Physical and Chemical Processes
PM2.5 particles originate from combustion (vehicle exhaust, power plants) and secondary formation (chemical reactions of SO₂, NOₓ, and ammonia). NO2 is emitted directly from high‑temperature combustion and also forms through atmospheric oxidation of nitric oxide. Both pollutants can travel hundreds of kilometres, mixing in the planetary boundary layer before depositing on surfaces or inhaled by humans.
Human Systems and Feedback Loops
Urbanisation concentrates sources and receptors, creating a feedback loop: higher traffic leads to more emissions, which degrade air quality, prompting health‑related productivity losses that can limit investments in cleaner transport. Agricultural ammonia amplifies PM2.5 formation, linking food production to urban air quality.
What Does the Evidence Show?
Multiple lines of evidence converge on the 2025 projection:
- Long‑term monitoring: The European Air Quality Database records average PM2.5 concentrations of 12–15 µg m⁻³ in many cities, already above the 10 µg m⁻³ WHO guideline (European Environment Agency, 2023).
- Health‑risk assessments: WHO’s 2021 Global Air Quality Guidelines link each 10 µg m⁻³ increase in PM2.5 to a 6 percent rise in all‑cause mortality, a relationship confirmed by cohort studies across Europe.
- Modelled scenarios: The EEA’s “Air Quality Outlook 2025” uses integrated assessment models to estimate that, without additional policy measures, 95 percent of the population will exceed WHO limits.
- Attribution studies: Research published in *Environmental Health Perspectives* (2022) attributes roughly 40 percent of PM2.5 in Western Europe to road traffic, and 30 percent to residential heating.
These sources, ranging from direct observations to peer‑reviewed modelling, consistently indicate a worsening exposure trajectory.
Main Causes or Drivers
Direct Causes
- Road traffic emissions (NOₓ, PM2.5) – especially diesel‑powered vehicles.
- Industrial processes – steel, cement, and energy production.
- Agricultural ammonia – volatilisation from livestock manure and synthetic fertilisers.
Underlying Drivers
- Urban population growth – higher density increases source‑receptor overlap.
- Energy system reliance on fossil fuels – limited renewable penetration.
- Policy implementation gaps – delays in enforcing EU Ambient Air Quality Directives.
Environmental and Human Impacts
Environmental Impacts
Elevated PM2.5 reduces photosynthetic efficiency in plants, accelerates soil acidification, and contributes to nutrient imbalances in freshwater bodies. NO2 promotes ozone formation, which damages crops and forest canopies.
Human Health and Social Impacts
Exposure is linked to premature deaths (est. 400,000 excess European deaths per year at current levels), increased asthma incidence in children, and heightened cardiovascular risk in adults. Vulnerable groups—low‑income urban residents, the elderly, and children—experience disproportionate burdens.
Economic and Infrastructure Impacts
Health‑related productivity losses amount to billions of euros annually, while increased healthcare costs strain public budgets. Corrosive pollutants accelerate material degradation, raising maintenance expenses for buildings and transport infrastructure.
Regional Differences
Western and Central European cities (e.g., Paris, Berlin) face high traffic‑related NO2, whereas Eastern European regions often contend with outdated industrial plants and coal‑based heating, leading to higher PM2.5. Rural agricultural zones in the Netherlands and Denmark experience ammonia‑driven secondary PM formation. Monitoring density also varies; some Southern Mediterranean areas lack comprehensive stations, potentially under‑reporting exposure.
What Scientists Know With High Confidence
- PM2.5 and NO2 concentrations above WHO limits increase mortality and morbidity.
- Traffic, industry and agriculture are the dominant sources of these pollutants in Europe.
- Long‑term monitoring data reliably capture spatial patterns of exposure.
- Policy measures such as low‑emission zones and renewable energy transitions can substantially reduce concentrations.
What Remains Uncertain
Key uncertainties include the exact pace of electric‑vehicle adoption, the effectiveness of upcoming EU revisions to the Ambient Air Quality Directive, and the regional variability of ammonia emissions under future agricultural policies. Additionally, gaps in monitoring networks—particularly in low‑population rural zones—limit precise exposure estimates.
Common Misconceptions
Misconception: Air quality is only a problem in big cities.
Reality: While urban centres have high traffic emissions, rural areas can experience severe PM2.5 from agricultural ammonia and long‑range transport of pollutants.
Misconception: Only children and the elderly are affected by air pollution.
Reality: All age groups experience health impacts, but children, the elderly and people with pre‑existing conditions face higher relative risks.
Misconception: Switching to electric cars will instantly solve air‑quality issues.
Reality: Electric vehicles reduce tailpipe emissions, yet upstream electricity generation and non‑traffic sources still contribute substantially to PM2.5 and NO2.
Solutions and Limitations
Effective responses span several domains:
- Regulatory measures: Strengthening EU emission standards can lower traffic and industrial outputs, but enforcement costs and industry push‑back may delay implementation.
- Technology upgrades: Adoption of particulate filters and selective catalytic reduction systems cuts emissions, yet retrofitting older fleets is expensive.
- Renewable energy transition: Shifting from coal to wind or solar reduces combustion‑related pollutants, but intermittency requires grid upgrades.
- Nature‑based solutions: Urban green spaces and afforestation improve local air quality, but their impact is modest compared with emission cuts.
- Behavioural change: Promoting public transport, cycling and telecommuting cuts traffic emissions, yet cultural preferences and infrastructure gaps limit rapid adoption.
What Individuals, Communities, and Governments Can Do
What Individuals Can Do
Choose low‑emission transport modes, support local clean‑energy initiatives, and reduce indoor sources (e.g., wood‑burning stoves). Personal exposure can also be lowered by using air‑quality apps to avoid peak pollution periods.
What Communities and Organizations Can Do
Develop low‑emission zones, expand bike lanes, and implement community monitoring projects that empower residents with real‑time data.
What Governments Can Do
Enforce stricter EU Ambient Air Quality Directive limits, subsidise electric‑vehicle purchases, phase out coal‑fire power, and fund modernisation of agricultural practices to cut ammonia emissions.
What Businesses and Industries Can Do
Invest in cleaner production technologies, adopt transparent emission reporting, and redesign logistics to minimise road miles.
Closing Synthesis
The projection that 95 percent of Europeans will live in areas with unsafe air‑pollution levels by 2025 reflects a convergence of robust monitoring data, credible modelling and well‑understood emission sources. High‑confidence science links these exposures to serious health and environmental outcomes, while uncertainties centre on future policy effectiveness and technology uptake. Addressing the challenge demands a mix of stronger regulation, accelerated clean‑energy transition, urban redesign and informed personal choices. By aligning these actions, Europe can move toward air that is safe for all citizens and ecosystems.
Frequently Asked Questions
What does it mean that 95% of Europeans will be exposed to unsafe air pollution levels?
It means that, according to the European Environment Agency’s 2025 scenario, 95 percent of the population will reside in locations where annual averages of PM2.5 exceed 10 µg m⁻³ or NO2 exceeds 40 µg m⁻³, both above WHO health‑based limits.
Which pollutants are most responsible for the projected exposure?
Fine particulate matter (PM2.5) and nitrogen dioxide (NO2) are the primary pollutants driving the projection, originating mainly from road traffic, industrial combustion and agricultural ammonia.
How does air pollution affect human health in Europe?
Elevated PM2.5 and NO2 are linked to higher rates of premature death, respiratory diseases such as asthma, and cardiovascular problems, with vulnerable groups like children, the elderly and low‑income residents facing greater risk.
What are the main uncertainties that could change the 2025 projection?
Uncertainties include the speed of electric‑vehicle uptake, the stringency and enforcement of upcoming EU air‑quality directives, and gaps in monitoring especially in rural areas, all of which could shift exposure estimates.
What practical actions can individuals take to reduce their exposure?
Individuals can choose low‑emission transport (public transit, cycling), avoid peak‑pollution times using air‑quality apps, limit indoor wood‑burning, and support local clean‑energy projects to help lower overall pollution levels.








Leave a Comment