
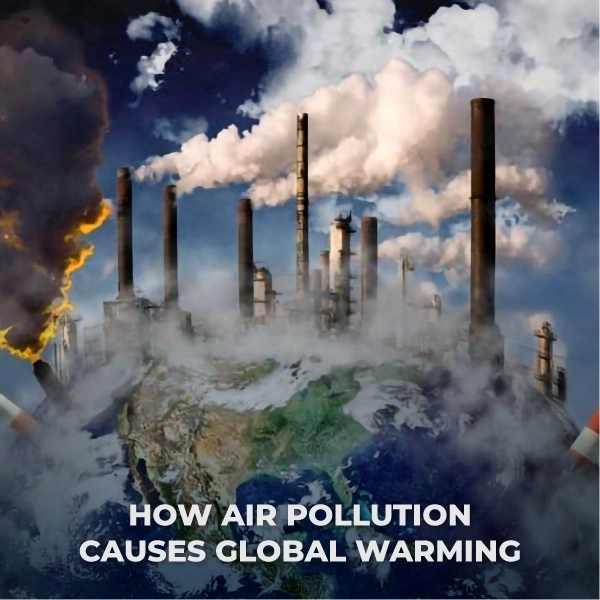
Air pollution in California stems from traffic, industry, and increasingly frequent wildfires, creating regional hotspots and a feedback loop that intensifies climate change and public‑health risks.
Quick Answer
Air pollution in California is a mixture of gases and fine particles released primarily by motor vehicles, industrial facilities, and wildfire smoke. These emissions interact with the state’s basin geography to trap pollutants, producing smog and elevated ozone levels. The scientific consensus is that the same sources also emit greenhouse gases, linking local air quality to global climate warming. While the overall trend shows improvement from stricter standards, episodic spikes—especially from wildfires—continue to pose acute health threats.
Key Takeaways
- Transportation, industry, and wildfires are the three dominant sources of California’s air pollutants.
- Valley topography and temperature inversions amplify concentrations, creating persistent urban hotspots.
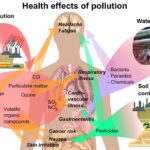
- Fine particulate matter (PM2.5) and ozone are linked to respiratory and cardiovascular disease, with disproportionate impacts on low‑income communities.
- Greenhouse‑gas emissions from the same sources create a feedback loop that increases heatwaves and wildfire risk.
- Evidence‑based policies—such as zero‑emission vehicle mandates and stricter industrial caps—show measurable air‑quality gains, but enforcement and equity remain challenges.
What Is Air Pollution in California: Causes, Hotspots, and Climate Links?
Air pollution refers to the presence of substances in the atmosphere that are harmful to human health or the environment. In California, the term encompasses a range of pollutants—nitrogen oxides (NOx), volatile organic compounds (VOCs), ozone (O3), and fine particulate matter (PM2.5)—that originate from mobile sources, stationary facilities, and natural events. The state’s diverse climate zones, from coastal basins to inland valleys, shape how these pollutants disperse and accumulate. Understanding the distinction between primary emissions (released directly) and secondary pollutants (formed through chemical reactions, such as ozone) is essential for effective management.
How Does It Work?
1. Emission of Primary Pollutants
Cars, trucks, and diesel generators emit NOx and VOCs. Refineries, power plants, and manufacturing units add sulfur dioxide (SO2) and additional VOCs. Wildfires inject large quantities of PM2.5 and carbon monoxide (CO) directly into the atmosphere.
2. Chemical Transformation
In sunlight, NOx and VOCs undergo photochemical reactions that create ground‑level ozone, a key component of smog. PM2.5 can also form secondarily from gaseous precursors like SO2 and ammonia.
3. Atmospheric Transport and Trapping
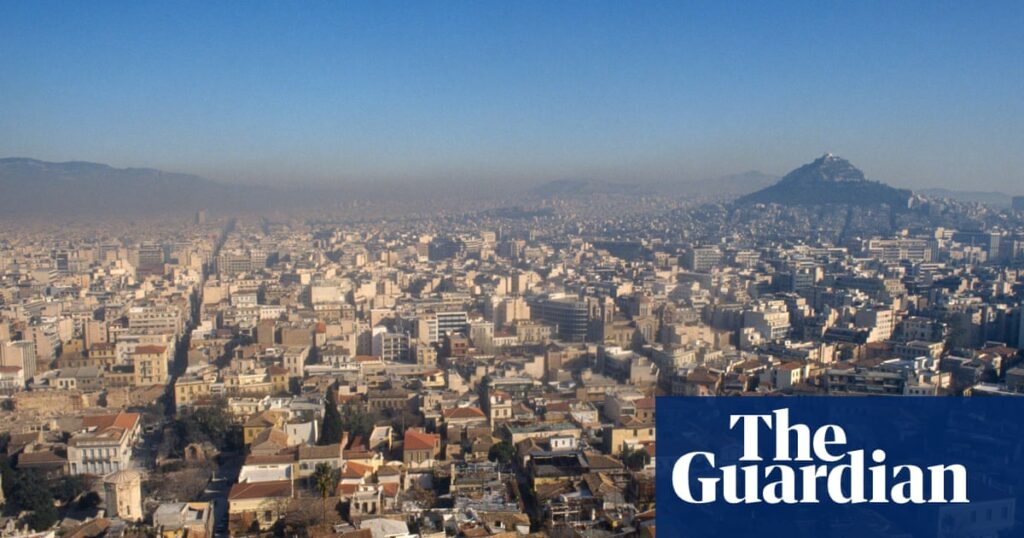
California’s coastal ranges and inland valleys create temperature inversions that trap pollutants near the surface, especially during summer stagnation. This geographic effect concentrates pollutants in cities such as Los Angeles and the Central Valley.
4. Climate Feedbacks
Heatwaves increase ozone formation rates and dry vegetation, raising wildfire probability. Wildfire smoke, in turn, adds more PM2.5 and CO, worsening both air quality and regional warming. This creates a reinforcing cycle between air pollution and climate change.
What Does the Evidence Show?
Long‑term monitoring by the California Air Resources Board (CARB) and the U.S. Environmental Protection Agency (EPA) indicates a downward trend in average PM2.5 concentrations since the mid‑1990s, driven by stricter vehicle standards. However, a 2022 EPA assessment found that PM2.5 levels still exceed the World Health Organization’s guideline in many disadvantaged neighborhoods. Satellite‑derived aerosol optical depth data corroborate ground observations, showing spikes that align with major wildfire events in 2017, 2018, and 2020. Peer‑reviewed meta‑analyses link California’s ozone peaks to both traffic density and solar radiation intensity, confirming the role of photochemistry.
Main Causes or Drivers
Transportation
Road networks carry over 15 million passenger vehicles daily, making transportation the largest source of NOx and VOCs. The shift toward electric vehicles (EVs) is reducing tailpipe emissions, but electricity generation still contributes indirect emissions.
Industrial Activity
Refineries along the San Pablo Bay and petrochemical complexes in the Central Valley emit NOx, SO2, and hazardous air pollutants. While CARB’s compliance monitoring shows a 30 % reduction in refinery emissions since 2005, occasional exceedances persist, especially during maintenance shutdowns.
Wildfires
Since the early 2000s, the frequency of large wildfires has risen, driven by hotter, drier summers and increased fuel loads. The National Interagency Fire Center reports that California burned an average of 1.4 million acres per year in the 1990s, compared with 4.2 million acres per year in the 2010s.
Underlying Drivers
Population growth, urban sprawl, and the state’s reliance on imported electricity from fossil‑fuel plants amplify emissions. Climate change itself intensifies heatwaves, creating conditions favorable for ozone formation and wildfire ignition.
Environmental and Human Impacts
Environmental Impacts
Elevated ozone damages vegetation, reducing crop yields by up to 10 % in the Central Valley, according to a USDA study. PM2.5 deposition accelerates soil acidification, affecting forest health.
Human Health and Social Impacts
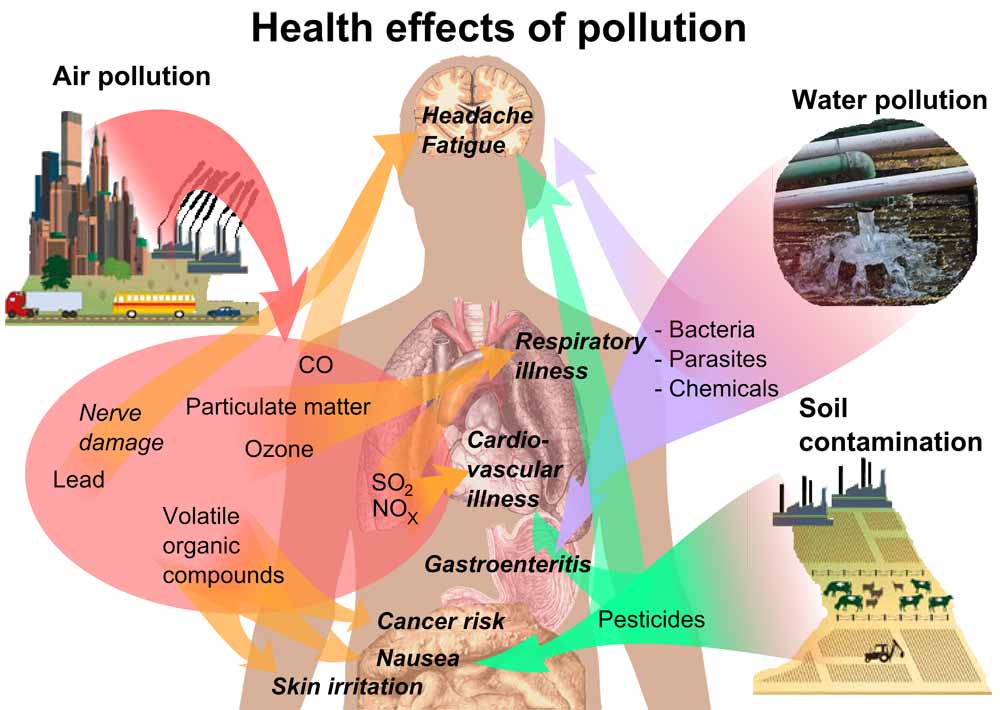
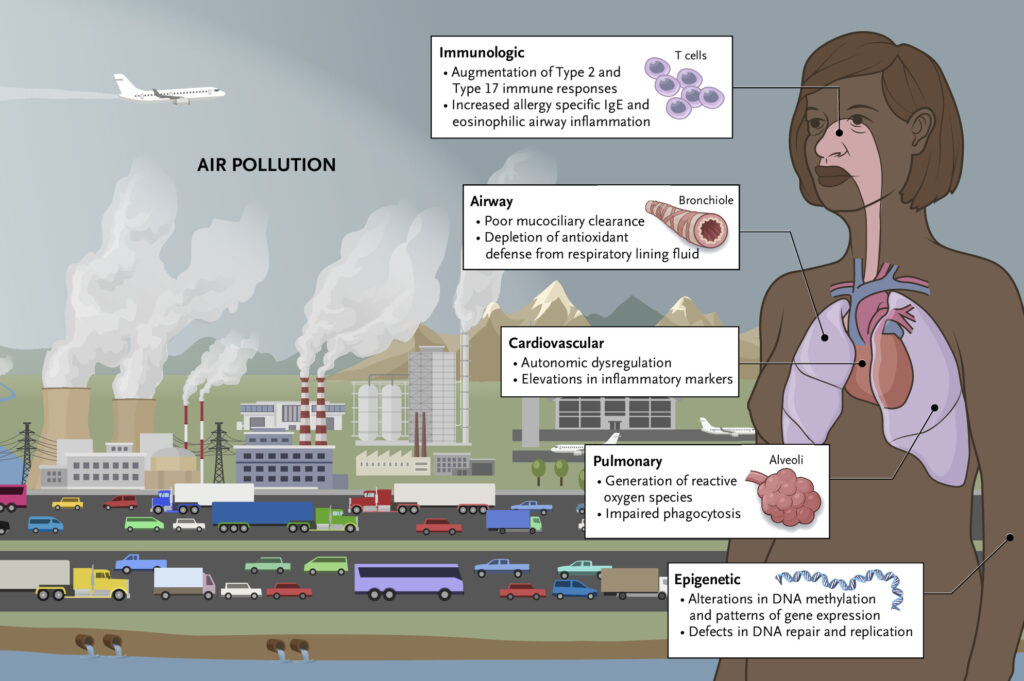
Epidemiological studies by the California Department of Public Health associate each 10 µg/m³ increase in PM2.5 with a 4 % rise in premature mortality. Children, the elderly, and outdoor workers experience higher rates of asthma exacerbations during smog episodes. Disadvantaged communities often live nearer to highways and refineries, compounding exposure inequities.
Economic and Infrastructure Impacts
Air‑quality alerts trigger school closures and limit outdoor labor, costing the state an estimated $2 billion annually in productivity losses (California Legislative Analyst’s Office, 2021). Healthcare expenditures rise proportionally with pollution‑related illness.
Regional Differences
Coastal Los Angeles benefits from marine breezes that occasionally disperse pollutants, yet its basin geometry still yields chronic ozone episodes. The Central Valley, surrounded by mountains, experiences some of the nation’s highest annual PM2.5 averages. In contrast, the Sierra Nevada foothills see lower baseline levels but are vulnerable to episodic smoke transport from distant fires.
What Scientists Know With High Confidence
- Vehicle exhaust is the dominant source of NOx and VOCs in urban California.
- Ground‑level ozone formation increases with temperature and sunlight, making heatwaves a key driver.
- Wildfire smoke substantially raises PM2.5 concentrations across the state for weeks after a fire.
- Long‑term exposure to PM2.5 and ozone is linked to premature mortality and chronic respiratory disease.
- Regulatory actions since the 1990s have produced measurable declines in several key pollutants.
What Remains Uncertain
Uncertainty persists around the exact contribution of secondary organic aerosol formation to total PM2.5 under varying climatic conditions. The interaction between future wildfire regimes and urban air‑quality trends also requires more high‑resolution modelling. Finally, the health effects of ultra‑fine particles (PM0.1) remain an emerging research area with limited epidemiological data.
Common Misconceptions
Misconception: California’s air quality is uniformly improving.
Reality: While average emissions have declined, episodic spikes from wildfires and localized industrial releases keep many neighborhoods above health‑based standards.
Misconception: Only traffic causes smog.
Reality: Industrial facilities, power generation, and wildfire smoke all contribute precursors that chemically form ozone and fine particles.
Misconception: Switching to electric cars eliminates air‑pollution impacts.
Reality: EVs remove tailpipe emissions, but upstream electricity production and battery manufacturing still emit pollutants unless the grid is fully renewable.
Misconception: Wildfire smoke is a short‑term issue.
Reality: Smoke can linger for weeks, travel hundreds of miles, and its fine particles penetrate deep into the lungs, creating both acute and chronic health risks.
Solutions and Limitations
Effective responses combine regulatory, technological, and behavioral strategies. Tightening vehicle‑emission standards has proven effective, yet the transition to zero‑emission fleets depends on infrastructure investment and consumer affordability. Industrial emission caps reduce local hotspots, but enforcement gaps can undermine compliance. Wildfire mitigation—through forest management and climate‑adaptation planning—offers long‑term risk reduction, but ecological trade‑offs and community acceptance vary. Renewable‑energy integration lowers indirect emissions, yet intermittency challenges require robust storage solutions.
What Individuals, Communities, and Governments Can Do
What Individuals Can Do
Use public transit or car‑pooling to cut personal NOx emissions, install high‑efficiency filters at home, and follow local air‑quality alerts to limit outdoor activity during peak smog or smoke days.
What Communities and Organizations Can Do
Advocate for stricter local zoning that separates schools and hospitals from major roadways, support community monitoring networks, and partner with NGOs to develop heat‑wave response plans.
What Governments Can Do
Accelerate the state’s zero‑emission vehicle mandate, enforce tighter emission limits on refineries, fund regional wildfire‑risk assessments, and allocate resources for equitable air‑quality improvement programs.
What Businesses and Industries Can Do
Adopt best‑available control technologies, transition to renewable electricity for operations, and publicly disclose emissions data to enhance transparency.
Closing Synthesis
California’s air‑pollution challenge is a complex tapestry of traffic, industry, and climate‑driven wildfires, each reinforcing the other through chemical and physical feedbacks. Robust monitoring and decades of regulatory progress have lowered baseline levels, yet hotspots persist and climate change threatens to reverse gains. High‑confidence evidence identifies the main sources and health consequences, while uncertainties focus on emerging particle fractions and future wildfire dynamics. Evidence‑based solutions—clean‑energy transitions, stricter emission standards, and proactive wildfire management—offer a realistic path forward, provided they are implemented equitably and supported by sustained public engagement.
Frequently Asked Questions
What defines air pollution in California?
Air pollution in California is defined as a mixture of gases and fine particles—such as nitrogen oxides, ozone, and PM2.5—that originate from sources like vehicles, industry, and wildfires and exceed health‑based air‑quality standards.
Which sources contribute most to California's smog?
The primary contributors to California's smog are motor‑vehicle exhaust, industrial facilities (including refineries), and wildfire smoke, all of which emit ozone‑forming chemicals and fine particulate matter.
How do wildfires affect air quality in the state?
Wildfires inject large amounts of fine particulate matter and carbon monoxide into the atmosphere, creating smoke plumes that can travel hundreds of miles and keep PM2.5 concentrations elevated for weeks, worsening overall air quality.
What health problems are linked to the state's air pollution?
Long‑term exposure to elevated PM2.5 and ozone in California is associated with higher rates of asthma, cardiovascular disease, and premature mortality, especially among children, older adults, and low‑income communities.
What actions can individuals take to reduce exposure?
Individuals can lower exposure by using public transit or car‑pooling, staying indoors during high‑pollution alerts, installing high‑efficiency air filters at home, and supporting local clean‑air initiatives.





Leave a Comment