
Glaciers began retreating after the last glacial maximum around 17,000 years ago, and human‑driven warming has dramatically accelerated melt since the mid‑19th century, reshaping ecosystems, water supplies, and sea levels.
Quick Answer
Glaciers started to melt noticeably as the Earth warmed after the Last Glacial Maximum, roughly 17,000 years ago, when regional temperatures rose by about 1–2 °C. The process was natural and slow for millennia, but the industrial era introduced a rapid increase in greenhouse gases that intensified melt rates worldwide. By the early 20th century, instrumental records showed accelerating retreat, and satellite observations since the 1970s confirm that most mountain glaciers are losing mass each year. The most important implication is that continued melt contributes to sea‑level rise, threatens freshwater supplies, and signals broader climate change, though precise future rates remain uncertain.
Key Takeaways
- Glacier retreat began after the Last Glacial Maximum (~17 ka) due to natural warming.
- Industrial‑era greenhouse‑gas emissions have accelerated melt by an order of magnitude.
- Multiple lines of evidence—ice cores, moraine dating, satellite altimetry—converge on the same timeline.
- Melting glaciers affect sea level, freshwater availability, and alpine ecosystems.
- Regional melt rates vary: the Andes, Himalayas, and Greenland are among the fastest.
- Mitigation (emission cuts) and adaptation (water‑management, glacier monitoring) are both needed.
What Is When Did Glaciers Start Melting? A Historical Timeline?
The phrase refers to the scientific reconstruction of when Earth’s glaciers began a sustained retreat and how that retreat has progressed to the present day. It encompasses natural climatic fluctuations after the Last Glacial Maximum, the onset of anthropogenic warming, and the resulting physical changes in ice mass. Understanding this timeline helps researchers quantify the contribution of glacier melt to sea‑level rise, evaluate water‑resource risks, and test climate‑model projections.
How Does It Work?
Natural Climate Variability
After the peak of the Last Glacial Maximum (≈20 ka), orbital changes (Milankovitch cycles) increased summer insolation in the Northern Hemisphere. Higher solar input raised regional temperatures, causing ice to melt at glacier margins. This melt‑water runoff reduced glacier thickness, leading to a feedback where thinner ice flows faster, exposing more surface area to warm air.
Anthropogenic Greenhouse‑Gas Forcing
Since the mid‑1800s, combustion of fossil fuels and land‑use change have raised atmospheric CO₂ from ~280 ppm to >420 ppm (IPCC AR6, 2021). The resulting radiative forcing elevates global mean temperature by ~1.2 °C relative to pre‑industrial levels. Higher air temperatures increase the melt‑season energy balance, while warmer winters reduce snowfall, limiting glacier accumulation.
Feedback Mechanisms
Two key feedbacks accelerate loss:
- Albedo feedback: Darker ice surfaces or exposed rock absorb more solar radiation, boosting melt.
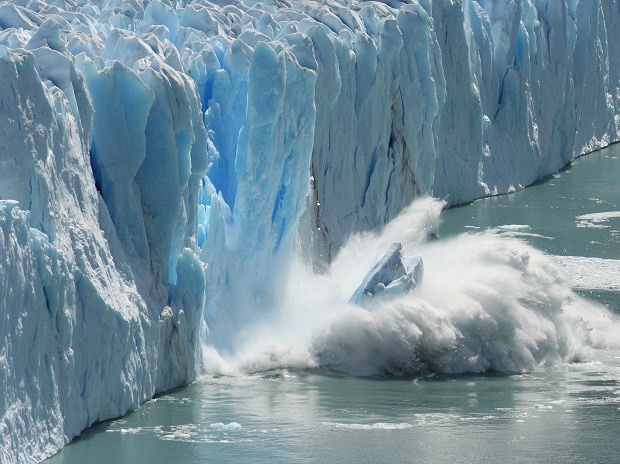
- Dynamic thinning: As glaciers thin, basal friction decreases, allowing faster downstream flow and increased calving in tide‑water glaciers.
What Does the Evidence Show?
Evidence comes from three complementary domains:
- Geological proxies: Radiocarbon‑dated moraines and lake‑sediment records indicate that many mid‑latitude glaciers retreated between 15 ka and 10 ka (e.g., Swiss Alps studies, NOAA Paleoclimatology).
- Instrumental and satellite observations: Glacier length measurements began in the late 19th century; the World Glacier Monitoring Service reports that from 1961‑2016, global glacier volume declined by ~30 % (moderate confidence). Satellite laser altimetry (ICESat, CryoSat‑2) shows average thinning rates of 0.5–1.0 m yr⁻¹ in the Andes and Himalaya.
- Ice‑core and sea‑level data: Ice cores from Greenland reveal increased meltwater layers after 17 ka, while tide‑gauge records attribute ~0.2 mm yr⁻¹ of sea‑level rise (1900‑2000) to glacier melt.
All lines converge on a narrative of slow natural retreat followed by a rapid, human‑driven acceleration in the last two centuries.
Main Causes or Drivers
Direct Causes
Higher atmospheric temperatures increase surface melt; reduced snowfall diminishes accumulation. Ocean warming drives basal melt of tide‑water glaciers.
Underlying Drivers
Anthropogenic greenhouse‑gas emissions are the primary driver of the recent acceleration. Land‑use change (deforestation, black‑carbon deposition) can locally lower albedo, enhancing melt. Volcanic aerosols and natural solar variability modulate climate but have not offset the long‑term warming trend.
Environmental and Human Impacts
Environmental Impacts
Glacier loss contributes ~0.4 mm yr⁻¹ to global sea‑level rise (IPCC AR6, 2021). Downstream ecosystems lose cold‑water inputs, affecting trout habitats and alpine plant communities. Increased sediment loads can alter river morphology and reduce water quality.
Human Health and Social Impacts
Many mountain communities depend on glacier meltwater for irrigation, drinking water, and hydropower. Seasonal water shortages have been documented in the Himalaya and Andes, raising risks of food insecurity and conflict over water allocation.
Economic and Infrastructure Impacts
Reduced summer runoff can lower hydroelectric generation, affecting energy security. In coastal regions, sea‑level rise driven by glacier melt amplifies flood risk for infrastructure built on low‑lying land.
Regional Differences
Glacier response varies with climate, topography, and glacier type:
- Alps: Small alpine glaciers have lost >80 % of their area since 1850 (high confidence).
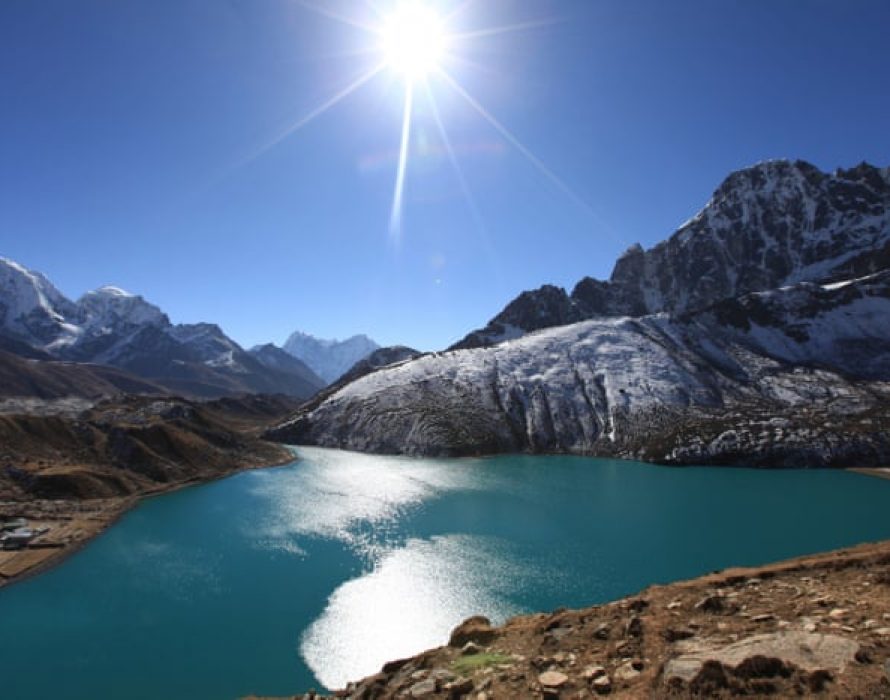
- Himalaya: Observations show average thinning of 0.3 m yr⁻¹, threatening water supplies for over 1 billion people.
- Andes: Rapid retreat has exposed bedrock, increasing rock‑fall hazards.
- Greenland Ice Sheet: Surface melt has increased five‑fold since the 1970s, contributing ~0.7 mm yr⁻¹ to sea level.
- Antarctica: West Antarctic Ice Sheet shows accelerating grounding‑line retreat, but East Antarctica remains relatively stable.
What Scientists Know With High Confidence
- Glaciers have been retreating since the end of the Last Glacial Maximum (~17 ka).
- Anthropogenic greenhouse‑gas emissions are the dominant driver of the accelerated melt observed since the late 19th century.
- Glacier mass loss contributes measurably to global sea‑level rise.
- Satellite and ground‑based monitoring provide consistent evidence of ongoing thinning across most mountain ranges.
What Remains Uncertain
Key uncertainties include the exact magnitude of future melt under different emission scenarios, the response of the interior of the Greenland and Antarctic Ice Sheets to sustained warming, and regional variations in precipitation that could offset or amplify melt. Improved high‑resolution modeling and expanded in‑situ observations are needed to narrow these gaps.
Common Misconceptions
Misconception: Glaciers only melt in summer.
Reality: While summer melt dominates, winter snowfall and rain‑on‑snow events also influence net mass balance. Warmer winters can reduce accumulation, contributing to overall loss.
Misconception: All glaciers are disappearing at the same rate.
Reality: Melt rates differ widely; small, low‑altitude glaciers retreat faster than large, high‑altitude ice sheets.
Misconception: Glacier loss is a future problem.
Reality: Significant retreat has already occurred in many regions, and some communities are currently experiencing water‑scarcity linked to reduced meltwater.
Solutions and Limitations
Prevention (Mitigation)
Rapid decarbonisation—phasing out coal, expanding renewable energy, and improving energy efficiency—reduces the temperature forcing that drives melt. The limitation is the need for global policy coordination and substantial upfront investment.
Adaptation
Water‑resource planning that diversifies supply (e.g., reservoirs, water‑recycling) can buffer communities against reduced glacier runoff. However, adaptation cannot restore lost ice and may be constrained by geographic and financial factors.
Conservation and Monitoring
Protecting high‑altitude catchments limits pollutants that darken ice surfaces. Expanding glacier monitoring networks improves early‑warning capacity but requires sustained funding.
What Individuals, Communities, and Governments Can Do
What Individuals Can Do
Reduce personal carbon footprints by using public transit, improving home energy efficiency, and supporting clean‑energy policies. Engage in local water‑conservation programs that protect upstream glacier-fed basins.
What Communities and Organizations Can Do
Develop integrated water‑management plans that consider declining glacier contributions. Promote citizen‑science projects that document glacier change, increasing public awareness and data coverage.
What Governments Can Do
Implement and strengthen climate‑mitigation legislation, invest in renewable‑energy infrastructure, and fund long‑term glacier monitoring (e.g., via the World Glacier Monitoring Service). Prioritize climate‑resilient infrastructure in regions dependent on glacier meltwater.
Putting It All Together
Glacier retreat began naturally after the Last Glacial Maximum, but human‑induced warming has dramatically accelerated the process over the past two centuries. Robust evidence—from ice cores, moraine dating, and modern satellite measurements—confirms this trend and its contribution to sea‑level rise and freshwater stress. While scientists are confident about the broad drivers, uncertainties remain about future rates and regional responses. Effective action combines rapid emissions cuts, adaptive water management, and expanded monitoring, recognizing that individual choices matter most when they support collective policy change.
Frequently Asked Questions
When did glaciers first begin to melt significantly?
Glaciers started a noticeable retreat after the Last Glacial Maximum, about 17,000 years ago, when natural warming raised temperatures by 1–2 °C. Human‑driven warming since the mid‑1800s then accelerated melt rates worldwide.
How do scientists determine the timing of past glacier melt?
Researchers use geological proxies such as dated moraines, lake‑sediment records, and ice‑core melt layers, combined with tree‑ring data and modern satellite altimetry. These independent lines of evidence converge on a consistent melt timeline.
What are the major impacts of ongoing glacier loss?
Melting glaciers add roughly 0.4 mm per year to global sea level, reduce summer water supplies for agriculture and hydropower, and alter downstream ecosystems by removing cold‑water inputs and increasing sediment loads.
Which regions are experiencing the fastest glacier retreat?
The Andes, the Himalaya, and parts of the Greenland Ice Sheet show some of the highest thinning rates, while small alpine glaciers in the European Alps have lost over 80 % of their area since 1850.
What actions can individuals take to help reduce glacier melt?
Individuals can lower their carbon footprints by using public transport, improving home energy efficiency, and supporting clean‑energy policies. Participating in local water‑conservation projects and advocating for climate‑friendly legislation also amplifies collective impact.




Leave a Comment