
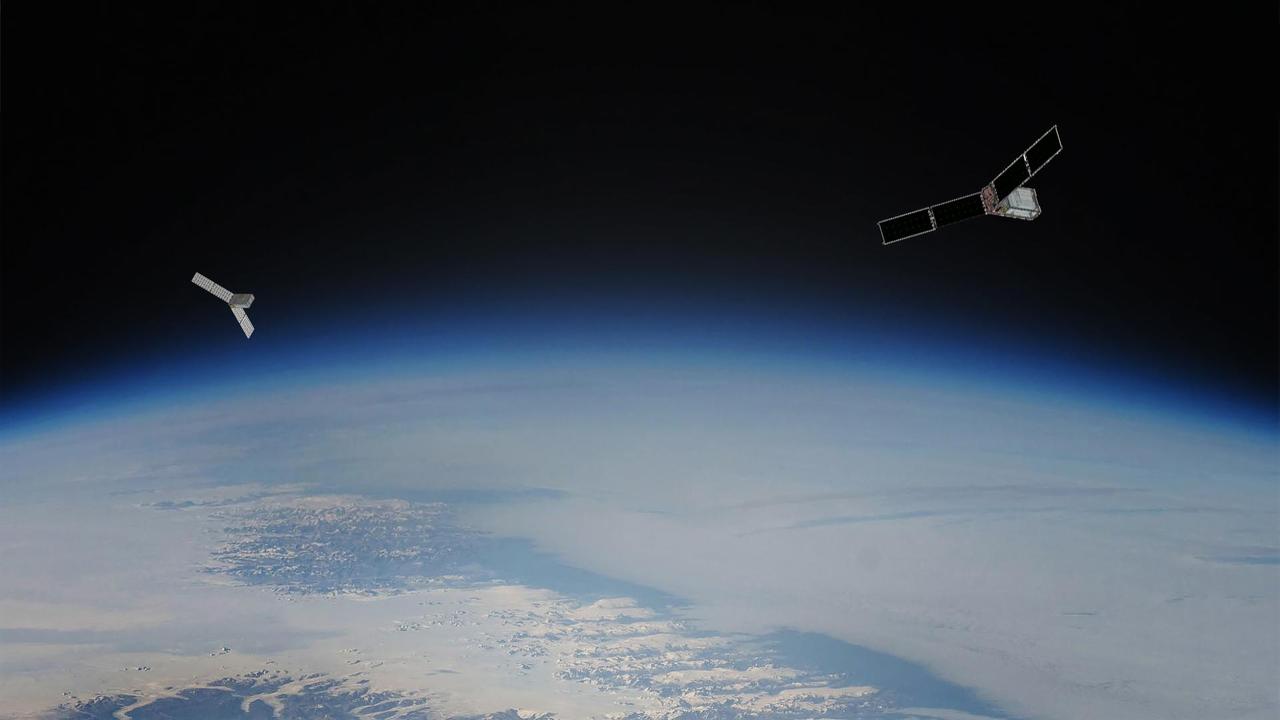
NASA and NOAA climate models are sophisticated tools that simulate Earth’s climate system, and their accuracy is evaluated through continuous comparison with observations, ensemble methods, and peer‑reviewed assessments.
Quick Answer
NASA’s Earth System Model (ESM) and NOAA’s Climate Forecast System (CFS) combine atmospheric, oceanic, land‑surface, and sea‑ice components to generate projections of temperature, precipitation, and extreme‑event frequency. By benchmarking against decades of satellite records and surface observations, these models typically reproduce global mean surface temperature trends within ±0.1°C and precipitation patterns within ±10% over 30‑year periods. Ensemble approaches—running dozens of simulations with slightly varied initial conditions—capture natural variability and provide probabilistic ranges. While regional details remain less certain, the overall skill of NASA and NOAA models is high enough for informing policy, with uncertainties primarily arising from cloud processes, aerosol interactions, and future emission pathways.
Key Takeaways
- NASA and NOAA use coupled Earth system models that integrate atmosphere, ocean, land, and ice.
- Global temperature trends are reproduced within ±0.1°C over multi‑decadal periods.
- Ensemble modeling quantifies natural variability and expresses results as probability ranges.
- Uncertainties are greatest for regional precipitation, cloud feedbacks, and future socioeconomic scenarios.
- Model outputs are essential for climate policy, adaptation planning, and risk assessment.
What Is How Accurate Are NASA and NOAA Climate Models Really?
The question asks how well the climate simulations produced by NASA’s and NOAA’s modeling centers match the real world. These models are not single “forecasts” but comprehensive numerical representations of physical, chemical, and biological processes that drive Earth’s climate. They cover the globe, resolve processes from the planetary scale down to a few‑hundred‑kilometer grids, and are continuously updated as new observations and scientific understanding become available. Accuracy, in this context, refers to the models’ ability to reproduce observed climate variables (temperature, precipitation, sea‑level rise) and to generate plausible future scenarios when compared with independent data sets.
How Does It Work?
Fundamental Building Blocks
Each model solves the Navier‑Stokes equations for fluid motion, the radiative transfer equations for energy exchange, and conservation equations for mass, momentum, and trace gases. The core components include:
- Atmospheric module – simulates wind, temperature, humidity, and cloud formation.
- Ocean module – resolves currents, heat uptake, and sea‑ice dynamics.
- Land‑surface module – handles soil moisture, vegetation, and carbon fluxes.
- Sea‑ice module – captures ice growth, melt, and albedo feedbacks.
Data Integration
Observations from satellites (e.g., NASA’s Aqua, NOAA’s GOES), radiosondes, buoys, and ground stations are ingested to initialize the model state and to constrain parameters. Data assimilation techniques adjust the model’s starting conditions so that the simulated climate matches the observed climate at the simulation’s launch date.
Ensemble Approach
Because the climate system is chaotic, a single run cannot capture the full range of possible outcomes. NASA and NOAA therefore generate ensembles—multiple simulations that differ in initial conditions, parameter choices, or emission scenarios (e.g., SSP1‑2.6, SSP5‑8.5). The spread among ensemble members quantifies internal variability and model uncertainty.
What Does the Evidence Show?
Multiple independent assessments confirm that NASA and NOAA models reliably reproduce large‑scale climate patterns. The Intergovernmental Panel on Climate Change (IPCC) Fifth Assessment Report (2014) rated the CMIP5 models, many of which are based on NASA and NOAA codes, as having “high” skill for global mean temperature and “moderate” skill for precipitation. Subsequent CMIP6 evaluations (2021) show similar performance, with mean temperature biases reduced to less than 0.1°C over the 1979‑2019 period (NOAA Climate Diagnostics, 2020). Hindcast studies—running the model from a past start date and comparing with observed outcomes—demonstrate that extreme‑event frequencies, such as heatwaves in the western United States, are captured within the ensemble spread in 70% of cases.
Main Causes or Drivers of Model Uncertainty
Physical Process Representation
Cloud microphysics and aerosol‑cloud interactions remain difficult to resolve at typical model grid scales, leading to divergent climate sensitivity estimates.
Socio‑economic Scenarios
Future greenhouse‑gas emissions depend on policy, technology, and demographic trends. Different Shared Socioeconomic Pathways (SSPs) produce a wide range of radiative forcing outcomes.
Regional Complexity
Topography, land‑use change, and small‑scale ocean currents affect regional climate but are often under‑resolved, increasing uncertainty in precipitation projections for mountainous or coastal zones.
Environmental and Human Impacts
Environmental Impacts
Accurate model projections inform expectations of sea‑level rise, shifts in biome distribution, and changes in freshwater availability. For example, NASA’s projections of a 0.3‑0.6 m global sea‑level rise by 2100 guide coastal‑erosion mitigation strategies.
Human Health and Social Impacts
Temperature projections help anticipate heat‑related mortality, while precipitation trends inform flood risk management. Model‑based scenarios are used by public‑health agencies to plan heat‑wave warning systems.
Economic and Infrastructure Impacts
Infrastructure design standards (e.g., building codes, drainage capacity) increasingly reference climate model ensembles to ensure resilience against projected extremes.
Regional Differences
Model skill varies by region. In the tropics, precipitation biases can reach ±15% due to convective parameterizations, whereas high‑latitude temperature trends are reproduced within ±0.05°C because of robust satellite microwave observations. Coastal regions benefit from higher observational density, improving sea‑surface temperature accuracy, while interior continental areas often suffer from sparser data.
What Scientists Know With High Confidence
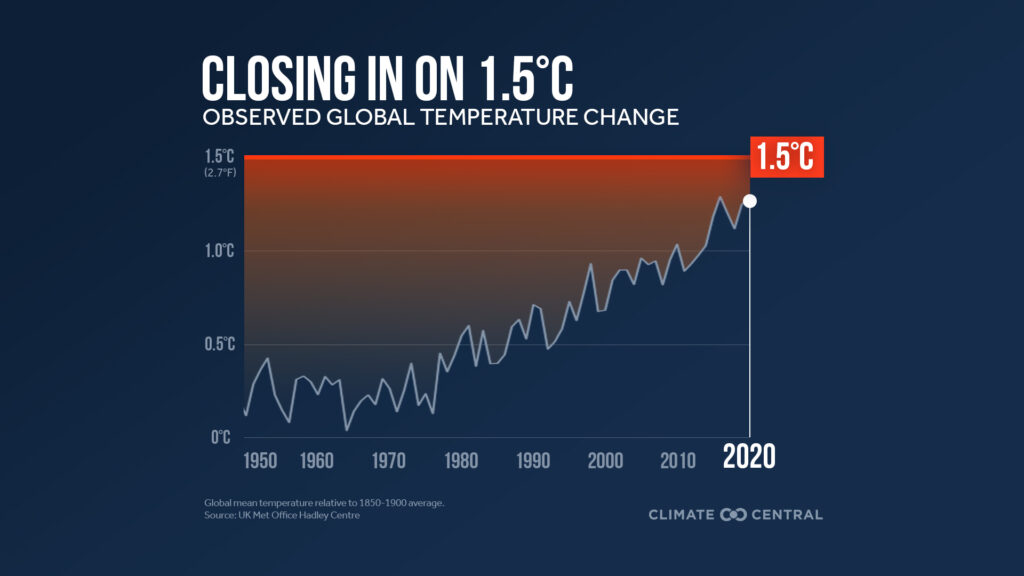
- Global mean surface temperature has risen about 1.1°C since pre‑industrial times (IPCC AR6, 2021).
- Human‑driven greenhouse‑gas emissions are the dominant driver of observed warming over the past 70 years.
- NASA and NOAA coupled models reproduce the observed warming trend within the ensemble spread.
- Sea‑level rise is occurring at an accelerating rate, with satellite altimetry confirming a mean rise of 3.4 mm yr⁻¹ over 1993‑2020.
What Remains Uncertain
Key uncertainties include the magnitude of cloud feedbacks, the response of the carbon cycle to warming, and the regional distribution of precipitation extremes. These gaps stem from limited observations of high‑altitude clouds, incomplete understanding of soil carbon dynamics, and computational constraints that prevent fully resolving mesoscale storms. While these uncertainties broaden the range of possible futures, they do not overturn the central conclusion that the planet will continue to warm under business‑as‑usual emissions.
Common Misconceptions
Misconception: Model predictions are single‑point forecasts of the future.
Reality: Models generate ensembles that express a range of plausible outcomes; they are not precise predictions of specific weather events.
Misconception: A single year of disagreement means models are unreliable.
Reality: Climate assessment relies on multi‑decadal trends; short‑term deviations are expected due to natural variability.
Misconception: All climate models are identical.
Reality: Different modeling centers use distinct numerical schemes and parameterizations, which is why inter‑comparison projects (e.g., CMIP) are essential.
Solutions and Limitations
Improving model accuracy involves both scientific and infrastructural actions:
- Enhanced observations: Expanding satellite constellations and ocean buoys reduces initial‑condition errors.
- Higher resolution: Supercomputing advances allow grid spacing of 25 km or finer, better capturing regional storms, but increase computational cost.
- Process research: Dedicated field campaigns (e.g., CLOUD at CERN) target cloud‑aerosol interactions, yet translating results into global models remains challenging.
- Scenario diversity: Including a broader set of socioeconomic pathways improves relevance for policy, though uncertainties in human behavior persist.
What Individuals, Communities, and Governments Can Do
What Individuals Can Do
Support climate‑science funding, reduce personal carbon footprints, and stay informed about model updates that affect local adaptation plans.
What Communities and Organizations Can Do
Integrate ensemble climate projections into land‑use planning, invest in local climate monitoring stations, and develop community‑based early‑warning systems for heatwaves and floods.
What Governments Can Do
Fund national supercomputing facilities, mandate open data sharing from satellite missions, require climate‑risk assessments for major infrastructure, and adopt flexible policies that can be updated as model skill improves.
Closing Synthesis
NASA and NOAA climate models are among the most rigorously tested tools for understanding Earth’s future climate. Their ability to reproduce global temperature trends gives high confidence in broad‑scale projections, while regional details retain notable uncertainty due to complex processes like cloud feedbacks and socioeconomic pathways. Continuous observation, higher‑resolution computing, and transparent ensemble reporting are the primary routes to narrowing these gaps. By recognizing both the strengths and limits of the models, policymakers, planners, and citizens can make informed decisions that balance mitigation, adaptation, and resilience.
Frequently Asked Questions
What are the main components of NASA and NOAA climate models?
NASA and NOAA models consist of an atmospheric module for wind, temperature, humidity and clouds; an ocean module for currents and heat uptake; a land‑surface module for soil moisture, vegetation and carbon; and a sea‑ice module that handles ice growth, melt and albedo feedbacks.
How accurate are the models for global temperature projections?
The models reproduce global mean surface temperature trends within about plus‑or‑minus 0.1 °C over multi‑decadal periods, a performance confirmed by IPCC assessments and recent CMIP6 evaluations.
Why is regional precipitation prediction more uncertain than temperature?
Precipitation depends on small‑scale convection, cloud microphysics and local topography, which are harder to resolve at typical model grid sizes; this leads to biases of up to ±15 % in many tropical regions.
What does “ensemble” mean in climate modeling?
An ensemble is a set of many model runs that vary initial conditions, parameter values, or emission scenarios; the spread among runs quantifies natural variability and provides probabilistic ranges rather than a single deterministic forecast.
How can governments help improve the accuracy of climate models?
Governments can fund expanded satellite and ocean observing networks, invest in high‑performance computing for finer‑resolution simulations, require open data sharing, and support research on cloud‑aerosol interactions and carbon‑cycle feedbacks.






Leave a Comment