
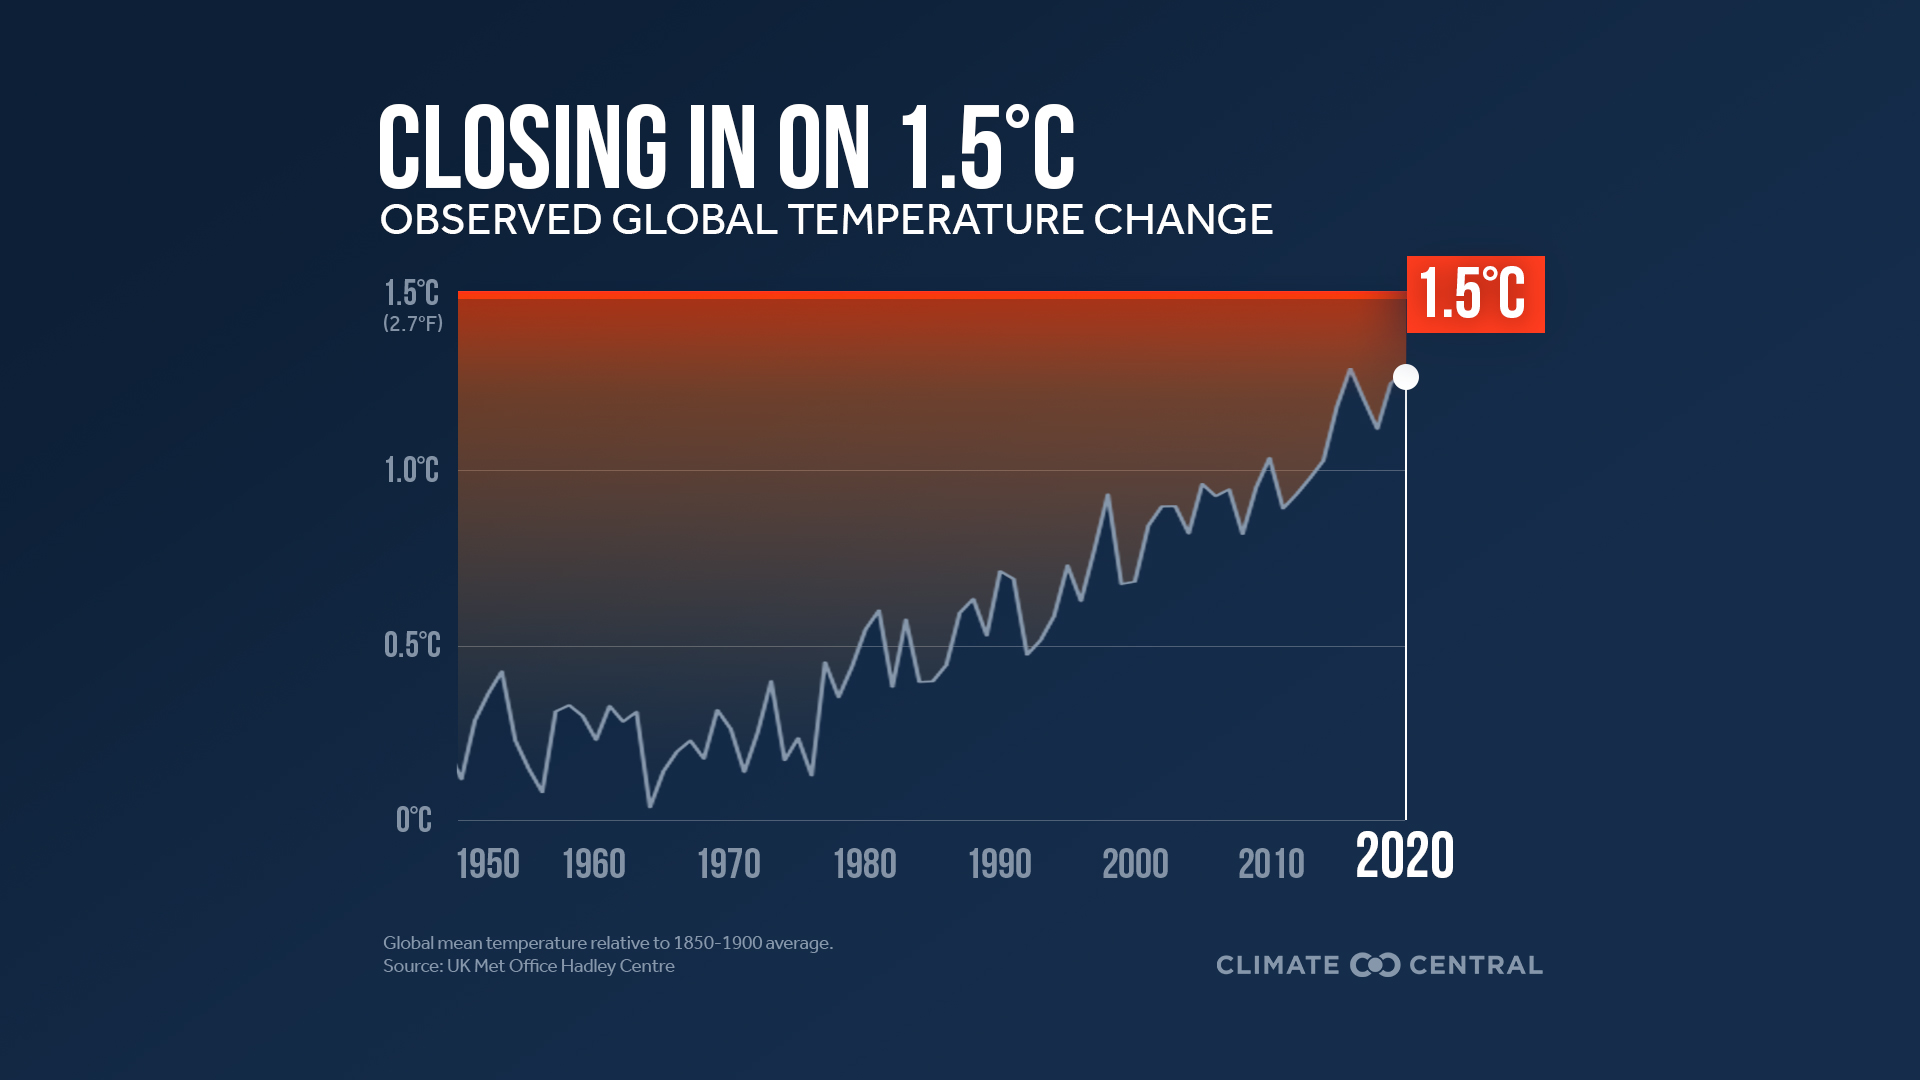
In the coming two decades, rising greenhouse‑gas concentrations will intensify heat, alter precipitation, and increase extreme events, reshaping ecosystems, water supplies, food systems, and human societies worldwide.
Quick Answer
Climate change over the next 20 years will be driven by continued accumulation of carbon dioxide and other long‑lived greenhouse gases in the atmosphere, leading to a global mean temperature rise of about 0.3–0.5°C above 2020 levels under current policy trajectories. This warming amplifies the water cycle, making heatwaves, heavy rain, and drought more common. The most certain impacts are higher average temperatures, more frequent extreme weather, and stress on water and food security. Uncertainty remains in the exact magnitude of regional changes and in how quickly societies will mitigate emissions or adapt to new conditions.
Key Takeaways
- Global average temperature is projected to increase by 0.3–0.5°C in the next two decades.
- Extreme heat, heavy precipitation, and drought will become more frequent worldwide.
- Water scarcity and flood risk will rise, especially in already vulnerable regions.
- Food production will face yield volatility, increasing the risk of insecurity for low‑income populations.
- Mitigation and adaptation actions taken now will shape the severity of impacts after 2045.
What Is What Climate Change Will Look Like Over the Next 20 Years?
The phrase refers to the observable and modelled changes in Earth’s climate system that are expected to occur between roughly 2025 and 2045 as a result of ongoing greenhouse‑gas emissions. It includes shifts in temperature, precipitation, sea level, and the frequency of extreme events, as well as the cascading effects on ecosystems, economies, and human health. Unlike short‑term weather fluctuations, these trends represent long‑term alterations to the planet’s energy balance, confirmed by multiple lines of scientific evidence.
How Does It Work?
Physical and Chemical Foundations
Solar radiation reaches Earth’s surface, where part is reflected and part is absorbed. Greenhouse gases (GHGs) such as CO₂, CH₄, and N₂O trap a fraction of the outgoing infrared radiation, creating a natural warming effect. Human activities have increased atmospheric CO₂ from about 280 ppm in pre‑industrial times to roughly 420 ppm in 2023 (NOAA, 2023), strengthening this greenhouse effect.
Feedback Loops
Several feedbacks accelerate warming:
- Water‑vapour feedback: Warmer air holds more moisture, which is itself a potent GHG.
- Albedo feedback: Melting snow and ice expose darker surfaces, absorbing more sunlight.
- Permafrost carbon release: Thawing soils can emit additional CO₂ and CH₄.
These feedbacks are incorporated into the climate models that generate the 20‑year projections.
Timescales and Thresholds
While atmospheric CO₂ persists for centuries, the climate system responds on multiple timescales. Decadal warming is driven primarily by the cumulative CO₂ concentration, whereas sea‑level rise also depends on slow‑moving ice‑sheet dynamics that may not fully manifest within 20 years but will already be underway.
What Does the Evidence Show?
Multiple independent lines of evidence confirm the trajectory:
- Instrumental records: Global surface temperature datasets (e.g., NASA GISTEMP) show a 1.1°C increase since the pre‑industrial baseline, with the warmest five years on record occurring after 2015.
- Attribution studies: The Intergovernmental Panel on Climate Change (IPCC) Fifth and Sixth Assessment Reports attribute >95% of observed warming since 1950 to human‑driven GHG emissions.
- Model ensembles: CMIP6 simulations under the SSP2‑4.5 scenario (medium mitigation) consistently project 0.3–0.5°C additional warming by 2040.
- Extreme‑event trends: The World Meteorological Organization reports a 5% per decade increase in the probability of heat‑related mortality events globally.
These observations and models converge on the conclusion that warming will continue, with regional variations driven by geography and local emissions.
Main Causes or Drivers
Direct Human Drivers
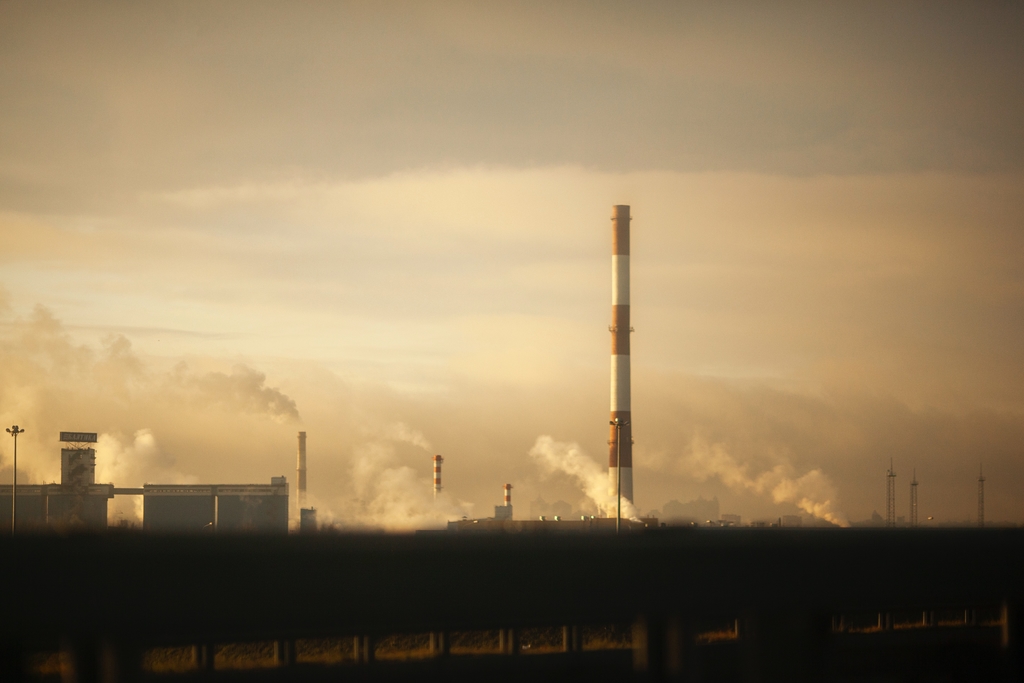
Burning of fossil fuels for energy, transportation, and industry accounts for roughly 75% of global CO₂ emissions (IEA, 2022). Deforestation and land‑use change add another 10% by reducing carbon sinks.
Underlying Socio‑Economic Drivers
Population growth, urbanization, and rising per‑capita energy demand create structural pressure on the energy system. Economic incentives that favor cheap, carbon‑intensive fuels amplify emissions.
Amplifying Natural Factors
Natural variability, such as El Niño‑Southern Oscillation cycles, can temporarily enhance or mask the underlying warming trend but does not drive the long‑term increase.
Environmental and Human Impacts
Environmental Impacts
- Heat stress on ecosystems: Terrestrial and marine species experience reduced habitat suitability; coral bleaching events have increased threefold since 1998.
- Water cycle intensification: Higher evaporation rates lead to more intense rainfall in some regions and prolonged drought in others.
- Sea‑level rise: Global mean sea level is rising at about 3.3 mm per year (NASA, 2022), threatening low‑lying coastlines.
- Biodiversity loss: The IPCC estimates that up to 30% of species could face heightened extinction risk by 2050 if current trends continue.
Human Health and Social Impacts
- Heat‑related mortality is projected to increase, especially among older adults and outdoor workers.
- Air‑quality degradation from higher ozone formation will exacerbate respiratory diseases.
- Water‑borne diseases may spread as flooding contaminates drinking supplies.
Economic and Infrastructure Impacts
- Extreme weather events cause an estimated $150 billion in global economic losses per year (World Bank, 2021).
- Coastal infrastructure faces rising flood risk, prompting costly adaptation measures such as sea walls or managed retreat.
- Agricultural yield variability could reduce global grain production by up to 5% under moderate warming, raising food prices.
Regional Differences
Impact patterns differ markedly:
- Arctic and sub‑Arctic: Temperatures rise at roughly twice the global average, accelerating permafrost thaw and ice‑sheet melt.
- Sub‑Saharan Africa: Projected decreases in summer rainfall increase drought risk and threaten rain‑fed agriculture.
- Southeast Asia: Sea‑level rise combined with monsoon intensification raises flood exposure for densely populated river deltas.
- Western United States: More frequent heatwaves and reduced snowpack affect water availability for agriculture and cities.
These examples illustrate that while the underlying warming is global, local outcomes depend on geography, socio‑economic vulnerability, and adaptive capacity.
What Scientists Know With High Confidence
- Human activities are the dominant cause of observed warming since the mid‑20th century.
- Global mean temperature will continue to rise as long as atmospheric GHG concentrations increase.
- Extreme heat events and heavy precipitation will become more common worldwide.
- Sea level is rising due to thermal expansion and melting ice, and the trend will continue.
What Remains Uncertain
Key uncertainties include the speed of ice‑sheet loss in Antarctica and Greenland, the magnitude of climate feedbacks from permafrost carbon, and the precise regional precipitation responses under different emission pathways. These gaps stem from limited long‑term observations, model resolution constraints, and unknown future socio‑economic choices. Improved satellite monitoring and higher‑resolution Earth system models are expected to reduce these uncertainties over the coming decade.
Common Misconceptions
Misconception: Climate change will only affect the far future.
Reality: Observable impacts—such as record heatwaves and shifting rainfall patterns—are already occurring and will intensify within the next 20 years.
Misconception: Only tropical regions will suffer.
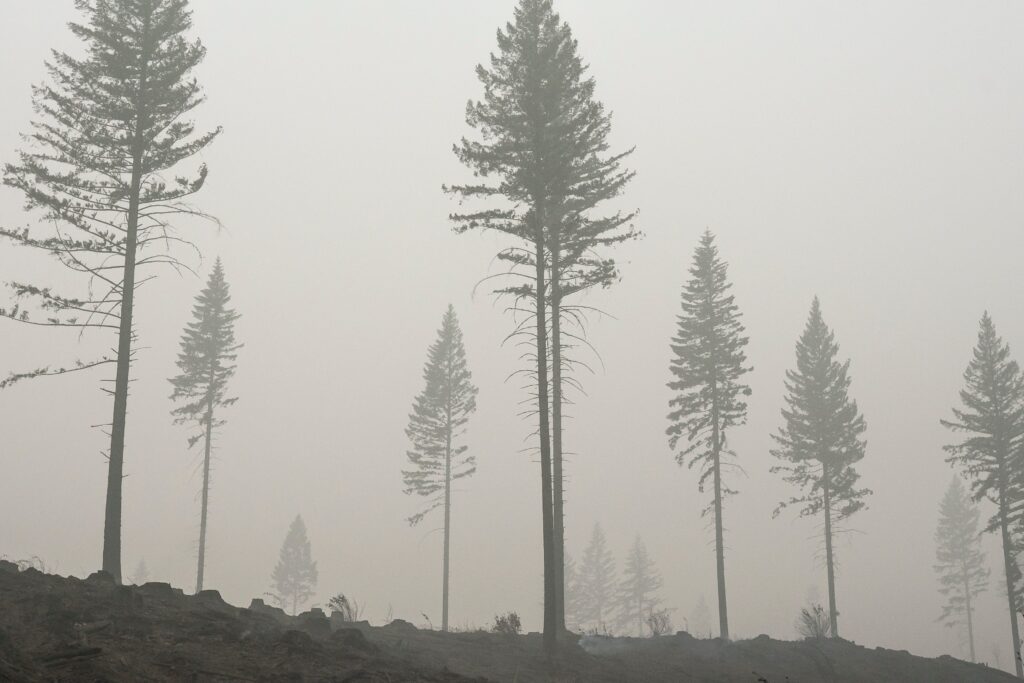
Reality: Mid‑latitude and polar regions are experiencing faster warming rates, leading to permafrost thaw and increased wildfire risk.
Misconception: Reducing personal energy use can stop climate change.
Reality: Individual actions matter for personal carbon footprints, but systemic decarbonization of energy, industry, and land use is required to limit warming.
Solutions and Limitations
Effective responses combine mitigation (reducing GHG emissions) and adaptation (preparing for unavoidable changes). Key strategies include:
- Rapid decarbonization of electricity: Shifting to wind, solar, and nuclear can cut emissions, but requires grid upgrades and storage solutions; cost trajectories are improving but remain region‑specific.
- Energy efficiency: Upgrading buildings and industrial processes yields immediate emissions reductions, yet financing and policy incentives vary.
- Reforestation and forest protection: Enhances carbon sinks but is limited by land‑use competition and long maturation periods.
- Climate‑resilient agriculture: Practices such as drought‑tolerant crops and precision irrigation reduce vulnerability, though adoption depends on farmer resources and extension services.
- Infrastructure adaptation: Elevating roads, improving drainage, and designing flood‑resilient housing protect communities, but require substantial capital and long planning horizons.
Each solution carries trade‑offs: large‑scale renewable deployment needs mineral resources; bioenergy may compete with food production; coastal defenses can shift risk downstream. A balanced portfolio, guided by cost‑benefit analysis and equity considerations, is essential.
What Individuals, Communities, and Governments Can Do
What Individuals Can Do
- Choose low‑carbon transportation options (public transit, cycling, electric vehicles) where feasible.
- Reduce household energy use through insulation, efficient appliances, and smart thermostats.
- Support policies and candidates that prioritize climate mitigation and adaptation funding.
- Participate in local tree‑planting or watershed protection projects.
What Communities and Organizations Can Do
- Develop community climate action plans that map local hazards and prioritize vulnerable groups.
- Invest in green infrastructure (e.g., permeable pavements, urban forests) to manage stormwater.
- Facilitate climate‑smart agricultural training for smallholder farmers.
What Governments Can Do
- Implement carbon pricing or emissions trading schemes to internalize climate costs.
- Set ambitious renewable‑energy targets and phase out coal subsidies.
- Fund research and monitoring networks for glaciers, permafrost, and extreme events.
- Enforce building codes that require climate‑resilient design in flood‑prone zones.
- Support international water‑governance agreements to manage transboundary resources.
Future Outlook
In summary, the next two decades will see continued warming, more frequent extremes, and escalating pressures on water, food, and health systems. High‑confidence science confirms the direction of change, while uncertainties remain around the pace of ice‑sheet loss and regional precipitation patterns. Mitigation actions that curb emissions, paired with adaptation measures that protect vulnerable populations, will determine whether the world faces manageable adjustments or severe disruptions after 2045. The window for decisive action is narrowing, but the same window offers the opportunity to steer the climate trajectory toward a more resilient future.
Frequently Asked Questions
How much is the global temperature expected to rise by 2045?
Under current policy pathways, the Intergovernmental Panel on Climate Change projects an additional 0.3 to 0.5 °C increase in global average temperature by the mid‑2040s compared with the 2020 baseline.
Which regions will experience the greatest temperature increase?
The Arctic and sub‑Arctic regions are warming at roughly twice the global average, while mid‑latitude and tropical regions also see significant rises, leading to amplified heat stress and ice‑sheet melt.
What are the main drivers of climate change over the next two decades?
The primary drivers are continued emissions of carbon dioxide from fossil‑fuel combustion, methane from agriculture and waste, and land‑use changes that reduce carbon sinks, all amplified by feedbacks such as water‑vapour and albedo changes.
How will water security be affected by climate change by 2045?
Intensified evaporation and altered precipitation patterns will increase flood risk in some areas while causing prolonged droughts in others, leading to heightened water scarcity for agriculture, industry, and households, especially in already vulnerable regions.
What actions can governments take to limit climate impacts in the next 20 years?
Governments can implement carbon pricing, set renewable‑energy targets, phase out coal subsidies, enforce climate‑resilient building codes, fund research and monitoring, and support international water‑governance agreements to reduce emissions and enhance adaptation.







Leave a Comment