
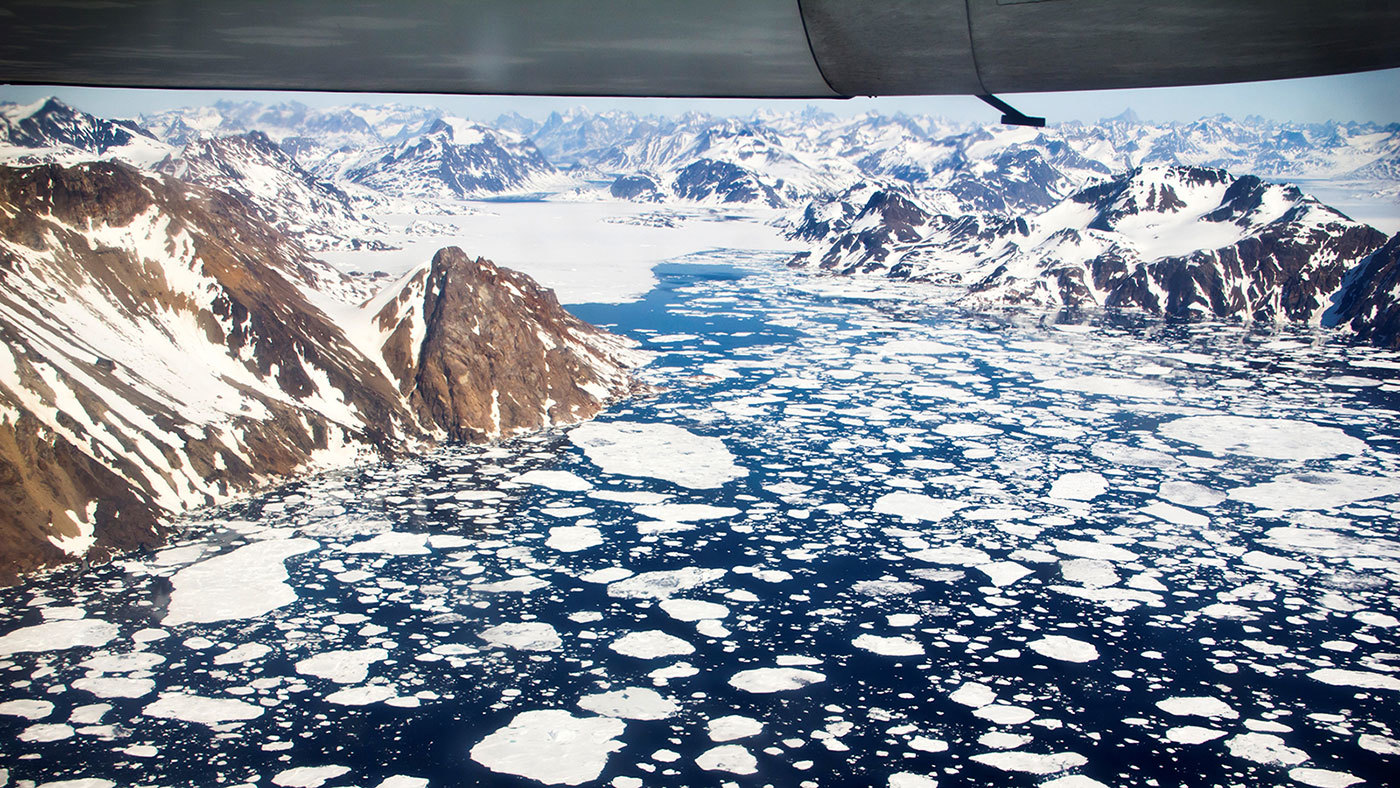
Glaciers in Greenland and Antarctica are melting six times faster than in the 1990s because rising air and ocean temperatures accelerate surface and basal melt, threatening sea‑level rise and polar ecosystems.
Quick Answer
Glaciers on Greenland and Antarctica are losing ice at a rate roughly six times greater than in the 1990s. The primary driver is anthropogenic warming, which raises atmospheric temperatures and warms the surrounding oceans. This dual heating speeds surface melt, deepens basal melting, and destabilises ice shelves, leading to faster ice flow into the sea. The most immediate impact is an accelerated contribution to global sea‑level rise, though uncertainties remain in regional projections.
Key Takeaways
- Ice loss in both polar regions has increased about sixfold since the early 1990s.
- Atmospheric warming and oceanic heat uptake are the dominant mechanisms.
- Accelerated melt contributes roughly 0.8 mm per year to global sea level, according to the IPCC AR6 (2021).
- Ice‑shelf collapse and surface darkening amplify melt rates.
- High‑confidence findings include rapid warming of polar air and oceans; major uncertainties involve future ice‑sheet dynamics.
- Mitigation requires deep emissions cuts; adaptation focuses on resilient coastal planning.
What Is Why Greenland and Antarctica’s Glaciers Are Melting Six Times Faster?
The phrase describes a measurable acceleration in the rate at which the Greenland Ice Sheet and the Antarctic Ice Sheet lose mass. It compares the average annual ice‑loss rates recorded in the 1990s (approximately 0.1 mm yr⁻¹ for Greenland and 0.05 mm yr⁻¹ for Antarctica) with rates observed in the 2010s and early 2020s, which are about six times larger. The term is distinct from short‑term weather events; it reflects a sustained climate‑driven trend.
How Does It Work?
Atmospheric Warming
Global mean surface temperature has risen by about 1.1 °C since pre‑industrial times (IPCC AR6, 2021). Polar amplification means the Arctic is warming at roughly twice the global average, while parts of Antarctica experience similar acceleration due to changing wind patterns. Warmer air raises the melt‑season temperature, extending the period during which surface ice can melt and refreeze.
Oceanic Heat Transfer
Warmer circumpolar and Atlantic waters intrude onto continental shelves and under ice shelves. Heat carried by relatively thin layers of ocean water can melt ice from below—a process called basal melting. Satellite altimetry and autonomous floats have documented increasing ocean temperatures of 0.2–0.3 °C per decade near the grounding lines of major Antarctic glaciers (British Antarctic Survey, 2020).
Ice‑Shelf Collapse and Dynamic Acceleration
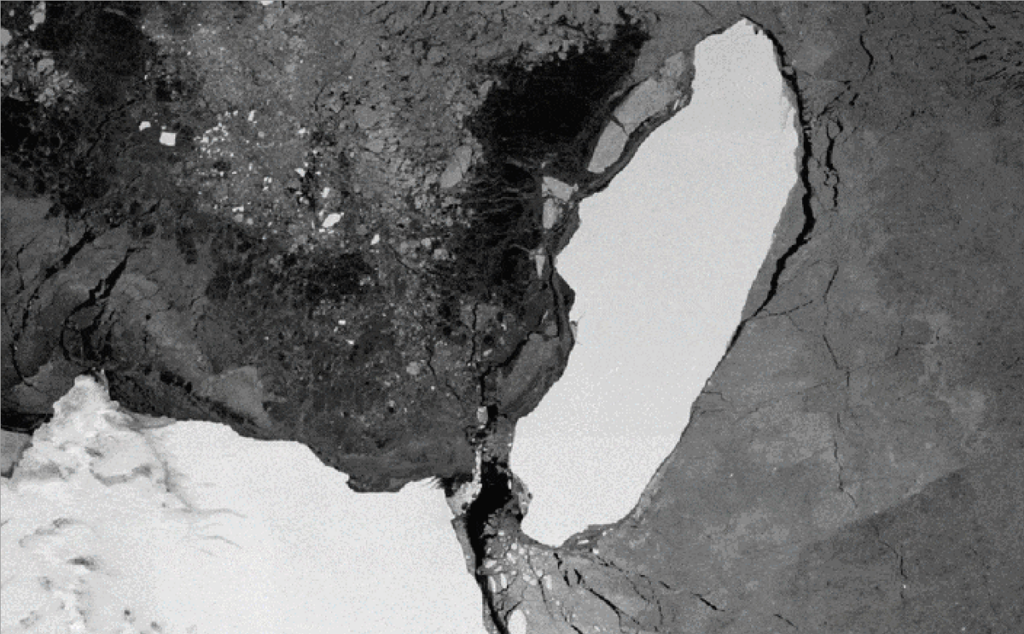
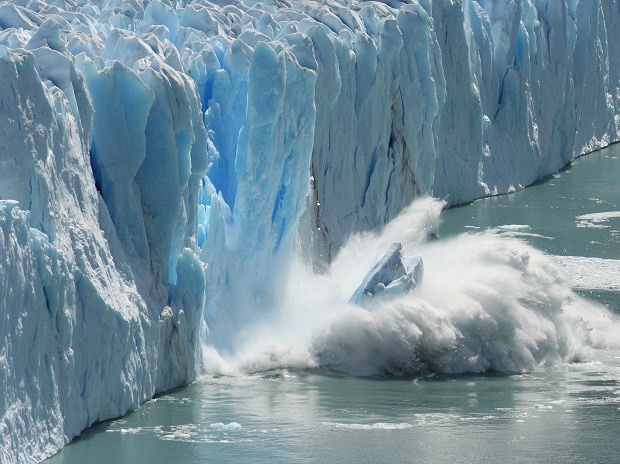
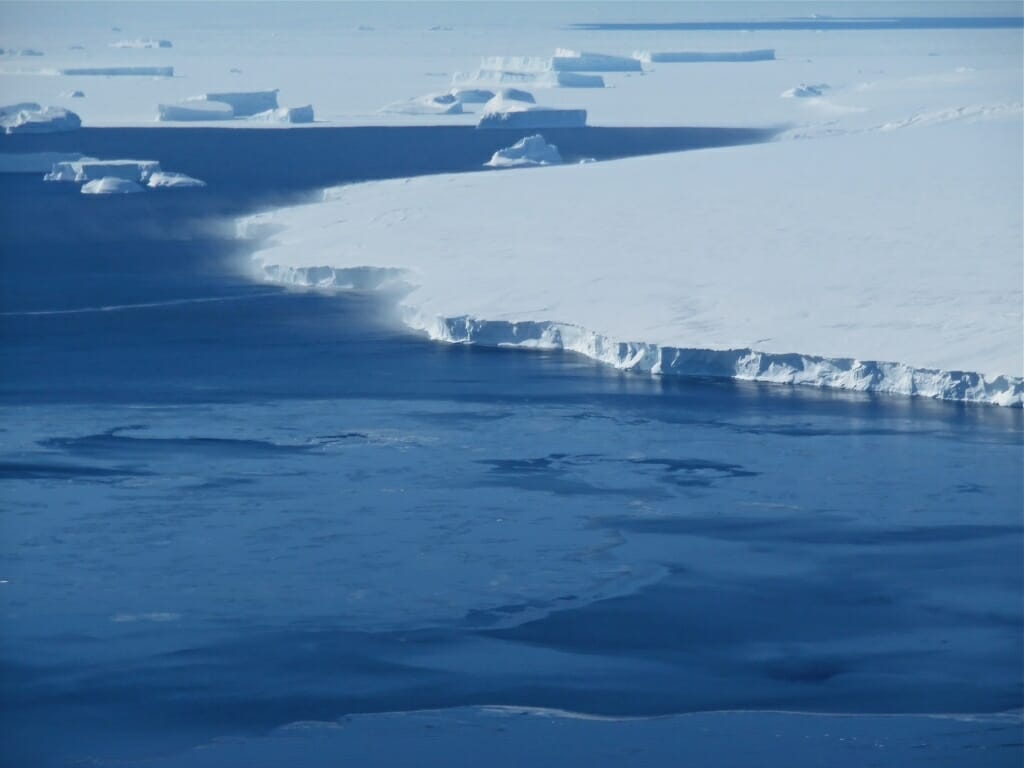
Ice shelves buttress the flow of inland ice. When a shelf thins or calves, the restraining force weakens, allowing glaciers to accelerate toward the sea. The 2017‑2020 collapse of the Larsen C ice shelf, for example, increased the flow speed of the adjacent glacier by up to 30 % (NASA, 2021).
Surface Darkening (Albedo Change)
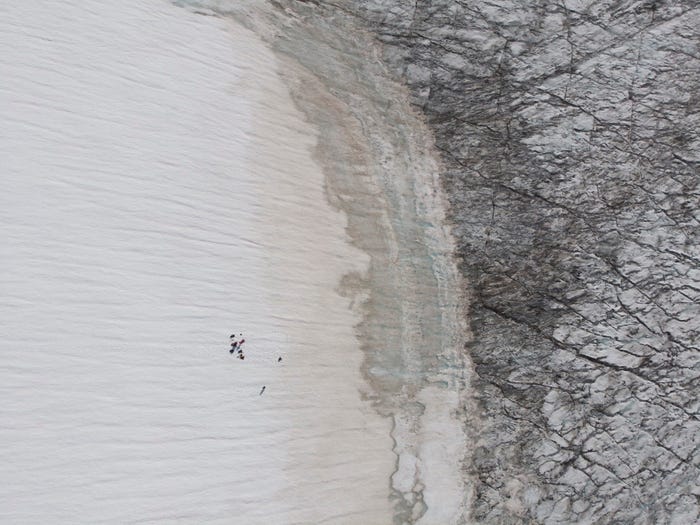
Soot, dust, and melt‑water impurities settle on the ice surface, reducing its albedo. A darker surface absorbs more solar radiation, enhancing melt. Field measurements in Greenland show that albedo reductions of 0.1 can increase melt rates by 20 % during peak summer (University of Copenhagen, 2019).
What Does the Evidence Show?
Multiple independent data streams converge on the six‑fold acceleration conclusion. Satellite gravimetry (GRACE and GRACE‑FO) records mass loss of 280 Gt yr⁻¹ for Greenland and 150 Gt yr⁻¹ for Antarctica during 2002‑2020, compared with roughly 30–40 Gt yr⁻¹ in the 1990s. Air‑borne laser altimetry confirms surface lowering of up to 3 m per decade in hotspot regions. Ocean temperature records from Argo floats and research vessels demonstrate a consistent warming trend that correlates spatially with regions of rapid basal melt. Peer‑reviewed synthesis papers (e.g., Rignot et al., 2020) assess these observations and attribute the majority of the acceleration to anthropogenic warming.
Main Causes or Drivers
Direct Causes
- Increased atmospheric temperature leading to enhanced surface melt.
- Rising ocean temperatures causing basal melt of marine‑terminating glaciers.
- Loss of ice‑shelf buttressing that permits faster glacier flow.
Underlying Drivers
- Continued greenhouse‑gas emissions that trap infrared radiation.
- Changes in large‑scale atmospheric circulation (e.g., the Southern Annular Mode) that bring warmer air masses poleward.
- Enhanced ocean heat transport via altered wind stress patterns.
Amplifying Factors
- Surface darkening from black carbon and dust.
- Feedback loops where melt‑water lubricates glacier bases, further accelerating flow.
- Structural weakening of ice shelves from repeated calving events.
Environmental and Human Impacts
Environmental Impacts
Accelerated melt adds roughly 0.8 mm yr⁻¹ to global sea level, a rate that could rise to 2 mm yr⁻¹ by 2100 under high‑emission scenarios (IPCC AR6). Freshwater influx modifies ocean salinity, potentially affecting the Atlantic Meridional Overturning Circulation. Loss of sea ice and ice shelves reduces habitat for species such as krill, seals, and polar bears, reshaping Antarctic and Arctic food webs.
Human Impacts
Coastal regions worldwide face higher flood risk, increased storm‑surge heights, and salt‑water intrusion into freshwater aquifers. Low‑lying island nations and deltaic cities (e.g., Bangkok, New Orleans) may experience displacement of populations. Economic sectors reliant on coastal infrastructure—shipping, tourism, real estate—could incur billions of dollars in adaptation costs.
Regional Differences
Greenland’s melt is dominated by surface processes, especially in the southwest where summertime temperatures regularly exceed 0 °C. In contrast, West Antarctica’s contribution is largely driven by basal melt under the Pine Island and Thwaites glaciers, where warm Circumpolar Deep Water reaches grounding lines. The Eastern Antarctic interior remains relatively stable, highlighting the importance of regional oceanic pathways.
What Scientists Know With High Confidence
- Global atmospheric and oceanic temperatures are rising due to human greenhouse‑gas emissions.
- Polar amplification causes faster warming in the Arctic and parts of Antarctica.
- Ice‑sheet mass loss from Greenland and Antarctica has increased substantially since the 1990s.
- Sea‑level contribution from polar ice melt is a major component of observed sea‑level rise.
What Remains Uncertain
Key uncertainties include the precise response of deep‑ice dynamics to continued warming, the potential for rapid, nonlinear collapse of major Antarctic ice shelves, and the magnitude of future ocean heat transport pathways. Improved high‑resolution modeling and expanded observational networks (e.g., satellite laser altimetry, autonomous sub‑ice vehicles) are needed to narrow these gaps.
Common Misconceptions
Misconception: The melt is caused only by natural climate cycles.
Reality: While natural variability influences short‑term fluctuations, the long‑term acceleration aligns with the unprecedented rise in greenhouse gases and is documented in multiple IPCC assessments.
Misconception: Only Antarctica is responsible for sea‑level rise.
Reality: Greenland contributes roughly 60 % of the recent polar ice‑mass loss, with Antarctica adding the remaining share; both are critical.
Misconception: Ice‑shelf collapse instantly raises sea level.
Reality: Ice shelves are already floating, so their loss does not directly add water. However, their collapse removes a buttressing force, allowing grounded ice to flow faster into the ocean, which does raise sea level.
Solutions and Limitations
Mitigation strategies focus on rapid decarbonisation: transitioning to renewable electricity, improving energy efficiency, and phasing out coal. Adaptation includes building higher coastal defenses, implementing managed retreat, and preserving wetlands that buffer storm surges. Monitoring advances—such as satellite gravimetry and autonomous ocean sensors—provide early warning but cannot halt melt without emissions reductions. Limitations involve political feasibility, financing for vulnerable nations, and the long response time of ice sheets to temperature changes.
What Individuals, Communities, and Governments Can Do
What Individuals Can Do
- Reduce personal carbon footprints by using public transport, conserving energy, and supporting low‑carbon products.
- Advocate for strong climate policies through voting and community engagement.
- Support organizations that fund polar research and climate mitigation.
What Communities and Organizations Can Do
- Develop and enforce resilient zoning that discourages construction in high‑risk flood zones.
- Invest in green infrastructure, such as permeable surfaces and coastal wetlands.
- Participate in citizen‑science programs that monitor local sea‑level changes.
What Governments Can Do
- Implement nationally determined contributions (NDCs) that aim for net‑zero emissions by mid‑century.
- Fund long‑term polar observation programs and open data platforms.
- Provide financial mechanisms for climate‑displaced populations and low‑lying nations.
Closing Synthesis
Greenland and Antarctic glaciers are melting six times faster than in the 1990s because rising air and ocean temperatures intensify both surface and basal melt processes. Robust observations from satellites, airborne surveys, and oceanic measurements confirm this acceleration, and high‑confidence science links it to anthropogenic warming. While uncertainties remain in the precise future behaviour of ice‑sheet dynamics, the evidence is clear: continued emissions will amplify sea‑level rise and threaten polar ecosystems. Effective solutions combine rapid emissions cuts, targeted adaptation, and sustained monitoring, with coordinated action from individuals to governments.
Frequently Asked Questions
What does “six times faster” mean for glacier melt rates?
It means the average annual ice‑loss rate measured in the 2010s and 2020s is about six times higher than the rate recorded in the 1990s, based on satellite gravimetry and altimetry data.
How does ocean warming affect Antarctic ice shelves?
Warmer ocean water reaches the underside of marine‑terminating ice shelves, melting them from below (basal melt). This thinning reduces buttressing, allowing the grounded ice behind the shelf to flow more quickly into the sea.
Which regions are most at risk from sea‑level rise caused by polar melt?
Low‑lying coastal areas worldwide are vulnerable, especially islands in the Pacific, the Nile Delta, and major cities such as Miami, New York, and Bangkok, where even modest sea‑level increases can amplify flooding and storm surges.
What are the biggest uncertainties in projecting future glacier melt?
Uncertainties centre on how ice‑sheet dynamics will respond to continued warming, the potential for rapid ice‑shelf collapse, and future pathways of ocean heat transport. Improved modeling and more extensive observations are needed to reduce these gaps.
What actions can governments take to reduce glacier loss?
Governments can enact strong climate policies to cut greenhouse‑gas emissions, fund long‑term polar monitoring, and invest in coastal adaptation measures such as sea‑walls and managed retreat plans for vulnerable communities.





Leave a Comment