
Wind power supplies a modest but growing share of global energy, accounting for about 7% of electricity generation and roughly 3% of total primary energy in 2022, highlighting its role in the clean‑energy transition.
Quick Answer
Wind energy contributes around 7% of the world’s electricity production and about 3% of total primary energy supply, according to the International Energy Agency’s 2023 World Energy Outlook. The technology converts kinetic energy from atmospheric motion into electricity using turbines, which feed power into national grids. This share is rising thanks to falling turbine costs, supportive policies, and expanding offshore projects, but variability in wind patterns means that additional storage and grid upgrades are needed to maintain reliability. The exact percentage can shift slightly each year as new capacity comes online and data are updated.
Key Takeaways
- Wind power provides roughly 7% of global electricity and about 3% of total primary energy (IEA, 2023).
- Technological advances and cost reductions have driven a steady increase in installed capacity over the past two decades.
- Intermittency requires complementary storage, demand‑response, and grid‑integration strategies.
- Regional contributions vary widely; Europe and China lead in installed capacity, while many low‑income regions have limited wind resources.
- High‑confidence findings show wind reduces greenhouse‑gas emissions, creates jobs, and improves energy security, yet uncertainties remain around long‑term storage costs and land‑use trade‑offs.
What Is the Share of Global Energy from Wind?
The phrase “percentage of the world’s energy comes from wind” refers to the proportion of total energy—either electricity generation or primary energy supply—that is produced by wind turbines. Primary energy includes all fuels used before conversion (e.g., coal, oil, natural gas, renewables). Wind’s contribution is measured by aggregating the output of all operational wind farms and comparing it to total global energy statistics compiled by agencies such as the International Energy Agency (IEA) and the International Renewable Energy Agency (IRENA).
Wind differs from solar or hydro in that it relies on atmospheric motion rather than sunlight or water flow, and its output fluctuates on timescales from seconds to seasons. Understanding its share helps policymakers gauge progress toward decarbonisation targets and assess the need for complementary technologies.
How Does Wind Energy Work?
Physical Conversion Process
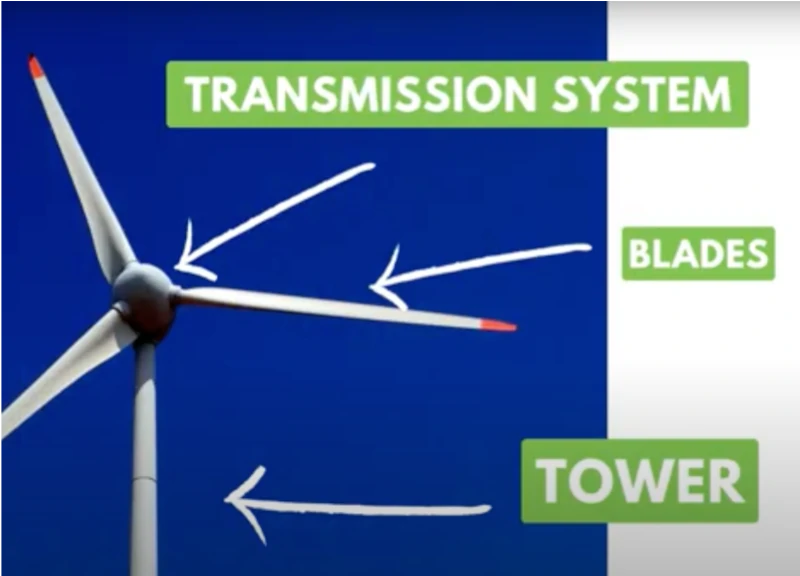
- Wind blows across turbine blades, creating lift that spins a rotor.
- The rotor turns a low‑speed shaft connected to a gearbox, which increases rotational speed.
- The high‑speed shaft drives a generator that converts mechanical energy into electrical energy.
- Power electronics condition the electricity (e.g., convert to grid frequency) before feeding it into the transmission system.
Grid Integration
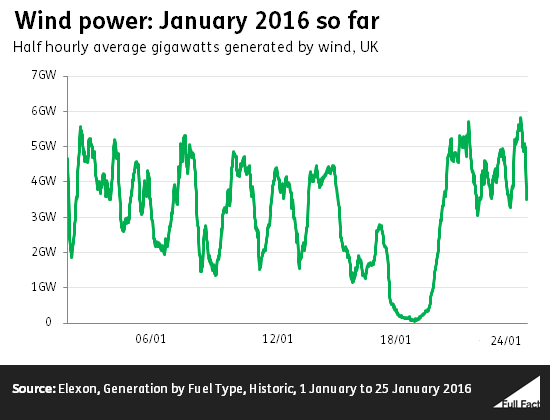
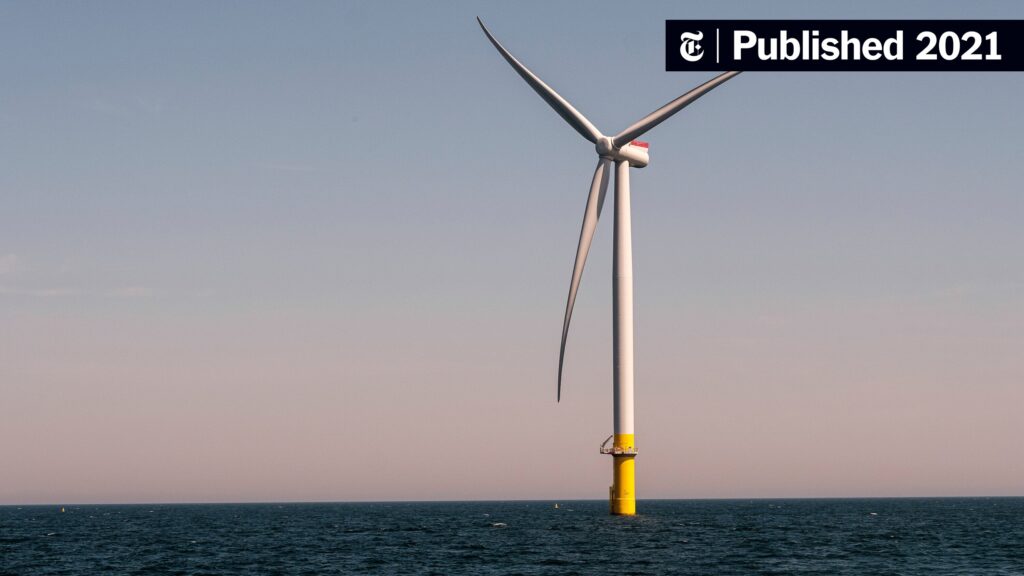
Once generated, wind power enters the local or regional grid. Because wind is variable, system operators use forecasting, flexible generation (e.g., gas peakers), demand‑side management, and increasingly battery or pumped‑hydro storage to balance supply and demand. Offshore wind farms benefit from stronger, more consistent winds but require subsea cabling and specialized installation vessels.
What Does the Evidence Show?
Multiple independent assessments converge on similar figures for wind’s share of the global energy mix. The IEA’s 2023 World Energy Outlook reports that wind accounted for 7.0% of total electricity generation in 2022, up from 4.5% in 2010. IRENA’s 2022 Renewable Capacity Statistics estimate that wind supplied about 3.2% of total primary energy in the same year. Both sources base their numbers on national reporting, satellite‑derived generation data, and statistical modelling, providing strong observational confidence.
Long‑term trends show a compound annual growth rate of roughly 10% in installed wind capacity since 2000, driven by larger turbine designs (up to 12 MW offshore) and economies of scale in manufacturing. These trends are corroborated by peer‑reviewed meta‑analyses of renewable deployment (e.g., Lund et al., 2021) that highlight cost declines of over 60% per megawatt‑hour since the early 2000s.
Main Causes or Drivers
Policy and Market Incentives
Feed‑in tariffs, renewable portfolio standards, and auction mechanisms have lowered investment risk, encouraging private capital to fund wind projects.
Technology Improvements
Advances in blade aerodynamics, higher hub‑height towers, and better power electronics have increased capacity factors from an average of 25% to over 40% for modern offshore farms.
Economic Factors
Levelised cost of electricity (LCOE) for wind has fallen below that of new coal or gas plants in many regions, making wind competitive without subsidies.
Environmental and Human Impacts
Environmental Impacts
Wind turbines generate electricity without combustion, avoiding CO₂ emissions of roughly 1.5 t per MWh compared with coal. Life‑cycle assessments show that wind’s greenhouse‑gas intensity is among the lowest of all energy sources (<10 g CO₂‑eq/kWh). However, turbine siting can affect bird and bat mortality, especially along migration corridors, and large offshore farms may alter marine habitats.
Human Health and Social Impacts
By displacing fossil‑fuel generation, wind reduces air pollutants such as particulate matter (PM₂.₅) and sulfur dioxide, which are linked to respiratory and cardiovascular diseases. Community ownership models in Denmark and parts of the United States have demonstrated that local revenue sharing can increase public acceptance and support.
Economic and Infrastructure Impacts
The global wind industry employed over 1.2 million people in 2022 (IRENA), spanning manufacturing, installation, operation, and maintenance. Grid reinforcement and transmission upgrades are required to move power from often remote, high‑wind sites to demand centres, representing significant capital investment.
Regional Differences
Europe leads in offshore wind, with the United Kingdom, Germany, and the Netherlands contributing more than 30 GW of offshore capacity, accounting for roughly 10% of the continent’s electricity in 2022. China dominates onshore wind, hosting over 300 GW, yet its share of national electricity remains near 6% because of the country’s massive total demand. The United States has about 140 GW of installed wind, supplying roughly 9% of its electricity, with the Midwest and Texas being the most wind‑rich states. In contrast, many low‑income African nations have limited wind resources and face financial and technical barriers to large‑scale deployment.
What Scientists Know With High Confidence
What Scientists Know With High Confidence
- Wind energy reduces greenhouse‑gas emissions when it displaces fossil‑fuel generation.
- Cost reductions in turbine technology have made wind competitive in many markets without subsidies.
- Global wind capacity has grown at a double‑digit annual rate for more than a decade.
- Integrating wind power requires complementary flexible resources (storage, demand response) to maintain grid stability.
What Remains Uncertain
What Remains Uncertain
Key uncertainties include the future cost trajectory of large‑scale storage, the environmental impact of extensive offshore farms on marine ecosystems, and the speed at which emerging markets can secure financing and technical expertise for wind projects. Data gaps also exist in long‑term turbine performance under extreme weather events, which could affect reliability assessments.
Common Misconceptions
Common Misconceptions
Misconception: Wind turbines generate electricity 24/7.
Reality: Wind output depends on wind speed; capacity factors typically range from 25% (onshore) to 50% (offshore), meaning turbines produce electricity only a fraction of the time.
Misconception: Wind farms cause significant climate change.
Reality: The lifecycle emissions of wind are among the lowest of all energy sources, and the net effect is a substantial reduction in CO₂ compared with fossil fuels.
Misconception: Wind energy is always more expensive than fossil fuels.
Reality: In many regions, the levelised cost of wind electricity is lower than new coal or gas plants, especially when accounting for carbon pricing or health externalities.
Misconception: Wind turbines kill large numbers of birds.
Reality: While turbine collisions do occur, scientific studies show that well‑sited turbines cause far fewer bird deaths than other human structures such as buildings or vehicles.
Solutions and Limitations
Expanding wind capacity remains a cornerstone of decarbonisation, but several trade‑offs must be managed:
- Energy Storage: Batteries and pumped‑hydro can smooth variability, yet current storage costs may limit rapid scaling.
- Transmission Expansion: New high‑voltage lines are needed to connect remote wind resources, but land‑use conflicts and permitting delays can slow projects.
- Offshore Development: Offers stronger winds and less visual impact, but requires substantial upfront capital and specialized installation vessels.
- Land‑Use Competition: Large onshore farms may compete with agriculture or conservation goals; careful site selection and multi‑use approaches (e.g., agrivoltaics) can mitigate conflicts.
What Individuals, Communities, and Governments Can Do
What Individuals Can Do
Support policies that incentivise renewable energy, choose electricity suppliers offering wind‑generated power, and participate in community‑owned wind projects where available.
What Communities and Organizations Can Do
Conduct local wind resource assessments, pursue cooperative ownership models, and partner with utilities to host small‑scale turbines on municipal buildings or schools.
What Governments Can Do
Implement clear, long‑term renewable targets; provide transparent auction mechanisms; fund research on storage and grid‑integration; and streamline permitting for both onshore and offshore wind.
What Businesses and Industries Can Do
Set renewable‑energy procurement goals, invest in corporate‑owned wind farms, and incorporate wind‑power forecasts into operational planning to reduce reliance on carbon‑intensive backup generation.
Looking Ahead
Wind energy currently supplies a modest share of global power, but its share is expected to rise as costs continue to fall, storage technologies improve, and policy frameworks strengthen. High‑confidence evidence confirms wind’s role in cutting emissions and creating jobs, while uncertainties around storage economics and ecological impacts guide future research. A coordinated effort across individuals, communities, industry, and governments will be essential to unlock wind’s full potential and move the world toward a low‑carbon energy future.
Frequently Asked Questions
How much of the world’s electricity is generated by wind?
Wind energy supplies roughly 7% of global electricity generation, according to the International Energy Agency’s 2023 data.
What percentage of total primary energy comes from wind?
Wind accounts for about 3% of the world’s total primary energy supply, reflecting its contribution beyond electricity to overall energy consumption.
Why does wind energy’s share vary between regions?
Regional differences stem from variations in wind resources, existing infrastructure, policy support, and investment capacity, with Europe and China leading in installed capacity.
What are the main challenges to expanding wind power?
Key challenges include intermittency, the need for storage and grid upgrades, high upfront costs for offshore projects, and land‑use or ecological concerns.
How can individuals support the growth of wind energy?
Individuals can choose electricity suppliers that source wind power, support policies that incentivize renewables, and participate in community‑owned wind projects where available.





Leave a Comment