
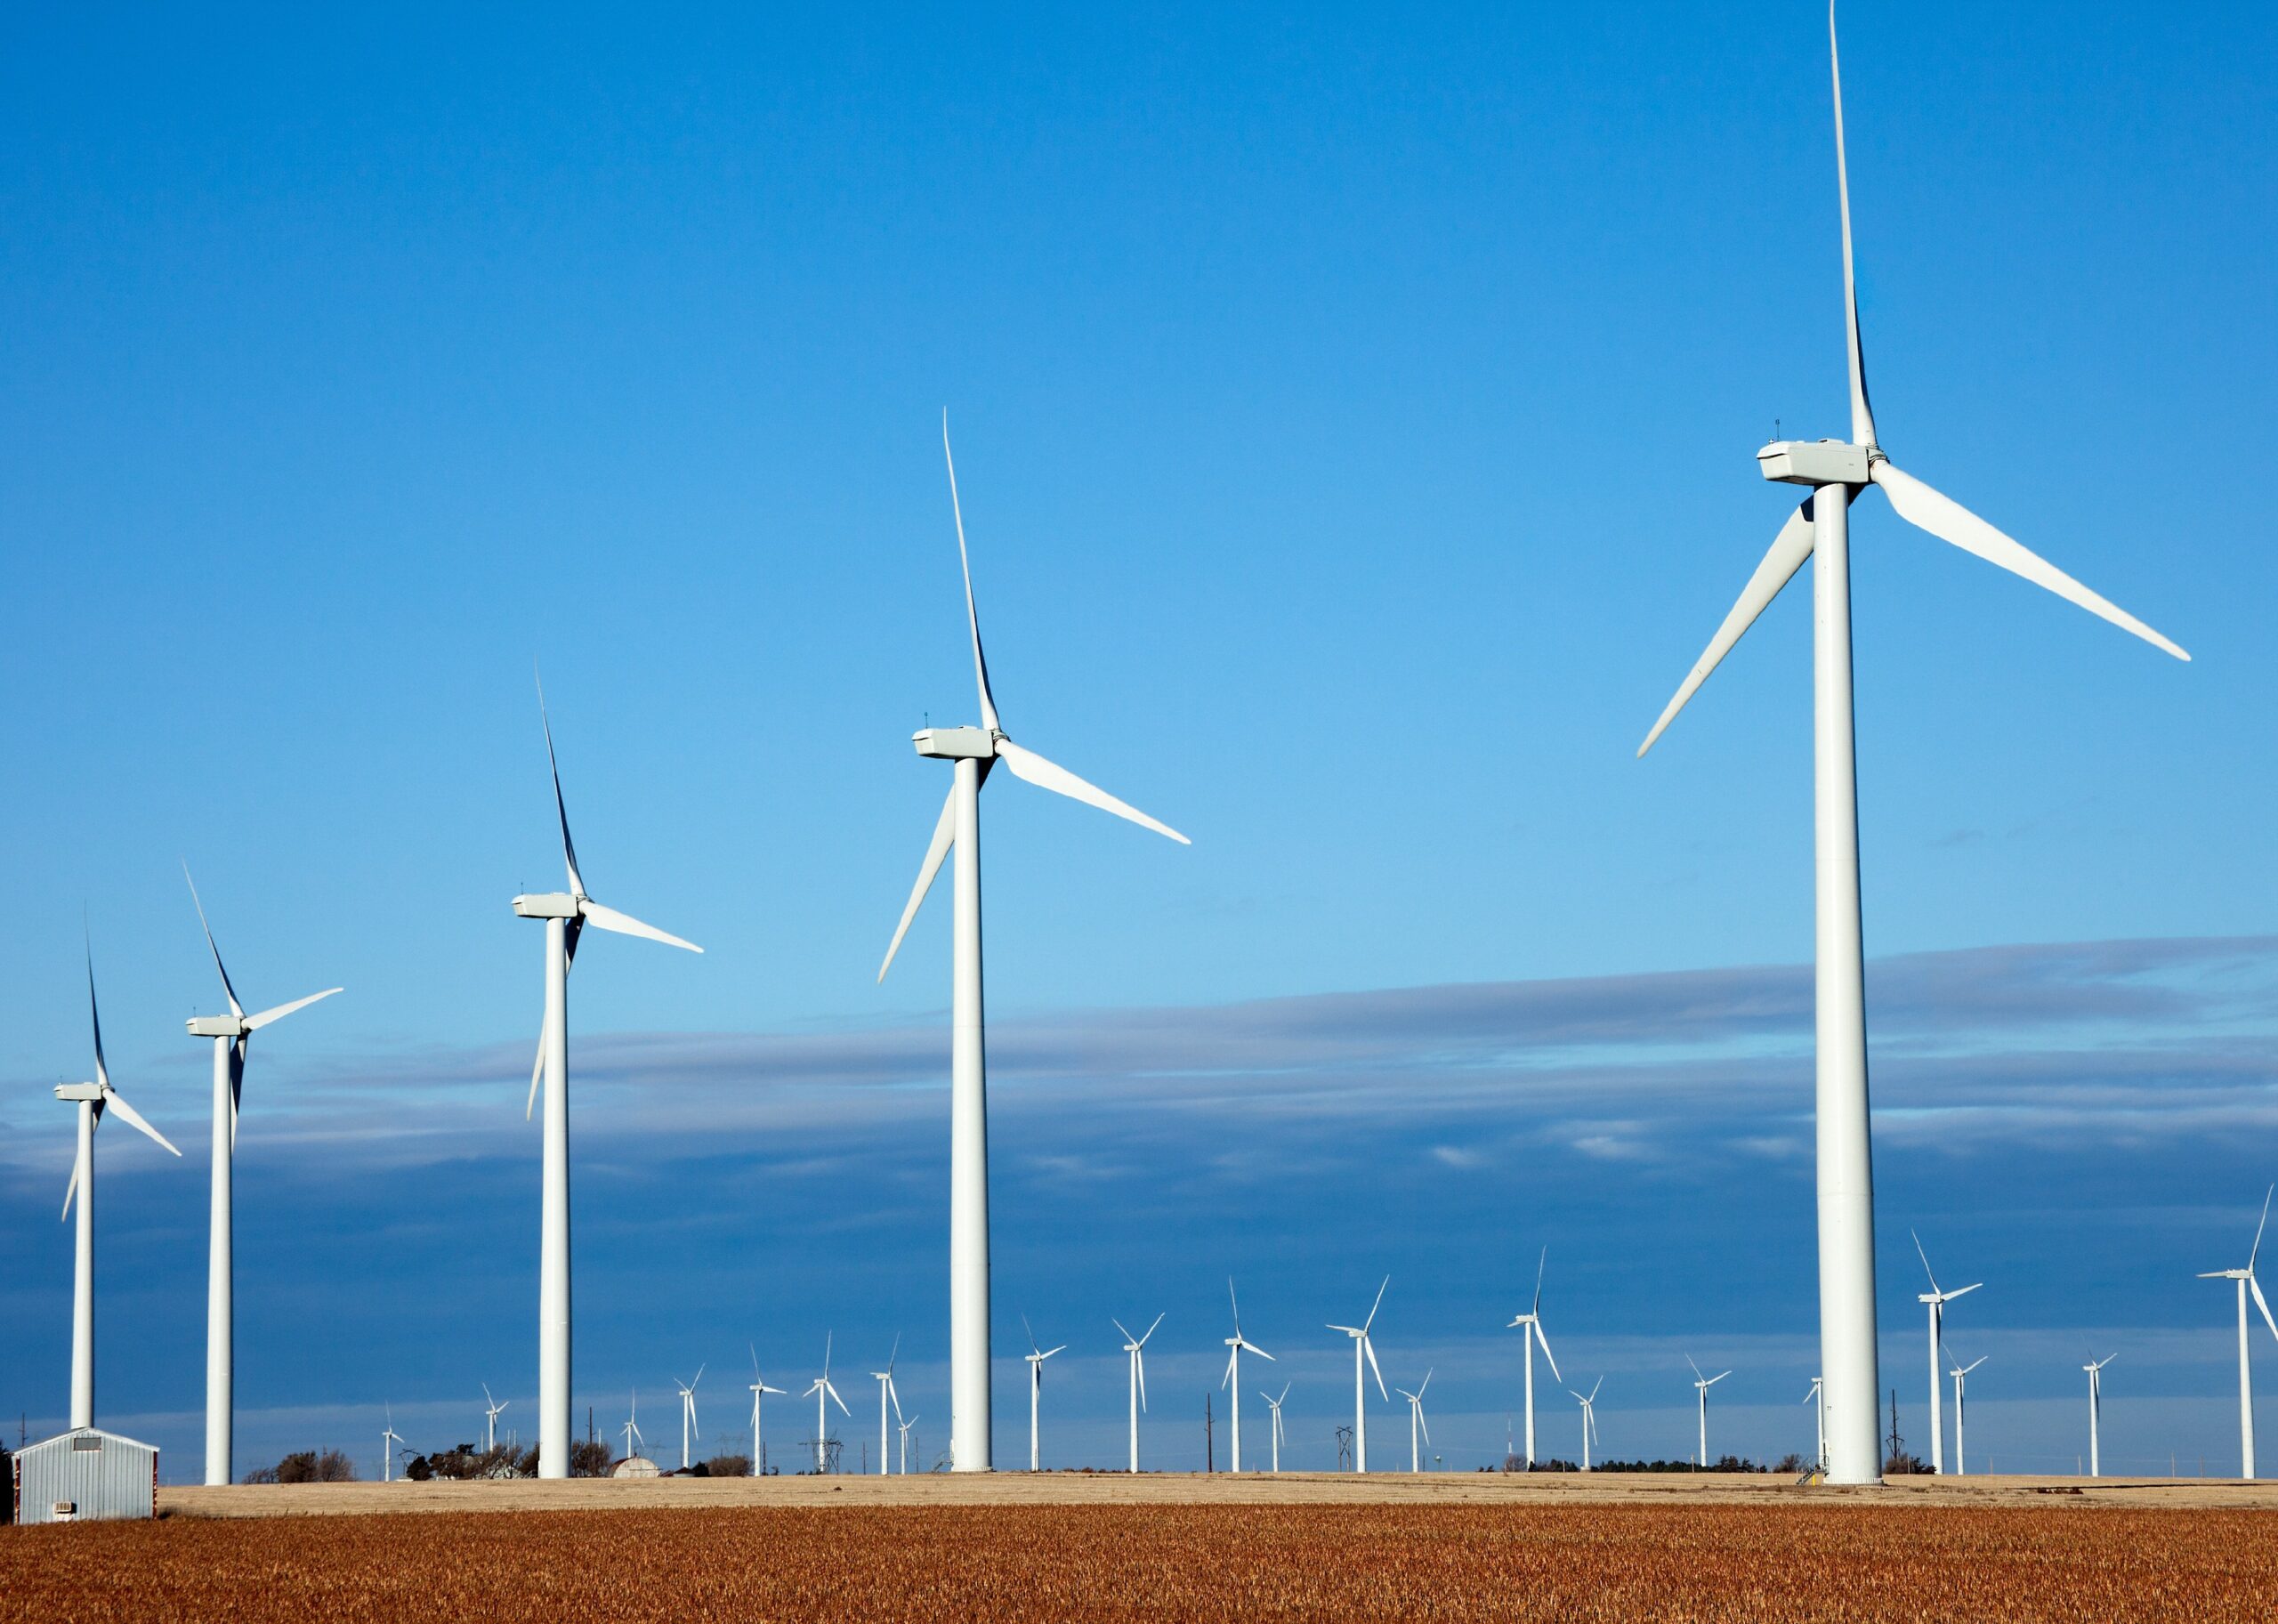
Kansas holds the greatest untapped wind power potential among U.S. states, offering hundreds of gigawatts of technically feasible capacity that could dramatically cut emissions if fully developed.
Quick Answer
Kansas ranks highest in the United States for untapped on‑shore wind power potential, with an estimated technical potential of roughly 600 GW of capacity that remains largely undeveloped. The state’s flat terrain, consistent wind speeds above 7 m/s at hub height, and relatively low population density create ideal conditions for large‑scale turbines. While policy, transmission infrastructure, and financing constraints limit current development, the scientific consensus is that unlocking even a fraction of this potential would significantly reduce carbon emissions and diversify the regional energy mix. Uncertainty remains around future market incentives and grid‑integration costs.
Key Takeaways
- Kansas possesses the largest amount of unexploited on‑shore wind capacity of any U.S. state (≈600 GW).
- High average wind speeds and extensive flat land make the state technically ideal for wind farms.
- Barriers include transmission bottlenecks, state policy incentives, and land‑use negotiations.
- Developing Kansas wind could cut national CO₂ emissions by up to 0.5 Gt yr⁻¹ if 30 % of the potential were built.
- Solutions involve coordinated federal‑state policy, grid upgrades, and community‑owned projects.
What Is Which U.S. State Has the Most Untapped Wind Power Potential??
The phrase refers to the comparative assessment of technical wind‑energy potential that exists but has not yet been installed as generating capacity. Technical potential estimates assume that wind turbines could be placed on land where wind speeds exceed a threshold (often 7 m/s at 80 m hub height) and where environmental, legal, and economic constraints are minimal. This differs from “installed capacity,” which counts turbines already built, and from “economic potential,” which adds cost‑competitiveness criteria. Identifying the state with the most untapped potential helps policy makers prioritize investments that yield the greatest clean‑energy returns.
How Does It Work?
Physical Basis of Wind Energy
Wind is the movement of air driven by pressure gradients created by solar heating. The kinetic energy of moving air can be captured by turbine blades, which convert it into rotational mechanical energy and then into electricity via a generator. The power available to a turbine is proportional to the cube of wind speed (P ∝ v³), making sites with higher average wind speeds exponentially more productive.
Assessing Technical Potential
- Collect long‑term wind‑speed data (typically 10‑year averages) from meteorological stations or lidar measurements.
- Map these data onto a grid (e.g., 1‑km resolution) and apply a speed threshold to identify viable cells.
- Estimate how many turbines could fit per cell, accounting for spacing (≈7 rotor diameters apart) and land‑use exclusions (urban areas, protected habitats).
- Multiply turbine capacity by the number of feasible sites to obtain total technical potential.
What Does the Evidence Show?
Multiple independent assessments converge on Kansas as the leading state for untapped wind potential. The National Renewable Energy Laboratory’s (NREL) 2022 “U.S. Wind Power Technical Potential” report estimates Kansas’ on‑shore potential at ~600 GW, placing it fourth in total potential after Texas, California, and North Dakota, but with a much lower share already installed (≈20 GW as of 2023). The U.S. Energy Information Administration (EIA) reports that wind generation in Kansas grew at an average annual rate of 12 % from 2010‑2022, yet the installed capacity remains a small fraction of the technical ceiling. Satellite‑derived wind‑resource maps from NOAA’s National Centers for Environmental Information corroborate the high‑speed corridors that run east‑west across the state.
Main Causes or Drivers
Natural Drivers
The Great Plains experience a persistent pressure gradient between the Gulf of Mexico and the Canadian Prairies, generating steady westerly winds. Kansas’ elevation (≈400‑1200 m) and lack of major topographic obstacles further reduce turbulence, yielding higher capacity factors (often >40 %).
Human Drivers
- Policy incentives: Federal Production Tax Credit (PTC) and state‑level Renewable Portfolio Standards (RPS) encourage investment.
- Transmission planning: The Western Electricity Coordinating Council’s interconnection queues influence where new farms can connect.
- Landowner agreements: Lease structures that share revenue with farmers affect project feasibility.
Environmental and Human Impacts
Environmental Impacts
Wind turbines emit no air pollutants during operation, displacing fossil‑fuel generation and reducing CO₂ emissions. Life‑cycle analyses (e.g., International Renewable Energy Agency, 2021) estimate that each megawatt‑hour of wind electricity avoids ~0.5 t of CO₂. Potential concerns include bird and bat mortality, which can be mitigated through siting away from migration corridors and using turbine‑shutdown protocols during peak activity periods.
Human Health and Social Impacts
Reduced reliance on coal and natural gas improves local air quality, lowering rates of respiratory illness. Construction and maintenance create jobs; the American Wind Energy Association (AWEA) notes that each GW of wind capacity supports ~30 direct jobs and ~70 indirect jobs. However, community acceptance varies; visual impact and perceived noise can generate opposition if not addressed through transparent stakeholder engagement.
Economic and Infrastructure Impacts
Wind projects generate tax revenue for counties and can provide ancillary services to the grid, such as frequency regulation. Nevertheless, inadequate transmission lines can cause curtailment, limiting economic returns. Investment in high‑voltage direct‑current (HVDC) corridors is often cited as a cost‑effective remedy.
Regional Differences
While Kansas leads in untapped potential, neighboring states like Oklahoma and Texas exhibit higher installed capacity due to earlier policy support and more extensive transmission networks. In contrast, the Midwest’s “wind corridor” (Illinois, Indiana, Iowa, Missouri) faces denser population and stricter land‑use regulations, reducing the share of undeveloped resources. These regional patterns illustrate how geography, policy, and grid infrastructure together shape development trajectories.
What Scientists Know With High Confidence
- Wind speed measurements across Kansas are reliable and show mean speeds above 7 m/s at hub height.
- Technical potential estimates from NREL and independent academic studies agree within a 10‑15 % margin.
- Deploying wind energy displaces fossil‑fuel generation and reduces CO₂ emissions proportionally to the amount of electricity generated.
- Life‑cycle greenhouse‑gas emissions from wind are among the lowest of all energy sources.
What Remains Uncertain
Key uncertainties revolve around future policy stability, the cost and timing of transmission upgrades, and the social acceptance of large‑scale farms in rural communities. Climate‑model projections suggest that wind patterns may shift modestly over the next half‑century, but the magnitude of change for Kansas remains poorly constrained, introducing uncertainty into long‑term generation forecasts.
Common Misconceptions
Misconception: Kansas already uses all its wind.
Reality: Only about 20 GW of the estimated 600 GW technical potential has been installed, leaving the majority untouched.
Misconception: Wind turbines cause widespread health problems.
Reality: Peer‑reviewed epidemiological studies have not found consistent evidence linking turbine noise to adverse health outcomes when proper setback distances are maintained.
Misconception: Wind power is unreliable and cannot meet demand.
Reality: When combined with storage, demand‑response, and diversified geographic siting, wind can provide a stable share of the electricity mix; capacity factors in Kansas often exceed 40 %.
Solutions and Limitations
- Policy incentives: Extending the Production Tax Credit can accelerate builds, but reliance on subsidies may delay market‑driven cost reductions.
- Transmission expansion: Building new HVDC lines can unlock remote resources, yet high capital costs and permitting delays can limit speed of deployment.
- Community‑owned projects: These increase local acceptance, but require financing expertise that many rural cooperatives lack.
- Advanced turbine technology: Larger rotors capture more energy at lower wind speeds, yet larger structures raise concerns about visual impact and wildlife interactions.
What Individuals, Communities, and Governments Can Do
What Individuals Can Do
Support utilities that source electricity from wind, advocate for local wind‑energy ordinances, and consider investing in community wind cooperatives where available.
What Communities and Organizations Can Do
Form wind‑energy task forces, conduct site‑specific wind assessments, and negotiate power‑purchase agreements that lock in favorable rates for local residents.
What Governments Can Do
Streamline permitting processes, fund transmission studies, and allocate state‑level tax credits that complement federal incentives. Federal agencies can prioritize grid‑integration research and provide technical assistance to tribal and rural jurisdictions.
What Businesses and Industries Can Do
Enter long‑term power‑purchase agreements with wind developers, incorporate on‑site wind turbines where feasible, and invest in research to improve turbine efficiency and reduce material footprints.
Synthesis
Kansas stands out as the U.S. state with the most untapped wind power potential, offering roughly 600 GW of technically feasible capacity. Robust scientific evidence confirms the state’s high wind speeds, flat terrain, and low population density as key enablers. While policy, transmission, and social acceptance currently limit development, targeted incentives, grid upgrades, and community engagement can unlock substantial emissions reductions and economic benefits. Uncertainties around future climate impacts and policy continuity persist, but the overarching conclusion remains clear: harnessing Kansas’ wind resources is a high‑impact, evidence‑backed pathway toward a cleaner energy system.
Frequently Asked Questions
Which U.S. state has the most untapped wind power potential?
Kansas leads the United States in untapped on‑shore wind potential, with an estimated technical capacity of about 600 GW that remains largely undeveloped.
How is wind power potential measured?
Potential is measured by analyzing long‑term wind‑speed data, applying a speed threshold (often 7 m/s at hub height), and estimating how many turbines can be placed while respecting spacing, land‑use, and environmental constraints.
What are the main barriers to developing wind farms in Kansas?
Key barriers include limited transmission capacity, the need for consistent policy incentives, land‑owner negotiations, and community concerns about visual and noise impacts.
How would expanding wind power in Kansas affect greenhouse‑gas emissions?
If a portion of Kansas’ 600 GW potential were built, it could displace fossil‑fuel generation and cut U.S. CO₂ emissions by up to roughly 0.5 gigatonnes per year, according to life‑cycle analyses.
What actions can individuals take to support wind energy development?
Individuals can choose electricity providers that source wind power, support local wind‑energy ordinances, and, where available, invest in community‑owned wind projects or cooperatives.





Leave a Comment