
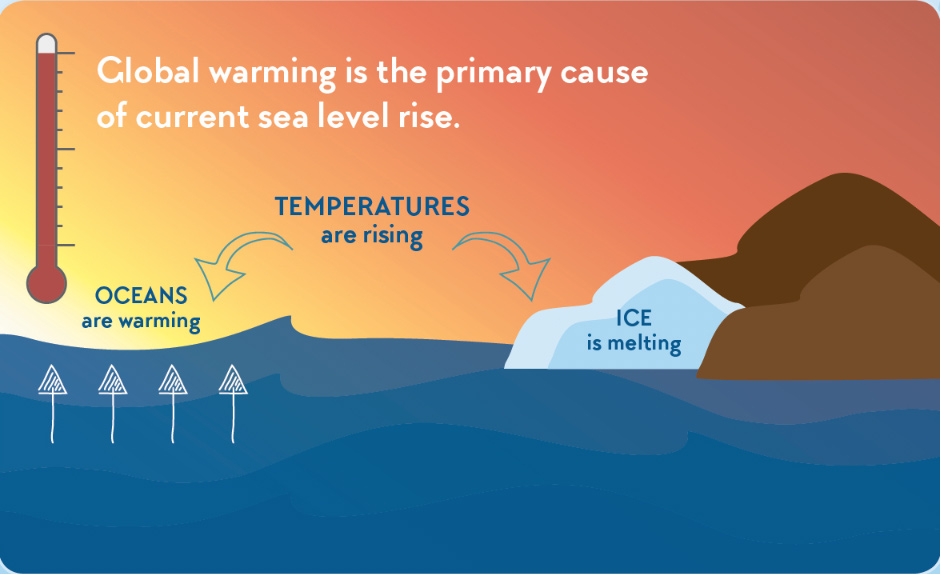
How Fast Is the Ocean Rising Because of Global Warming?
The ocean is rising because warming waters expand and melting ice adds water, with the global average sea level climbing about 3.3 mm per
October 24, 2025
Changes in the world’s oceans, ice masses, and related coastal impacts.
The ocean is rising because warming waters expand and melting ice adds water, with the global average sea level climbing about 3.3 mm per
October 24, 2025
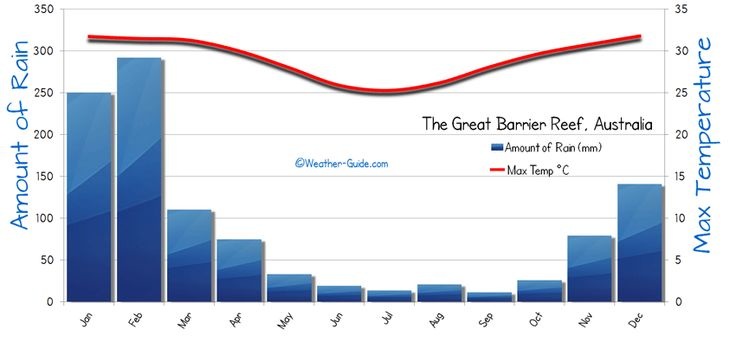
Rising sea levels reshape the Great Barrier Reef, creating both threats and potential ecological adjustments, but the net effect is largely detrimental according
October 23, 2025
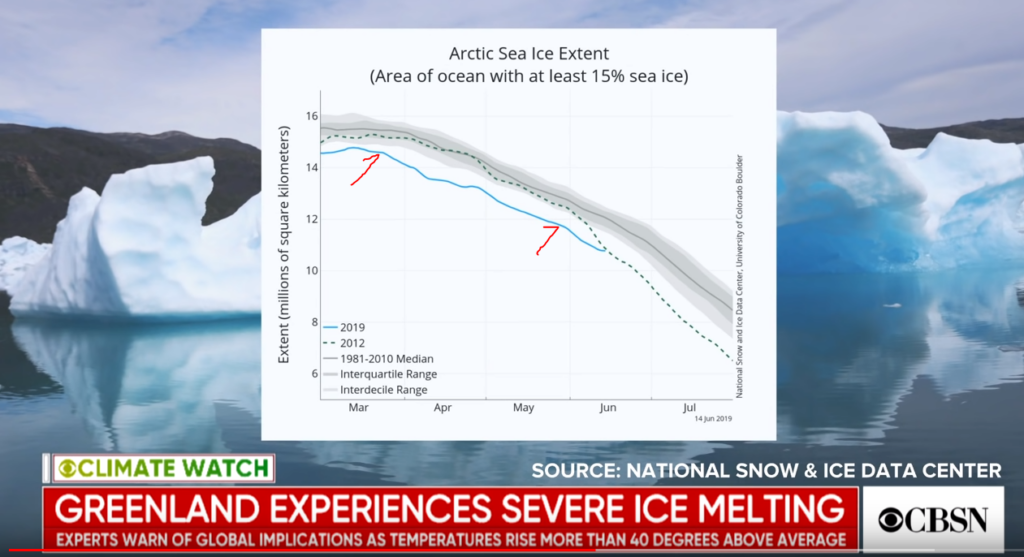
Greenland’s ice sheet is melting at record speed because rising atmospheric and ocean temperatures, amplified by albedo feedback and dynamic ice processes, accelerate
October 23, 2025

A 15‑foot sea level rise, driven by accelerated ice melt and thermal expansion, would reshape coastlines, displace hundreds of millions of people, and
October 22, 2025
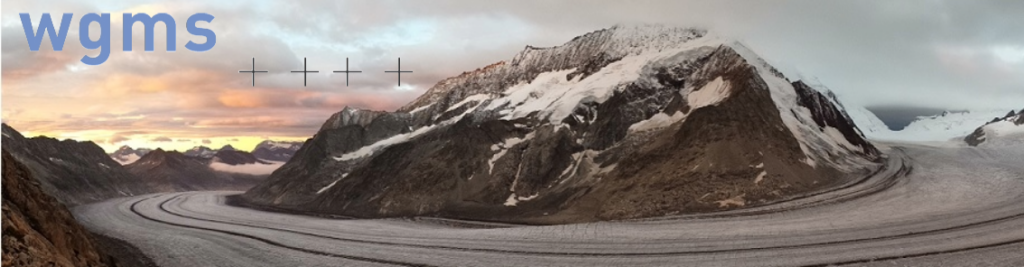
The World Glacier Monitoring Service (WGMS) coordinates a global network of observations that tracks glacier change, providing essential data for climate science, water
October 21, 2025
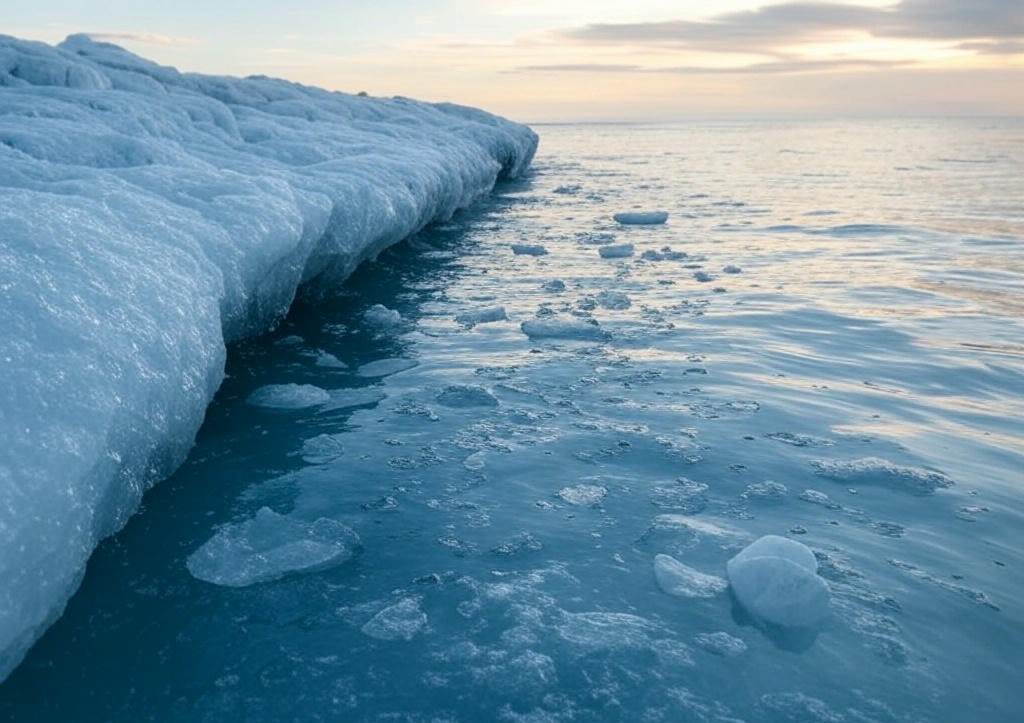
Glacier melt since 2000 has contributed almost 2 cm to global sea level, a process driven by warming temperatures, supported by long‑term observations, and
October 21, 2025
October 18, 2026

October 18, 2026

24Earth is an independent environmental knowledge platform explaining climate, oceans, biodiversity, pollution, energy, and planetary change through accessible, evidence-based reporting.
Copyright ©2026
24Earth.
