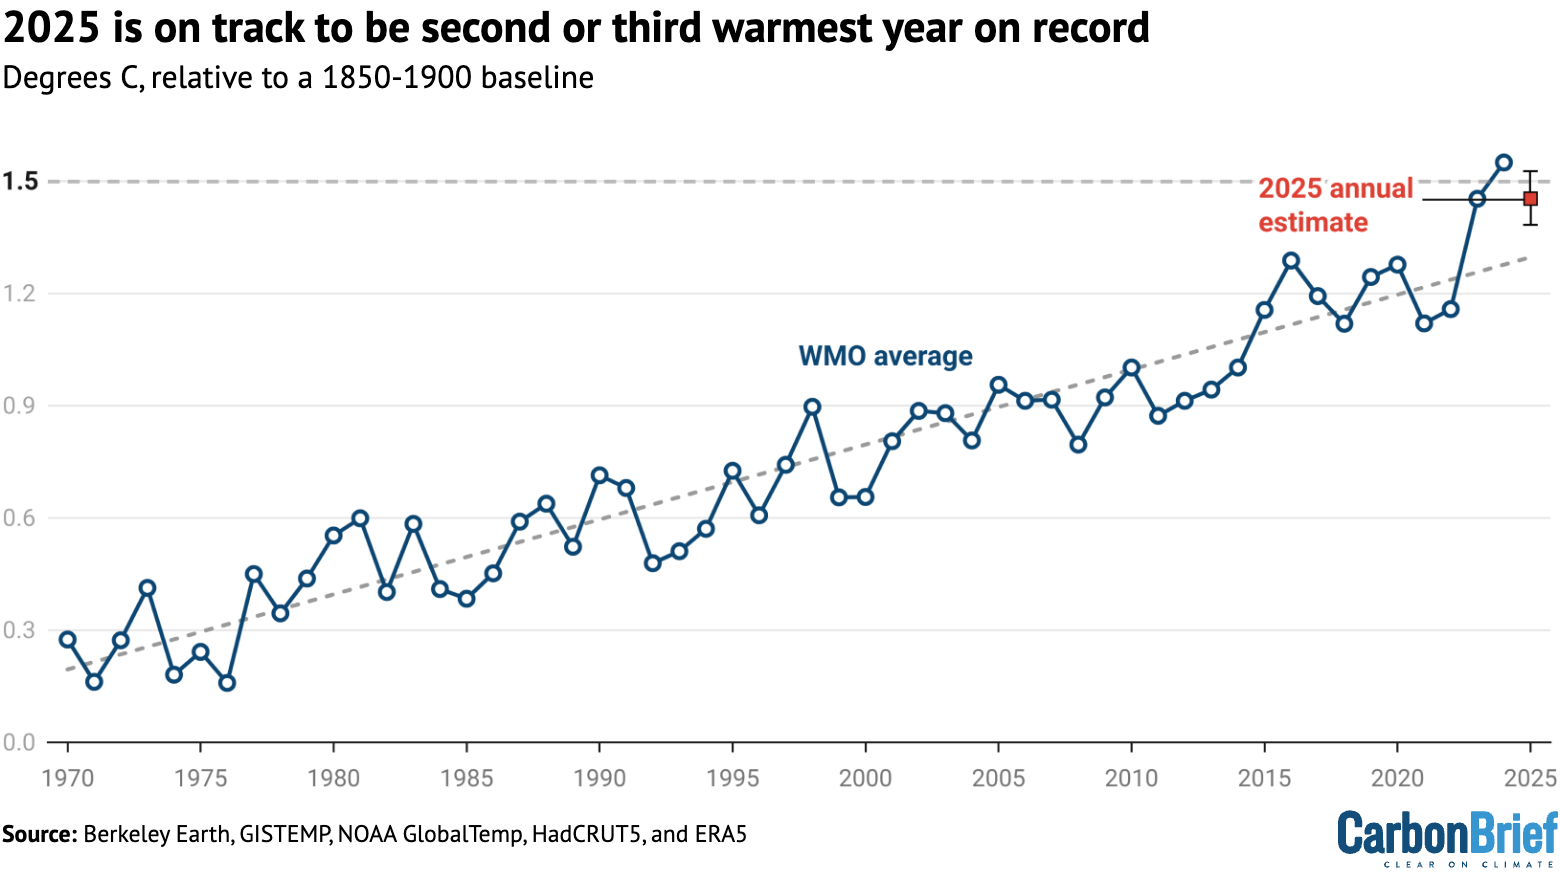
2025 is on track to tie as the joint second‑warmest year on record, a milestone that reflects persistent global warming and signals widespread environmental and societal effects.
Quick Answer
According to the World Meteorological Organization and the NOAA Global Climate Report, the global mean surface temperature for 2025 is projected to be within 0.05 °C of the 2023‑2024 average, placing it alongside 2016 as the second‑warmest year since instrumental records began in 1880. The primary driver is the continued increase in greenhouse‑gas concentrations, especially carbon dioxide, which trap infrared radiation and raise the planet’s energy balance. This warming amplifies heat‑related stress on ecosystems, agriculture, and human health, while uncertainty remains around the exact magnitude of regional extremes due to natural variability.
Key Takeaways
- 2025 is projected to be the joint second‑warmest year on record, based on multiple independent temperature datasets.
- Human‑generated greenhouse gases, chiefly CO₂, are the dominant cause of the long‑term warming trend.
- Warming influences heatwaves, drought risk, coral bleaching, and crop yields, with impacts varying by region.
- High confidence exists for the link between rising temperatures and increased extreme‑heat events.
- Uncertainties include the precise regional response of precipitation patterns and the timing of climate‑feedback processes.
- Mitigation through rapid decarbonisation and adaptation measures such as resilient agriculture are essential.
What Is 2025 on Track to Be Joint Second Warmest Year on Record?
The phrase refers to the statistical ranking of the annual global‑average surface temperature for the calendar year 2025 relative to the instrumental record that began in 1880. Multiple agencies – including the NOAA National Centers for Environmental Information, the UK Met Office Hadley Centre, and the Copernicus Climate Change Service – compile gridded temperature anomalies and rank each year. When these independent analyses converge on a similar value, the year is described as “joint” second‑warmest, meaning it shares the rank with another year (currently 2016).
This metric matters because it aggregates temperature trends across land and ocean, providing a clear indicator of the planet’s energy imbalance and the effectiveness of climate policies.
How Does It Work?
Physical Basis of Global Warming
1. Radiative Forcing: Increasing concentrations of CO₂, methane, and nitrous oxide enhance the greenhouse effect, reducing the amount of infrared radiation that escapes to space.
2. Energy Imbalance: The Earth absorbs more solar energy than it emits, leading to a net gain of heat.
3. Temperature Response: Oceanic heat uptake moderates surface warming, but the upper ocean and land surface warm faster, raising the global average temperature.
Data Collection and Ranking
Satellite microwave sounding units, surface weather stations, and ocean buoys provide raw temperature observations. These data are homogenized, bias‑corrected, and interpolated onto a common grid. Annual anomalies are then averaged and compared to a baseline period (typically 1951‑1980). The resulting value is placed in a ranked list of years.
What Does the Evidence Show?
Long‑term records from the IPCC Sixth Assessment Report (2021) confirm a warming of about 1.2 °C relative to pre‑industrial levels. The NOAA Annual Climate Report (2024) notes that the five warmest years on record have all occurred since 2015, illustrating an accelerating trend. Attribution studies employing detection‑and‑attribution modelling consistently find that >95 % of the observed warming since the mid‑20th century is attributable to anthropogenic greenhouse‑gas emissions.
Regional analyses reveal that the Arctic is warming at roughly twice the global average, while land areas generally experience larger temperature anomalies than oceans. These patterns are reproduced across climate‑model ensembles such as CMIP6, lending confidence to the projection for 2025.
Main Causes or Drivers
Direct Human Causes
- Fossil‑fuel combustion releases CO₂ (≈36 Gt C per year) and other gases.
- Deforestation reduces carbon uptake, adding ~1.5 Gt C yr⁻¹ to the atmosphere.
- Industrial processes emit methane and fluorinated gases with high global‑warming potential.
Underlying Drivers
- Economic growth in emerging economies drives energy demand.
- Insufficient global policy coordination on emissions limits.
- Feedback mechanisms such as permafrost thaw, which may release additional greenhouse gases.
Environmental and Human Impacts
Environmental Impacts
- Increased frequency of heatwaves intensifies coral bleaching; the 2020‑2024 global bleaching events affected >75 % of reefs.
- Warmer winters reduce snowpack, diminishing freshwater storage in mountain basins.
- Accelerated melt of Arctic sea ice contributes to sea‑level rise and habitat loss for polar species.
Human Health and Social Impacts
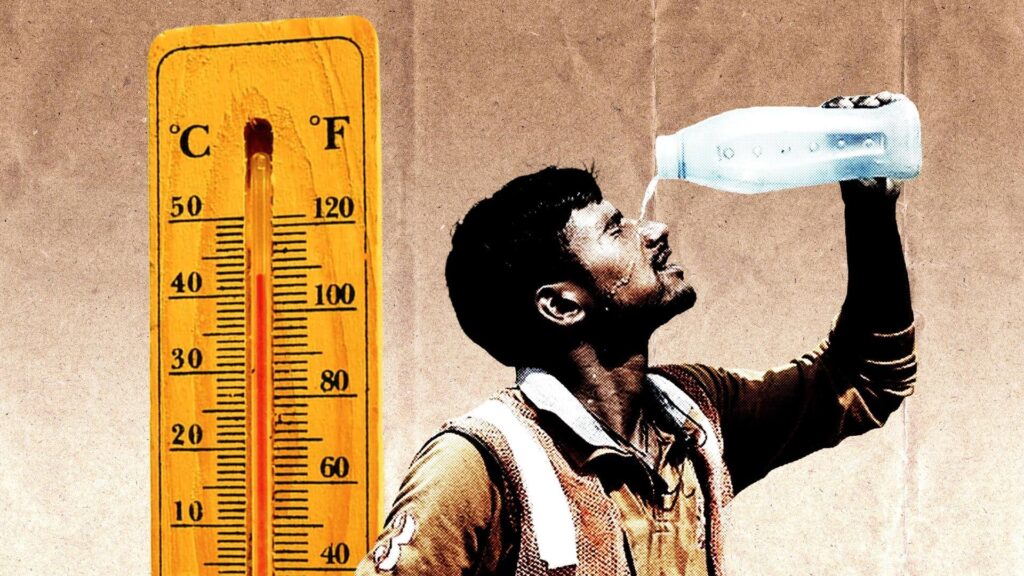
- Heat‑related mortality rises; a WHO review (2022) links each 1 °C increase to an estimated 2 % rise in deaths from heat stress in vulnerable regions.
- Drought conditions stress water supplies, affecting agriculture and increasing food‑price volatility.
- Communities in low‑lying coastal zones face heightened flood risk, prompting potential displacement.
Economic and Infrastructure Impacts
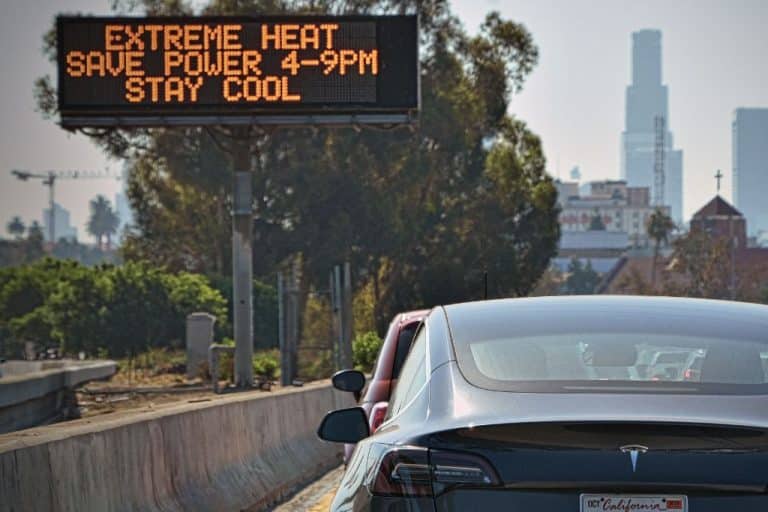
- Energy demand for cooling spikes; the International Energy Agency (2023) projects a 10 % increase in global electricity consumption for air‑conditioning by 2030.
- Infrastructure designed for historic climate normals may experience reduced lifespan under higher temperature stress.
Regional Differences
In the tropics, higher baseline temperatures push many regions past critical thresholds for heat stress, while temperate zones experience more pronounced seasonal shifts. The Sahel has seen a 20 % increase in summer daytime temperatures since 1980, exacerbating desertification. Conversely, some high‑latitude areas experience longer growing seasons but also face permafrost destabilisation. These variations stem from latitude, land‑sea contrast, and local land‑use practices.
What Scientists Know With High Confidence
What Scientists Know With High Confidence
- Human activities are the dominant cause of global warming since the mid‑20th century.
- Global average surface temperature has risen by about 1.2 °C above pre‑industrial levels.
- Heatwaves and extreme‑heat events are becoming more frequent and intense worldwide.
- The ocean has absorbed >90 % of excess heat, leading to thermal expansion and sea‑level rise.
What Remains Uncertain
What Remains Uncertain
Key uncertainties involve the magnitude of future precipitation changes, especially in monsoon regions, because cloud‑feedback processes are complex and model‑dependent. The timing and scale of carbon‑cycle feedbacks, such as permafrost carbon release, also remain poorly constrained. These gaps affect regional risk assessments but do not alter the overarching conclusion that the planet is warming due to human emissions.
Common Misconceptions
Common Misconceptions
Misconception: One hot year proves climate change.
Reality: Climate change is assessed over multi‑decadal trends. A single year, even if exceptionally warm, is interpreted in the context of a long‑term upward trajectory supported by robust statistical analysis.
Misconception: Only coastal areas are affected by warming.
Reality: Inland heatwaves, drought, and reduced snowpack impact agriculture, water resources, and public health far from the ocean.
Misconception: Reducing personal energy use can stop global warming.
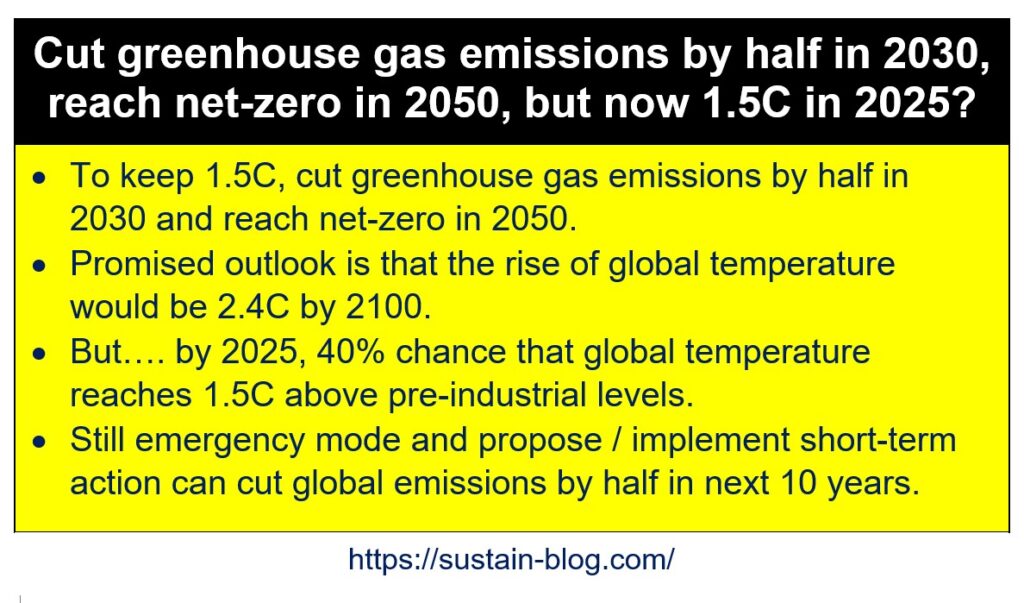
Reality: Individual actions matter, but systemic decarbonisation of energy, industry, and transport sectors is required to limit warming to 1.5 °C.
Solutions and Limitations
Mitigation strategies focus on rapid CO₂ reductions through renewable electricity, energy efficiency, and carbon‑pricing mechanisms. Evidence from the International Renewable Energy Agency (2022) shows that solar and wind can supply >70 % of electricity demand at competitive cost, yet challenges include grid integration and material supply chains.
Adaptation measures such as drought‑resilient crops, water‑storage infrastructure, and heat‑action plans reduce vulnerability. However, these solutions can be costly, require strong governance, and may not fully offset exposure in the most vulnerable regions.
What Individuals, Communities, and Governments Can Do
What Individuals Can Do
- Prioritize energy‑efficient appliances and home insulation to lower heating and cooling demand.
- Support policies that expand public transit and renewable energy incentives.
- Engage in local tree‑planting or green‑space projects that provide cooling benefits.
What Communities and Organizations Can Do
- Develop heat‑health action plans that include cooling centres and early‑warning systems.
- Adopt climate‑smart agricultural practices, such as crop diversification and soil‑carbon sequestration.
- Invest in resilient water‑management infrastructure, including rainwater harvesting.
What Governments Can Do
- Implement nationally determined contributions (NDCs) that target net‑zero emissions by mid‑century, aligned with the Paris Agreement.
- Fund research on climate feedbacks and improve monitoring networks in data‑sparse regions.
- Regulate building codes to require climate‑responsive design, reducing future heat stress.
Synthesis of Findings
2025’s projected status as the joint second‑warmest year underscores the persistent, human‑driven rise in global temperature. Robust observational records and multiple model ensembles confirm this trend, while uncertainties remain about regional precipitation responses and feedback timing. High‑confidence knowledge points to the need for immediate, large‑scale mitigation paired with targeted adaptation. By aligning policy, community action, and personal choices with the best available science, societies can reduce exposure, protect ecosystems, and steer the climate toward a more stable future.
Frequently Asked Questions
What does it mean when 2025 is called the joint second‑warmest year on record?
It means that, based on multiple independent temperature datasets, the global average surface temperature for 2025 is statistically tied with another year (currently 2016) for the second highest value since instrumental records began in 1880.
What is the main driver behind the warming trend that makes 2025 so warm?
The primary driver is the increase in anthropogenic greenhouse gases, especially carbon dioxide from fossil‑fuel combustion, which enhances the greenhouse effect and creates a net energy gain for the Earth.
How confident are scientists that human activities are causing the observed warming?
Scientists have high confidence—supported by multiple lines of evidence including detection‑and‑attribution studies—that more than 95 % of the warming since the mid‑20th century is due to human emissions of greenhouse gases.
What are some of the biggest uncertainties remaining about climate impacts in 2025?
Key uncertainties include how regional precipitation patterns will change, especially in monsoon regions, and the timing of carbon‑cycle feedbacks such as permafrost thaw, which influence future temperature and sea‑level projections.
What actions can governments take to address the warming indicated by the 2025 temperature record?
Governments can strengthen climate‑policy commitments by updating nationally determined contributions, invest in renewable energy and resilient infrastructure, fund monitoring and research, and enforce building codes that require climate‑responsive design.




Leave a Comment