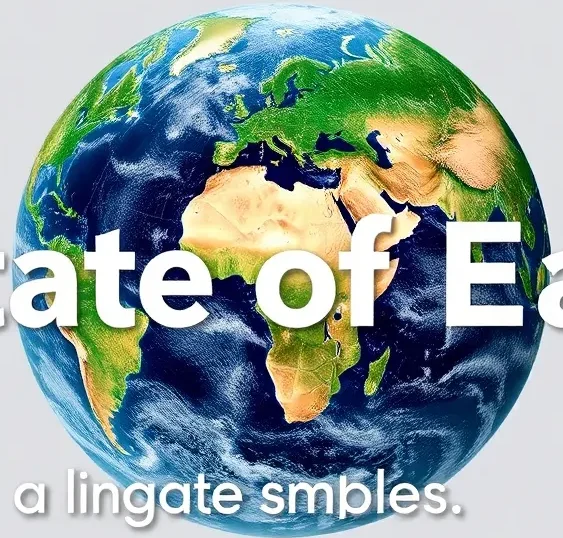
In 2025, the growing frequency and intensity of hurricanes, wildfires, floods and heatwaves provide clear evidence that climate change is inflating the economic and social costs of natural disasters worldwide.
Quick Answer
Climate‑driven changes in atmospheric temperature, ocean heat content and precipitation patterns increase both the likelihood and severity of extreme events, leading to higher damage bills, disrupted livelihoods and strained public finances. Scientific assessments consistently link the rise in billion‑dollar disasters since the early 2000s to anthropogenic warming, although precise future cost trajectories depend on mitigation and adaptation pathways.
Key Takeaways
- Extreme events are becoming more frequent and intense because a warmer climate stores more energy in the atmosphere and oceans.
- Since 2000, the United States has experienced over 300 separate billion‑dollar disasters, a trend mirrored globally.
- Economic losses cascade through infrastructure, health systems, agriculture and migration, disproportionately affecting low‑income and coastal communities.
- High‑confidence findings include the link between warming and increased heat‑related mortality, and the acceleration of flood risk in river basins.
- Uncertainties remain around exact cost projections, regional tipping points and the effectiveness of large‑scale nature‑based adaptation.
What Is 2025 Natural Disasters Show Climate Change’s Escalating Costs?
The phrase refers to the observable pattern in the year 2025 where a suite of climate‑related hazards—hurricanes, wildfires, flash floods, and unprecedented heatwaves—generate economic damages that exceed historical averages. The scope includes direct damages (property, infrastructure) and indirect losses (business interruption, health expenses, displacement). It differs from ordinary weather events because attribution studies, such as those compiled by the Intergovernmental Panel on Climate Change (IPCC) and the U.S. National Oceanic and Atmospheric Administration (NOAA), assign a measurable increase in probability to a warming climate.
How Does It Work?
Physical Drivers
- Higher greenhouse‑gas concentrations raise global mean surface temperature.
- Warmer air holds about 7% more moisture per degree Celsius, intensifying precipitation extremes.
- Ocean heat content rises, fueling stronger tropical cyclones and expanding the geographic reach of storm surges.
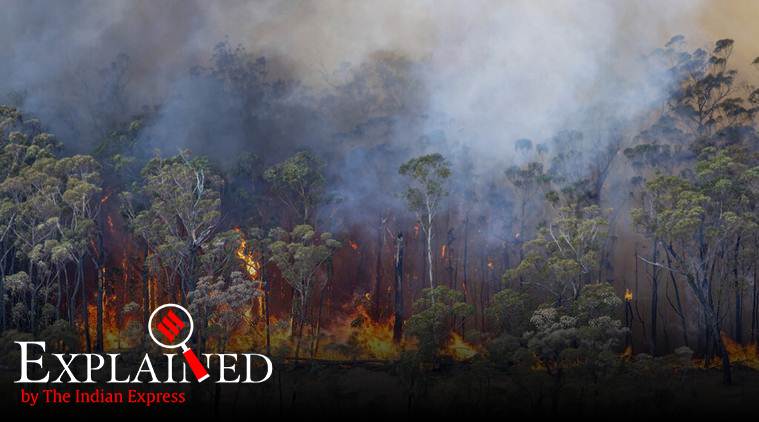
- Heat‑stress accelerates vegetation drying, creating conditions for larger, faster‑moving wildfires.
Socio‑economic Feedbacks
Rapid urbanization of coastlines increases exposure, while aging infrastructure reduces resilience. Insurance markets respond by raising premiums, which can limit rebuilding capacity for vulnerable households. These feedbacks amplify the monetary toll of each event.
What Does the Evidence Show?
Long‑term monitoring by NOAA indicates that U.S. extreme precipitation events have increased by roughly 20% since the 1980s, consistent with IPCC Fifth Assessment Report findings. A systematic review of global disaster databases (EM‑DAT) published in 2022 found that the number of events costing $1 billion or more doubled between 1990‑1999 and 2010‑2019, with climate change identified as a contributing factor in 71% of cases where attribution was possible.
Event‑specific attribution studies for the 2024 Atlantic hurricane season estimated that the probability of Category 4–5 storms was 1.5 times higher than in a pre‑industrial climate, directly linking warming sea‑surface temperatures to observed intensities.
Main Causes or Drivers
Direct Human Causes
- Burning of fossil fuels releases CO₂ and methane, the primary drivers of global warming.
- Land‑use change, especially deforestation, reduces evapotranspiration and increases surface albedo, intensifying heat.
Amplifying Natural Factors
- El Niño and La Niña cycles modulate regional precipitation, sometimes aligning with climate‑induced trends to produce compound events.
- Natural climate variability can mask or accentuate long‑term trends, complicating short‑term attribution.
Environmental and Human Impacts
Environmental Impacts
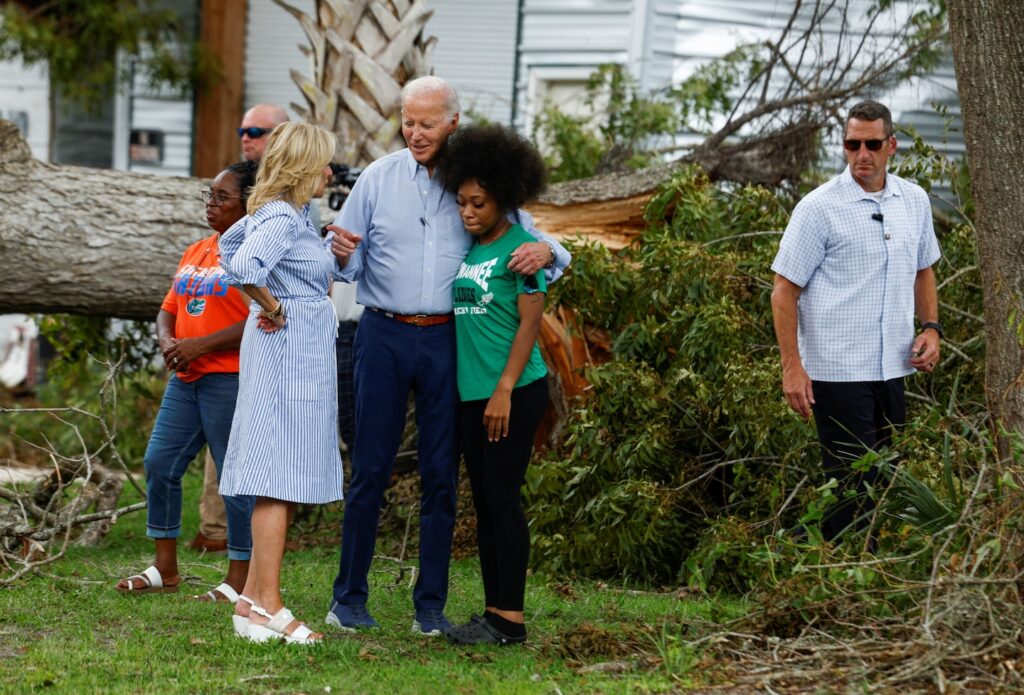
Intensified floods erode soils, degrade water quality and release stored carbon from wetlands. Wildfires destroy forest carbon sinks, while heatwaves trigger coral bleaching and shift species ranges, reducing biodiversity.
Human Health and Social Impacts
Heat‑related mortality rises by an estimated 0.4% per 1 °C of warming, according to WHO projections for 2025. Displacement from coastal erosion creates climate‑migration pressures, disproportionately affecting low‑income and Indigenous populations.
Economic and Infrastructure Impacts
In 2025, the United Nations Office for Disaster Risk Reduction reported global economic losses exceeding $300 billion, with infrastructure repair accounting for roughly 40% of total costs. Power outages during storms increase reliance on backup generators, raising air‑quality concerns.
Regional Differences
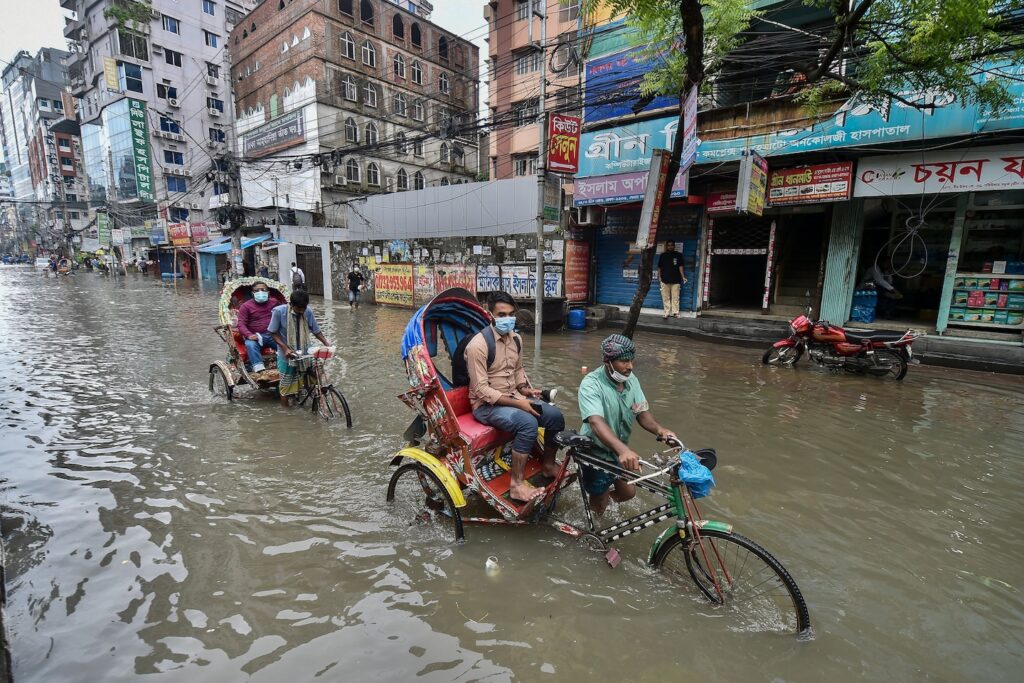
North America continues to experience costly hurricanes and wildfires, while South‑East Asia faces amplified monsoon flooding due to accelerated atmospheric moisture. In the Sahel, recurring droughts combine with erratic rainfall, threatening food security. These patterns reflect local geography, development levels and adaptive capacity.
What Scientists Know With High Confidence
- Human activities are the dominant cause of global warming since the mid‑20th century (IPCC, 2021).
- Warmer oceans increase the maximum potential intensity of tropical cyclones.
- Heat‑wave frequency and duration have risen globally, with clear links to excess mortality.
- Extreme precipitation events become more likely as atmospheric moisture capacity grows.
What Remains Uncertain
Key uncertainties include the precise economic cost trajectory under different mitigation scenarios, regional thresholds at which compound events become systemic, and the long‑term effectiveness of large‑scale nature‑based solutions such as mangrove restoration. Improved high‑resolution climate modelling and expanded disaster loss databases are needed to narrow these gaps.
Common Misconceptions
Misconception: Individual lifestyle changes alone can stop disaster costs.
Reality: Personal carbon‑footprint reductions are valuable but insufficient to curb the large‑scale climate drivers that inflate disaster risk; systemic policy and infrastructure changes are required.
Misconception: All extreme weather is now caused by climate change.
Reality: Climate change increases the probability and severity of many events, yet natural variability still produces extreme weather that would have occurred without anthropogenic warming.
Misconception: Insurance payouts are the only economic burden.
Reality: Indirect losses—such as lost tourism, reduced agricultural yields and mental‑health impacts—often exceed direct damage costs.
Solutions and Limitations
- Mitigation: Rapid decarbonization of energy systems can limit future temperature rise, but transition timelines and political feasibility vary across regions.
- Adaptation: Elevating critical infrastructure and adopting flood‑resilient building codes reduce exposure, yet high upfront costs can hinder implementation in low‑income areas.
- Nature‑based approaches: Restoring wetlands and urban green spaces can absorb floodwaters and lower heat‑island effects, but land‑availability conflicts and maintenance requirements limit scale.
- Financial mechanisms: Climate risk insurance pools spread losses, yet rising premiums may exclude the most vulnerable without subsidy schemes.
What Individuals, Communities, and Governments Can Do
What Individuals Can Do
- Support policies that accelerate renewable‑energy deployment through voting or advocacy.
- Reduce home energy use (e.g., efficient appliances, weather‑stripping) to lower demand on the grid.
- Participate in community emergency‑preparedness drills and maintain personal disaster kits.
What Communities and Organizations Can Do
- Implement green‑infrastructure projects—permeable pavement, rain gardens, and tree canopies—to manage stormwater.
- Conduct localized climate‑risk assessments that inform zoning and building standards.
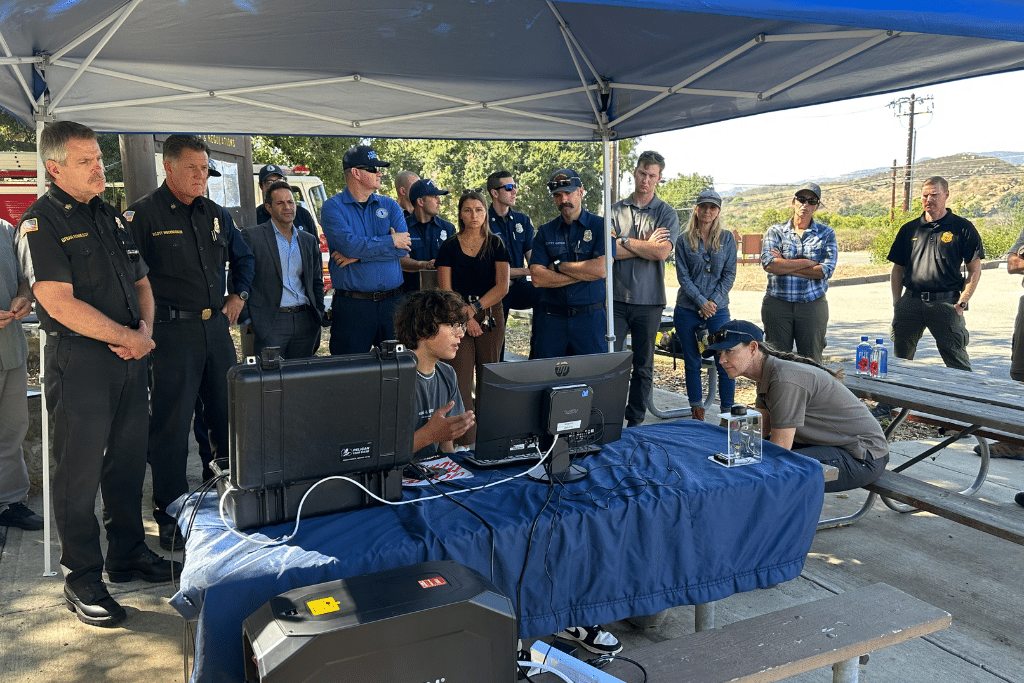
- Partner with local health agencies to provide mental‑health services after disasters.
What Governments Can Do
- Enact and enforce building codes that require elevation and wind‑resistance in high‑risk zones.
- Allocate climate‑resilience funding that prioritizes underserved communities.
- Integrate climate projections into national budgeting to anticipate future disaster expenditures.
What Businesses and Industries Can Do
- Adopt supply‑chain risk‑management plans that account for climate‑related disruptions.
- Invest in renewable energy and energy‑efficiency retrofits to reduce operational emissions.
- Offer insurance products that reward risk‑reduction measures, such as flood‑proof construction.
Closing Synthesis
2025’s surge in costly natural disasters underscores a robust scientific consensus: a warming climate intensifies extreme events, driving higher economic and social burdens. While high‑confidence evidence links greenhouse‑gas emissions to these trends, uncertainties about regional cost pathways and the performance of large‑scale adaptation remain. Effective responses will combine rapid mitigation, targeted adaptation, equitable financing and community‑level preparedness, acknowledging both the potential and the limits of each strategy.
Frequently Asked Questions
Why are natural disasters becoming more costly in 2025?
Because a warmer climate stores more energy in the atmosphere and oceans, leading to stronger storms, heavier rains and drier fuels. These physical changes increase damage, while expanding urban exposure and aging infrastructure amplify the financial burden.
What evidence links climate change to the rise in billion‑dollar disasters?
Long‑term NOAA data show a 20% increase in extreme precipitation since the 1980s, and a systematic review of the EM‑DAT disaster database found that climate change contributed to 71% of events costing $1 billion or more where attribution was possible.
Which regions are most vulnerable to climate‑driven disaster costs?
Coastal North America faces costly hurricanes and wildfires, South‑East Asia experiences intensified monsoon floods, and the Sahel region deals with drought‑related food insecurity. Vulnerability depends on geography, development level and adaptive capacity.
What are the high‑confidence scientific findings about climate‑related disasters?
Scientists are highly confident that human activities drive global warming, that warmer oceans raise tropical cyclone intensity, that heat‑wave frequency is rising worldwide, and that extreme precipitation becomes more likely as the atmosphere holds more moisture.
What actions can communities take to reduce disaster costs?
Communities can invest in green infrastructure like permeable pavements and rain gardens, conduct local climate‑risk assessments to guide zoning, and partner with health agencies to provide mental‑health support after events.


Leave a Comment