
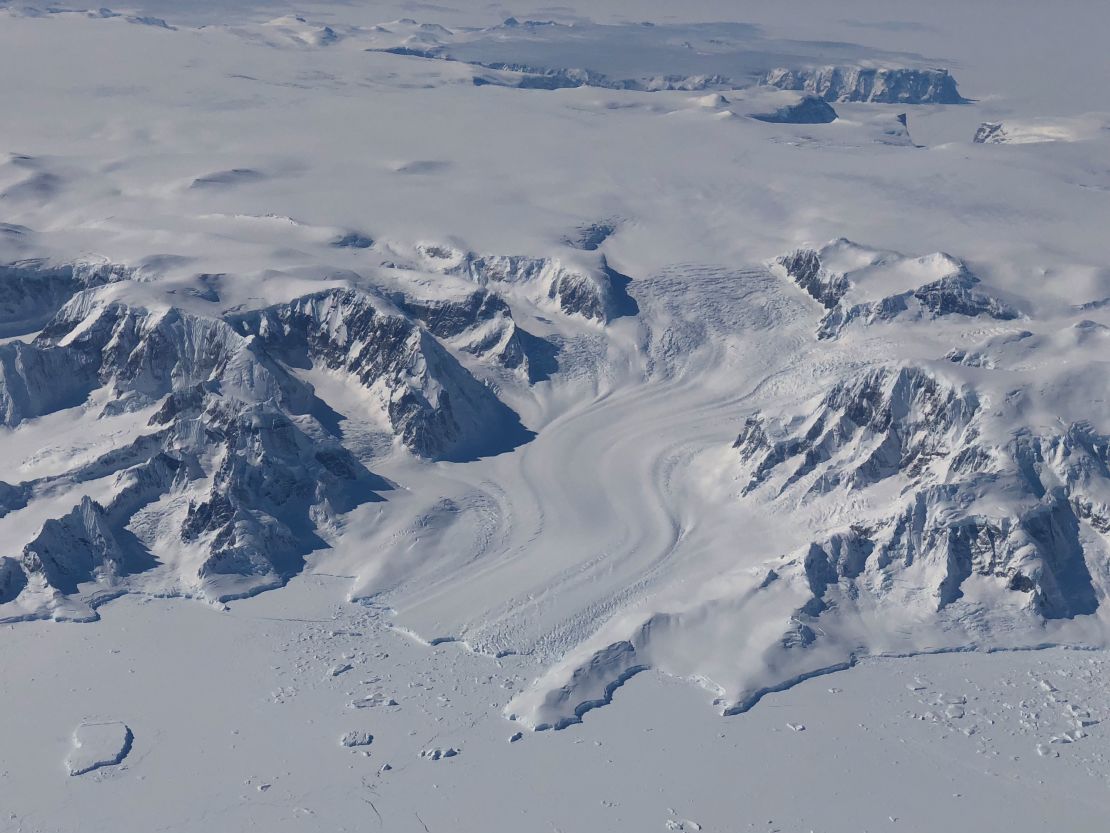
Ice sheets— the massive, continent‑scale layers of frozen water covering Greenland and Antarctica—are being monitored with satellites, field campaigns, and models, revealing accelerating melt, sea‑level contributions, and complex feedbacks that shape climate and coastal futures.
\n\n
Quick Answer
\n
Ice sheets are continental‑scale bodies of ice, primarily the Greenland and Antarctic ice sheets, whose mass balance is measured by satellite altimetry, gravimetry, and ground observations. Warmer atmospheric and oceanic temperatures increase surface melt and basal lubrication, accelerating ice flow into the ocean. The most robust scientific consensus, expressed in the IPCC 2021 Assessment Report, is that ice‑sheet loss has contributed roughly 0.7 mm yr⁻¹ to global sea level since 1993, and the rate is accelerating. While exact future contributions remain uncertain, continued warming is expected to increase melt and sea‑level rise.
\n
\n\n
Key Takeaways
\n
- \n
- Satellite gravimetry (GRACE) shows a net loss of about 280 Gt yr⁻¹ from Greenland and 150 Gt yr⁻¹ from Antarctica between 2003 and 2020.
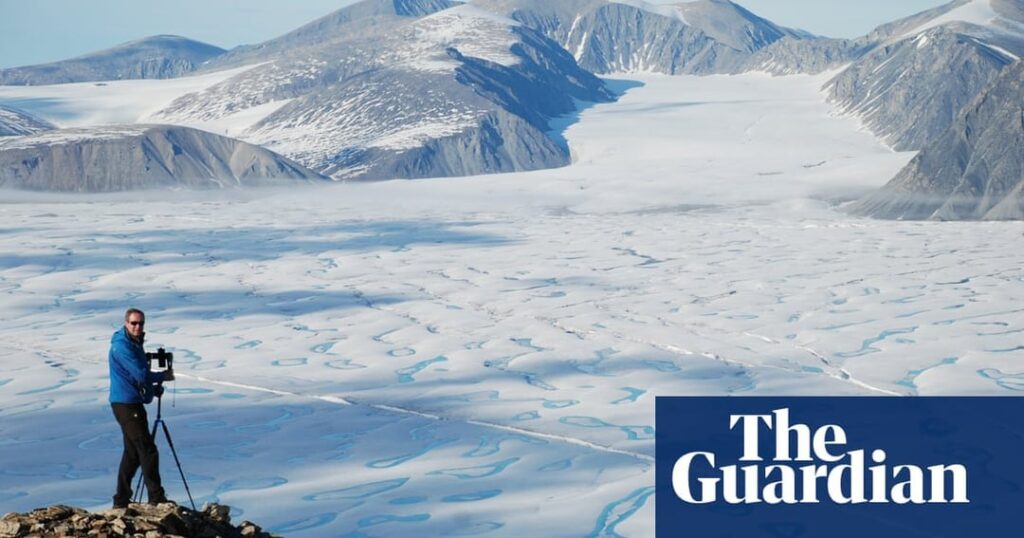
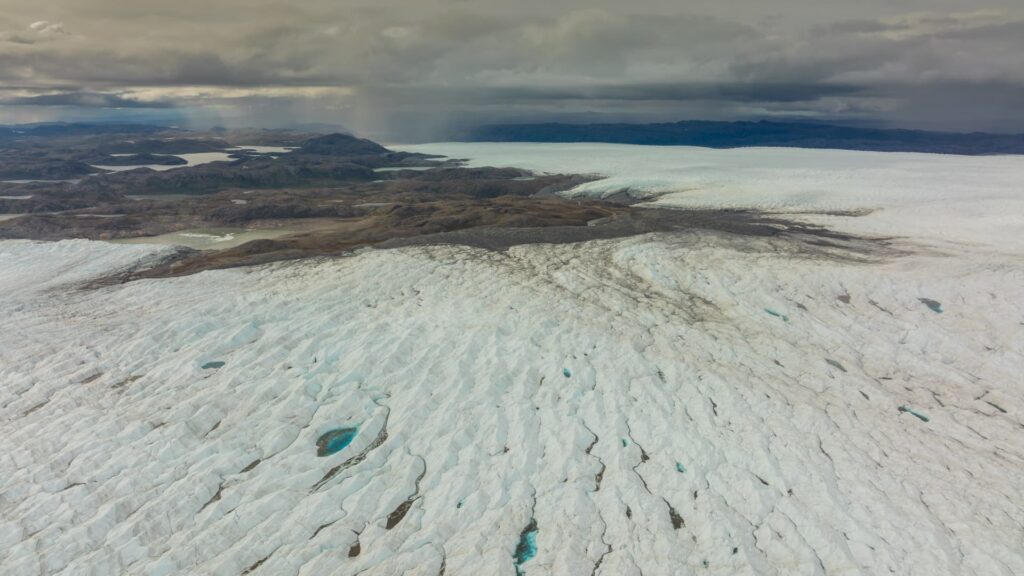
- Surface melt ponds and meltwater channels lubricate ice‑sheet bases, speeding glacier discharge.
- Ice‑sheet melt adds fresh water to the oceans, altering salinity, ocean circulation, and regional climate patterns.
- High‑confidence findings include accelerating mass loss, sea‑level contribution, and feedbacks between melt and warming.
- Key uncertainties involve the timing of rapid ice‑sheet collapse, the response of marine‑based glaciers, and future climate‑forcing scenarios.
\n
\n
\n
\n
\n
\n
\n\n
What Is Ice Sheets Today: What Scientists Are Observing Now?
\n
Ice sheets are thick, long‑lasting layers of ice that sit on bedrock in polar regions, covering roughly 10 % of Earth’s surface. The two dominant ice sheets are the Greenland Ice Sheet (≈2.9 million km²) and the Antarctic Ice Sheet (≈14 million km²). They differ from sea ice (which forms on the ocean) and mountain glaciers (which are smaller). Monitoring today focuses on changes in thickness, velocity, and mass balance—the difference between snowfall accumulation and melt‑driven loss. Understanding these changes is essential because ice sheets store about 68 % of the planet’s fresh water and directly influence global sea level.
\n\n
How Does It Work?
\n
Surface Energy Balance
\n
Solar radiation, long‑wave radiation, sensible heat, and latent heat together determine surface melt. When net radiation exceeds the energy required to melt ice (≈334 kJ kg⁻¹), meltwater forms on the surface.
\n
Basal Lubrication
\n
meltwater can percolate through crevasses, forming subglacial channels that reduce friction at the ice‑bed interface. This “basal lubrication” speeds ice flow, a process documented by borehole observations in Greenland and Antarctica.
\n
Ice Dynamics and Calving
\n
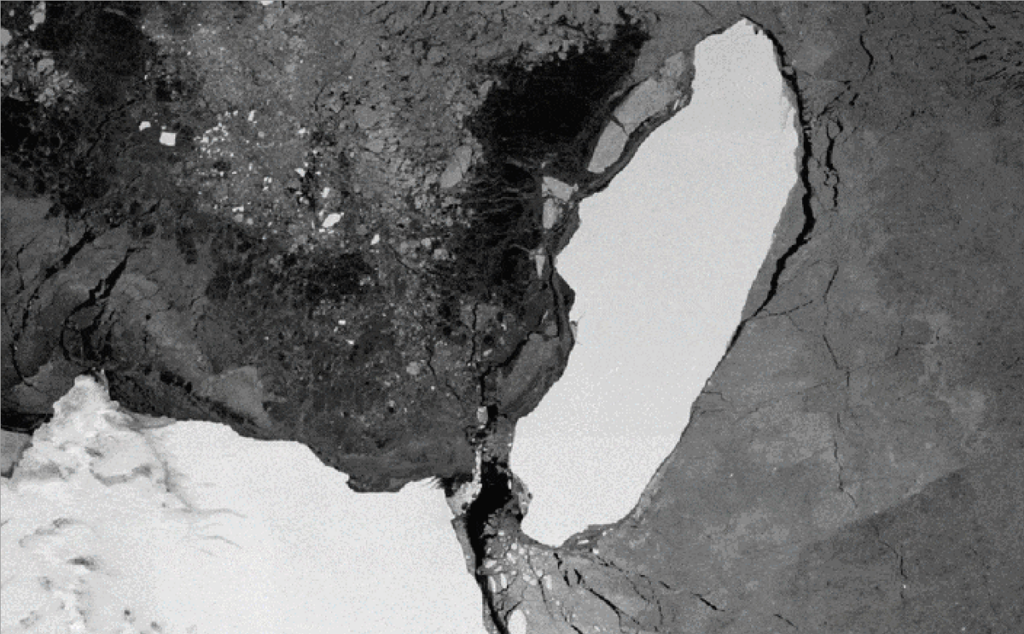
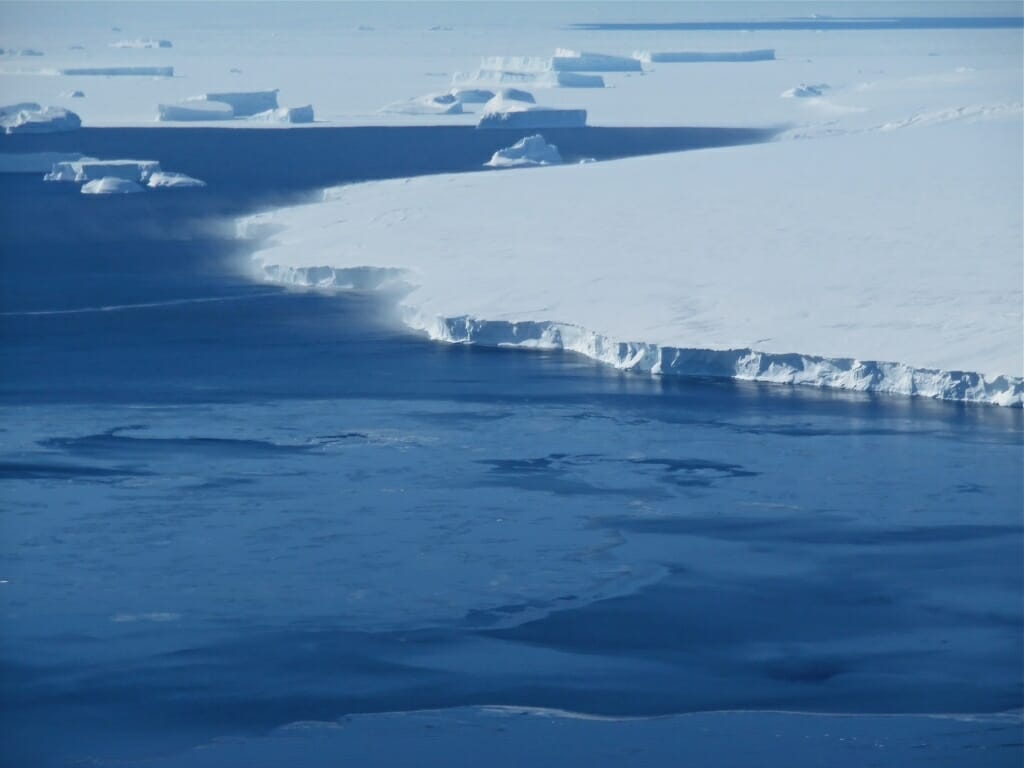
Glaciers transport ice from the interior to the margins. Where ice reaches the ocean, it can either melt from below or calve—break off as icebergs. Satellite altimetry (ICESat‑2) tracks elevation changes, while synthetic‑aperture radar (SAR) monitors flow speed.
\n
Feedback Loops
\n
Exposed darker ice or rock absorbs more solar energy (the albedo feedback), increasing melt. Additionally, fresh meltwater reduces seawater salinity, potentially weakening the Atlantic Meridional Overturning Circulation, which can further warm polar regions.
\n\n
What Does the Evidence Show?
\n
Multiple independent data streams converge on a clear picture of accelerating ice‑sheet loss. The Gravity Recovery and Climate Experiment (GRACE) and its successor GRACE‑FO have measured a net mass loss of 280 ± 30 Gt yr⁻¹ from Greenland and 150 ± 20 Gt yr⁻¹ from Antarctica over 2003‑2020 (NASA, 2022). Altimetry from ESA’s CryoSat‑2 indicates a thinning rate of 0.8 m yr⁻¹ on the Greenland peripheral glaciers (ESA, 2021). Field campaigns, such as the International Greenland Ice Sheet Project (IGISP), corroborate satellite‑derived melt rates with in‑situ observations of surface melt ponds and basal water pressure.
\n
Model intercomparison studies, including the Ice Sheet Model Intercomparison Project (ISMIP6), consistently reproduce observed trends when forced with observed temperature and ocean warming, reinforcing the attribution of loss to anthropogenic climate change.
\n\n
Main Causes or Drivers
\n
Atmospheric Warming
\n
Global mean surface temperature has risen about 1.1 °C since pre‑industrial times (IPCC, 2021). Warmer air increases net surface radiation, extending the melt season on Greenland and thinning the Antarctic Peninsula.
\n
Oceanic Warming
\n
Warmer circumpolar deep water erodes the undersides of marine‑terminating glaciers, especially in West Antarctica’s Pine Island and Thwaites glaciers. Ocean temperature records from Argo floats show a 0.2 °C increase at 500 m depth around Antarctica between 2000 and 2020.
\n
Precipitation Changes
\n
While increased snowfall can offset melt, observations suggest that precipitation changes are modest compared with melt rates, and in some regions, increased rain‑on‑snow events accelerate surface runoff.
\n
Ice‑Sheet Dynamics
\n
Structural weakening from crevasse formation, basal hydrology, and the loss of buttressing ice shelves (e.g., the collapse of the Larsen B shelf in 2002) reduce the restraining forces on inland ice, leading to faster discharge.
\n\n
Environmental and Human Impacts
\n
Environmental Impacts
\n
Ice‑sheet melt contributes to sea‑level rise, which threatens low‑lying coastal ecosystems such as mangroves and salt‑marshes. Freshwater influx can alter ocean stratification, potentially impacting marine productivity and fisheries. Moreover, loss of ice alters albedo, reinforcing regional warming.
\n
Human Health and Social Impacts
\n
Coastal communities face heightened flood risk, saltwater intrusion into drinking‑water supplies, and displacement. In the Pacific Islands, projected sea‑level rise of 0.3‑0.6 m by 2100 could render some atolls uninhabitable, prompting migration challenges.
\n
Economic and Infrastructure Impacts
\n
Sea‑level rise increases the cost of coastal protection. The World Bank estimates that adaptation costs could exceed $1 trillion globally by 2050, with a sizable share driven by ice‑sheet contributions.
\n\n
Regional Differences
\n
Greenland’s melt is dominated by surface processes, with the western margin losing mass fastest due to warm Atlantic inflow. In contrast, Antarctica exhibits a dichotomy: the West Antarctic Ice Sheet, especially marine‑based basins, is losing mass from oceanic melting, while East Antarctica remains relatively stable, though localized thinning has been observed on the Antarctic Peninsula.
\n
Monitoring density also varies: North America and Europe benefit from dense satellite coverage and ground stations, whereas remote parts of East Antarctica have sparser in‑situ data, leading to higher uncertainty in those regions.
\n\n
What Scientists Know With High Confidence
\n
- \n
- Ice‑sheet mass loss has accelerated over the past three decades.
- Surface melt and basal lubrication are key mechanisms driving faster ice flow.
- The contribution of ice‑sheet melt to global sea level is measurable and increasing.
- Albedo feedback amplifies melt in regions where ice is exposed.
\n
\n
\n
\n
\n
\n\n
What Remains Uncertain
\n
Critical uncertainties include the timing and magnitude of potential rapid collapse of marine‑based sectors such as the Thwaites Glacier, the future response of subglacial hydrology to warming, and how coupled ocean‑ice‑atmosphere feedbacks may evolve under different emission pathways. Improved high‑resolution observations and model integration are needed to narrow these gaps.
\n
\n\n
Common Misconceptions
\n
Misconception: Ice sheets are static and will not change for centuries.
\n
Reality: Satellite records show that both Greenland and Antarctic ice sheets have lost mass annually for the past 30 years, with rates accelerating in the last decade.
\n
Misconception: All sea‑level rise comes from thermal expansion of seawater.
\n
Reality: While thermal expansion accounts for about half of observed sea‑level rise, ice‑sheet melt contributes roughly 30 % and continues to grow as temperatures rise.
\n
Misconception: Melting ice sheets only affect polar regions.
\n
Reality: Meltwater spreads globally through the oceans, influencing sea level, ocean circulation, and climate patterns far from the poles.
\n
\n\n
Solutions and Limitations
\n
Mitigation of greenhouse‑gas emissions remains the most effective long‑term strategy to curb further ice‑sheet loss. Renewable‑energy transitions, energy efficiency, and carbon‑pricing policies can reduce the radiative forcing that drives warming. Adaptation measures—such as coastal‑managed retreat, wetland restoration, and resilient infrastructure design—address the impacts already locked in by existing ice loss.
\n
Limitations include the long atmospheric lifetime of CO₂ (centuries), the technical and financial challenges of large‑scale carbon removal, and the social‑economic barriers to relocating vulnerable communities. Nature‑based solutions, like restoring Arctic tundra, can increase albedo but are limited by land availability and ecosystem complexity.
\n\n
What Individuals, Communities, and Governments Can Do
\n
What Individuals Can Do
\n
- \n
- Support policies and candidates that prioritize climate mitigation and coastal resilience.
- Reduce personal carbon footprints through energy‑saving habits, low‑carbon travel, and plant‑rich diets.
- Engage in local climate‑action groups that advocate for renewable energy and flood‑risk planning.
\n
\n
\n
\n
What Communities and Organizations Can Do
\n
- \n
- Develop and implement coastal‑adaptation plans that incorporate sea‑level projections from ice‑sheet studies.
- Invest in early‑warning systems and flood‑defense infrastructure based on regional risk assessments.
- Partner with research institutions to host monitoring equipment, improving data coverage for local ice‑sheet influences.
\n
\n
\n
\n
What Governments Can Do
\n
- \n
- Enact and strengthen nationally determined contributions (NDCs) that align with the Paris Agreement’s 1.5 °C target.
- Fund long‑term satellite missions (e.g., NASA’s ICESat‑2, ESA’s CryoSat) and ground‑based observation networks.
- Provide financing and technical assistance for climate‑resilient migration and infrastructure in low‑lying regions.
\n
\n
\n
\n\n
Synthesis
\n
Current observations confirm that Greenland and Antarctic ice sheets are losing mass at an accelerating pace, driven primarily by atmospheric and oceanic warming, surface melt, and dynamic ice‑sheet processes. High‑confidence findings underscore the link between melt and sea‑level rise, while uncertainties remain about the potential for rapid, nonlinear collapse of vulnerable marine‑based glaciers. Mitigation of greenhouse‑gas emissions, coupled with targeted adaptation, offers the most credible pathway to limit future impacts. Continued investment in observation systems and collaborative research will be essential to refine projections and guide effective policy responses.
Frequently Asked Questions
What are the two major ice sheets on Earth?
The two major ice sheets are the Greenland Ice Sheet, covering about 2.9 million km², and the Antarctic Ice Sheet, covering roughly 14 million km². Both store the majority of Earth’s fresh water.
How do scientists measure ice sheet mass loss?
Scientists use satellite gravimetry (GRACE/GRACE‑FO) to detect changes in Earth's gravity field, satellite altimetry (ICESat‑2, CryoSat‑2) to track surface elevation, and ground‑based GPS and borehole observations to monitor ice flow and thickness.
Why does ice sheet melt contribute to sea‑level rise?
When ice that rests on land melts, the water flows into the ocean, adding volume. Because ice sheets hold about 68 % of the planet’s fresh water, their loss directly raises global sea level.
What are the main uncertainties in projecting future ice sheet behavior?
Key uncertainties include how quickly marine‑based glaciers like Thwaites might undergo rapid collapse, how subglacial water systems will respond to warming, and how coupled ocean‑ice feedbacks will evolve under different emission scenarios.
What actions can individuals take to help reduce ice sheet loss?
Individuals can support climate‑friendly policies, reduce personal carbon footprints through energy‑saving habits and low‑carbon travel, adopt plant‑rich diets, and engage in local climate‑action initiatives that promote renewable energy and resilient planning.



Leave a Comment