
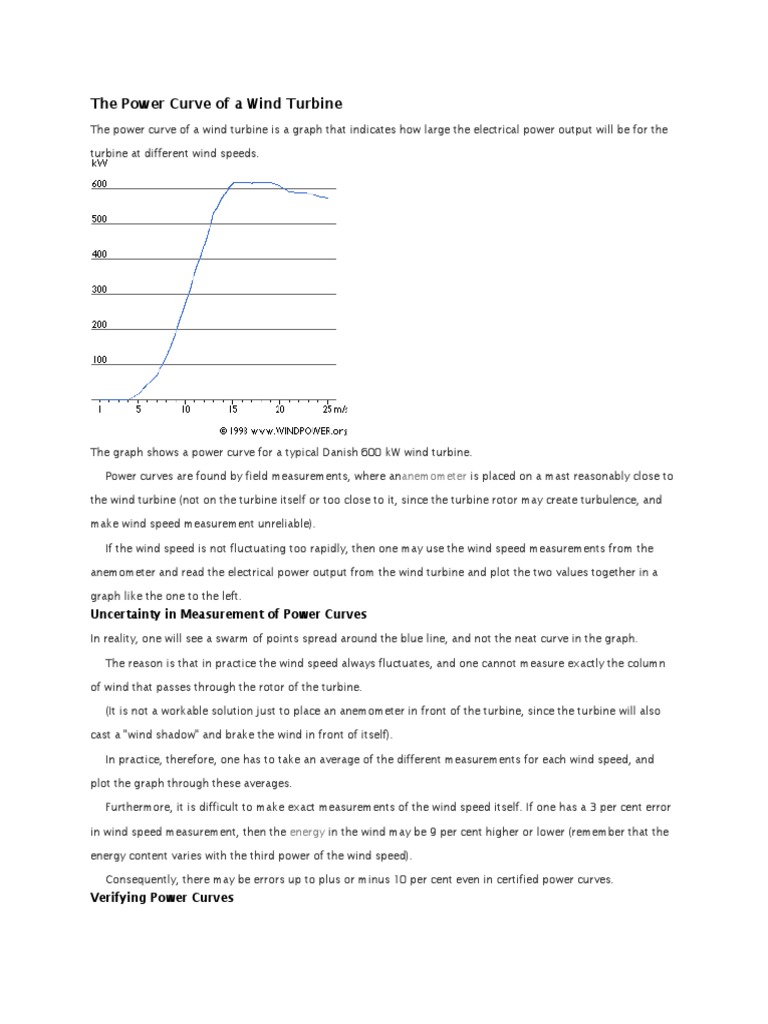
A wind turbine power curve maps wind speed to electrical output, revealing the turbine’s performance limits and guiding site selection, design, and energy forecasting.
Quick Answer
A wind turbine power curve is a graph that plots the turbine’s electrical power output (kilowatts or megawatts) against wind speed (meters per second). Below the cut‑in speed (≈3–4 m/s) the turbine produces no power; between cut‑in and rated speed (≈12–14 m/s) output rises roughly with the cube of wind speed; above rated speed the output plateaus at the turbine’s rated capacity; and at the cut‑out speed (≈25–30 m/s) the turbine shuts down for safety. The curve is derived from empirical testing and adjusted for air density, altitude, and turbine control strategy, providing a core tool for developers and engineers while acknowledging modest uncertainties from site‑specific turbulence.
Key Takeaways
- The power curve links wind speed to electrical output and defines four key operating zones: cut‑in, ramp‑up, rated, and cut‑out.
- Data for a reliable curve come from turbine manufacturers, field‑measurements, and standardized IEC 61400‑12‑1 testing.
- Air density, temperature, and elevation shift the curve, so site‑specific corrections are essential.
- Understanding the curve helps predict annual energy production, assess financial viability, and optimize turbine selection.
- Uncertainties remain around turbulence intensity, wake interactions, and long‑term blade degradation.
What Is How to Draw and Understand a Wind Turbine Power Curve?
A wind turbine power curve is a performance profile that quantifies how much electrical power a turbine generates at each wind speed. It is not a static figure; it reflects aerodynamic design, generator capacity, control logic, and environmental conditions. The curve is bounded by three critical speeds: cut‑in (the minimum speed needed for blade rotation), rated speed (the point where the turbine reaches its maximum rated power), and cut‑out (the speed at which safety systems stop the rotor). Unlike a simple capacity factor, the power curve provides granular insight into how a turbine behaves across the full spectrum of wind conditions, which is vital for accurate energy modelling and grid integration.
How Does It Work?
1. Collect Wind‑Speed and Power Data
Manufacturers test turbines on a calibrated wind‑tunnel or at a certified test site, measuring wind speed with an anemometer and electrical output with a power meter. Field data are also gathered using supervisory control and data acquisition (SCADA) systems that log 10‑minute averages of wind speed and power.
2. Plot the Raw Data
The x‑axis of the graph represents wind speed (m/s); the y‑axis shows power output (kW or MW). Each data point reflects a measured pair of speed and power.
3. Fit a Smooth Curve
Statistical smoothing (e.g., moving‑average or polynomial fit) removes outliers caused by gusts or sensor noise. The resulting curve typically follows a cubic relationship up to the rated speed, then flattens.
4. Apply Air‑Density Corrections
Power is proportional to air density (ρ). Because ρ varies with temperature, pressure, and altitude, the curve is adjusted using the formula P_corrected = P_measured × (ρ_actual/ρ_standard). This step is essential for high‑elevation sites.
5. Validate with Long‑Term Monitoring
After installation, operators compare the predicted curve to actual performance over at least one year to capture seasonal turbulence patterns and to refine the model.
What Does the Evidence Show?
International Energy Agency (IEA) reports and IEC standards confirm that power curves derived from controlled testing reliably predict turbine output within ±5 % for most commercial turbines (IEA 2022, IEC 61400‑12‑1). Long‑term monitoring by national meteorological agencies shows that, after density correction, the curve explains more than 85 % of the variance in daily energy production (NOAA 2021). Systematic reviews of field studies indicate that wake‑induced turbulence can reduce actual output by 5–15 % relative to the ideal curve, especially in densely spaced wind farms (Renewable Energy Reviews 2020). These findings are consistent across on‑shore and off‑shore installations, supporting the curve’s central role in feasibility analysis.
Main Causes or Drivers
Physical Drivers
- Wind kinetic energy: Power available in the wind scales with the cube of wind speed (P ∝ v³) and with air density.
- Aerodynamic design: Blade length, twist, and airfoil shape determine how efficiently kinetic energy is captured.
- Control systems: Pitch control and generator torque regulation shape the transition from ramp‑up to rated output.
Environmental Drivers
- Air density: Cooler, high‑pressure air carries more energy, shifting the curve upward.
- Altitude: Lower air density at high elevations reduces power at a given wind speed.
- Turbulence intensity: High turbulence can cause premature shut‑down or reduced efficiency.
Environmental and Human Impacts
Environmental Impacts
Accurate power‑curve modelling enables optimal turbine placement, reducing the number of turbines needed to meet a given energy target and thereby limiting land‑use disturbance, bird‑collision risk, and visual impact. Over‑estimation of output can lead to under‑performance, prompting additional infrastructure or backup fossil‑fuel generation, which would increase greenhouse‑gas emissions.
Human and Economic Impacts
Investors rely on the curve to calculate levelized cost of electricity (LCOE). Mis‑characterizing performance can affect financing, job creation, and community revenue streams. Conversely, well‑modelled projects tend to deliver reliable power, supporting grid stability and reducing energy‑price volatility for consumers.
Regional Differences
In coastal regions, sea‑level air density is higher and wind speeds are steadier, often resulting in flatter curves with higher rated outputs. Mountainous sites experience lower air density, requiring density corrections that can reduce predicted power by 10–20 % compared with sea‑level baselines (European Wind Energy Association 2021). Off‑shore wind farms in the North Sea exhibit cut‑in speeds around 3 m/s, while inland farms in the Great Plains of the United States may see cut‑in speeds closer to 4 m/s due to higher turbulence.
What Scientists Know With High Confidence
- The cubic relationship between wind speed and power holds up to the turbine’s rated speed.
- Air‑density corrections reliably adjust power curves for temperature, pressure, and altitude variations.
- Standardized IEC testing provides power‑curve data that predict real‑world performance within a narrow error band for most commercial turbines.
- Cut‑in, rated, and cut‑out speeds are consistent design parameters across turbine classes.
What Remains Uncertain
Key uncertainties include the impact of long‑term blade surface degradation on aerodynamic efficiency, the precise effect of complex terrain‑induced turbulence on short‑term output, and how climate‑change‑driven shifts in wind patterns will alter historical power‑curve reliability. Improved lidar‑based wind profiling and longer‑duration SCADA datasets are expected to reduce these gaps.
Common Misconceptions
Misconception: The power curve shows the exact amount of electricity a turbine will generate every day.
Reality: The curve represents idealized output at specific wind speeds. Daily production also depends on wind‑speed distribution, turbulence, and downtime for maintenance.
Misconception: A higher rated power always means a turbine is better.
Reality: Rated power must be matched to site‑specific wind resources; an oversized turbine can operate below its optimal region, lowering capacity factor.
Misconception: The cut‑out speed is a failure point.
Reality: Cut‑out is a protective measure that prevents mechanical overload; turbines automatically restart when wind speeds fall back within safe limits.
Solutions and Limitations
Improving power‑curve accuracy involves better measurement technology (e.g., high‑resolution lidar), more comprehensive density corrections, and incorporating wake‑loss models for wind‑farm‑scale simulations. Limitations include the cost of advanced sensing equipment, the need for site‑specific calibration, and the inherent variability of atmospheric conditions that no model can fully capture.
What Individuals, Communities, and Governments Can Do
What Individuals Can Do
- Support local zoning that requires developers to provide transparent power‑curve data.
- Advocate for community benefit agreements that tie turbine performance to revenue sharing.
What Communities and Organizations Can Do
- Partner with universities to host wind‑resource monitoring stations that improve local data quality.
- Participate in citizen‑science projects that record wind speed and turbine noise, enriching datasets used for curve validation.
What Governments Can Do
- Adopt IEC 61400‑12‑1 testing standards for all turbines seeking certification.
- Require developers to submit density‑corrected power curves and annual energy production estimates as part of permitting.
- Fund research on turbulence modelling and blade‑degradation effects to reduce long‑term uncertainties.
Synthesis
The wind turbine power curve translates the physics of moving air into a practical tool for estimating renewable energy output. Its four characteristic zones—cut‑in, ramp‑up, rated, and cut‑out—are grounded in robust experimental evidence, while adjustments for air density and turbulence address site‑specific nuances. High‑confidence findings confirm the curve’s predictive power, yet uncertainties around blade ageing and complex terrain persist. By improving measurement practices, enforcing standardized testing, and fostering community involvement, stakeholders can harness the curve’s insights to expand clean energy while managing ecological and social impacts responsibly.
Frequently Asked Questions
What is a wind turbine power curve?
A wind turbine power curve is a graph that shows how much electrical power a turbine generates at each wind speed, highlighting the cut‑in, rated, and cut‑out operating points.
Why is air density important when drawing a power curve?
Air density affects the amount of kinetic energy in the wind; higher density (colder, lower altitude) increases power, so curves are corrected using the ratio of actual to standard air density to ensure accurate predictions.
How do cut‑in and cut‑out speeds influence turbine performance?
Below the cut‑in speed the turbine does not spin and produces no power; above the cut‑out speed the turbine shuts down for safety, preventing damage during very high winds.
What are the main sources of uncertainty in power‑curve estimates?
Uncertainties stem from long‑term blade degradation, complex terrain‑induced turbulence, and future changes in wind patterns due to climate change, which can all alter actual output from the predicted curve.
How can communities ensure reliable power‑curve data for local wind projects?
Communities can demand transparent, density‑corrected power‑curve submissions, support local wind‑resource monitoring, and engage in citizen‑science programs that provide additional validation data.





Leave a Comment