
Human activities are responsible for the overwhelming majority of observed global warming since the mid‑20th century, a fact supported by multiple lines of scientific evidence and crucial for guiding effective climate action.
Quick Answer
Anthropogenic greenhouse‑gas emissions, primarily carbon dioxide from fossil‑fuel combustion, account for roughly 100% of the warming observed since about 1950, according to the Intergovernmental Panel on Climate Change (IPCC) Assessment Report 2021. The mechanism is well understood: emitted gases trap infrared radiation, raising Earth’s average surface temperature. This human‑driven warming drives sea‑level rise, ecosystem disruption, and heightened health risks. While natural factors such as volcanic eruptions and solar variability influence short‑term variability, the long‑term trend is dominated by human influence, with very high confidence.
Key Takeaways
- Scientific consensus attributes virtually all warming since the mid‑20th century to human activities.
- Carbon dioxide, methane and nitrous oxide together generate about 90% of anthropogenic radiative forcing.
- Detection‑and‑attribution studies use climate models to separate human and natural influences.
- Regional impacts vary, but the global signal of human‑driven warming is clear.
- Mitigation, adaptation and systemic policy changes are required; individual actions alone are insufficient.
What Is How Much of Climate Change Is Caused by Humans? The Percentage Explained?
The phrase refers to the proportion of observed climate change—most commonly measured as global‑average surface temperature increase—that can be linked to human activities, especially the emission of greenhouse gases (GHGs). It is a quantitative expression of climate‑change attribution, distinguishing anthropogenic forcing from natural drivers such as volcanic eruptions, solar variability, and internal climate oscillations. Understanding this percentage informs policy, public perception, and the urgency of mitigation strategies.
How Does It Work?
1. Emission of Greenhouse Gases
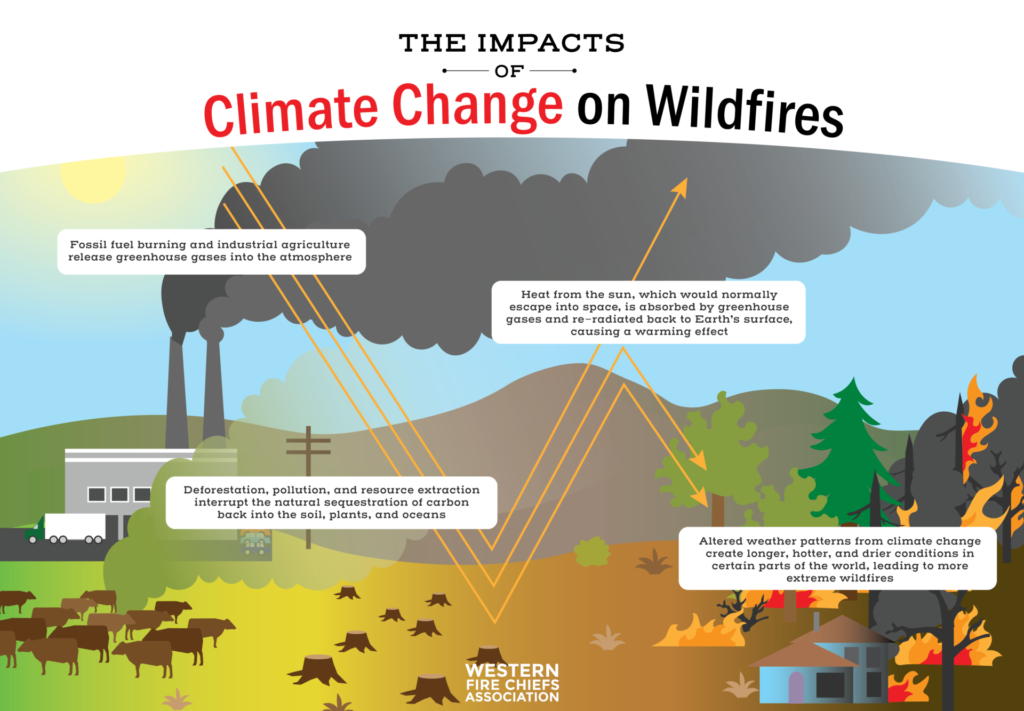
Burning coal, oil and natural gas releases carbon dioxide (CO₂) directly into the atmosphere. Agricultural practices emit methane (CH₄) from livestock and rice paddies, and nitrous oxide (N₂O) from fertilizer use. Industrial processes add fluorinated gases. These gases have molecular properties that absorb outgoing infrared radiation, creating a warming “blanket”.
2. Radiative Forcing and Temperature Response
The accumulated greenhouse‑gas concentrations increase Earth’s radiative forcing—the net energy added to the climate system. Climate models calibrated with physical laws translate this forcing into an expected surface temperature rise. Observations show the predicted warming matches measured temperature records.
3. Feedback Loops
Warming triggers feedbacks that amplify the initial forcing. For example, higher temperatures melt Arctic sea ice, reducing surface albedo and allowing more solar absorption. Warmer air holds more water vapor, itself a potent greenhouse gas, further enhancing warming.
4. Separation from Natural Variability
Natural factors—solar irradiance changes, volcanic aerosol injections, and internal modes like El Niño—affect climate on short time scales. Detection‑and‑attribution studies run ensembles of climate‑model simulations that include only natural forcings and compare them with simulations that also incorporate observed anthropogenic emissions. The latter reproduce the observed warming pattern, while natural‑only runs do not, isolating the human contribution.
What Does the Evidence Show?
Long‑term instrumental temperature records, beginning in the late 19th century, reveal a global mean increase of about 1.1 °C by 2020. The IPCC Sixth Assessment Report (2021) states that it is extremely likely (≥95% probability) that human influence has been the dominant cause of warming since the 1950s. Multiple independent lines of evidence converge:
- Atmospheric monitoring by NOAA and the World Meteorological Organization shows CO₂ concentrations rising from 280 ppm pre‑industrial to over 420 ppm in 2023.
- Isotopic analysis of carbon in the atmosphere distinguishes fossil‑fuel carbon from natural sources, confirming the recent rise originates largely from combustion.
- Satellite observations of Earth’s energy budget indicate a positive radiative imbalance consistent with anthropogenic forcing.
- Climate‑model attribution studies, such as those summarized by the IPCC, quantify that >99% of the observed warming is attributable to human activities.
Main Causes or Drivers
Direct Causes
- Fossil‑fuel combustion: Generates roughly 65% of total anthropogenic GHG emissions.
- Agricultural emissions: Methane from ruminants and rice paddies, and nitrous oxide from synthetic fertilizers, together account for about 25% of anthropogenic forcing.
- Land‑use change: Deforestation reduces carbon sinks and releases stored carbon, adding ~10% of total human‑derived CO₂.
- Industrial processes: Cement production, steelmaking and refrigerants contribute additional CO₂ and fluorinated gases.
Underlying Drivers
- Economic growth and energy demand in developing regions.
- Policy frameworks that subsidize fossil‑fuel extraction.
- Technological lock‑in of carbon‑intensive infrastructure.
- Consumer patterns that favor high‑emission products.
Environmental and Human Impacts
Environmental Impacts
Elevated temperatures drive sea‑level rise through thermal expansion and glacier melt, threatening coastal ecosystems. Ocean acidification, caused by CO₂ dissolution, harms coral reefs and shell‑forming marine organisms. Shifts in precipitation patterns increase the frequency of droughts in some regions and intense rainfall in others, altering freshwater availability and ecosystem composition.
Human Health and Social Impacts
Heatwaves raise mortality risk, especially among the elderly and outdoor workers. Expanded ranges of disease‑carrying vectors, such as mosquitoes, increase the incidence of malaria and dengue. Food security is jeopardized by reduced crop yields in heat‑stressed regions, potentially exacerbating poverty and migration pressures.
Economic and Infrastructure Impacts
Extreme weather events impose higher costs on insurance, disaster relief and infrastructure repair. Climate‑related disruptions to supply chains affect global markets. Adaptation measures, such as flood defenses, require substantial public investment.
Regional Differences
High‑latitude regions experience amplified warming—up to three times the global average—due to ice‑albedo feedbacks. Tropical Pacific islands face sea‑level rise and erosion despite modest temperature increases. In sub‑Saharan Africa, reduced rainfall combined with higher temperatures stresses agriculture, whereas parts of northern Europe may see longer growing seasons but also increased flood risk. These variations stem from local geography, baseline climate, and socioeconomic resilience.
What Scientists Know With High Confidence
- Human‑generated greenhouse gases are the dominant cause of global warming since the mid‑20th century.
- CO₂, CH₄ and N₂O together account for the majority of anthropogenic radiative forcing.
- Observed warming patterns match model simulations that include anthropogenic emissions.
- Continued emissions at current rates will likely exceed the 1.5 °C warming limit set by the Paris Agreement.
What Remains Uncertain
Key uncertainties include the magnitude of climate sensitivity—the temperature response to a doubling of CO₂—and the future trajectory of non‑CO₂ gases such as methane, which depend on agricultural practices and natural feedbacks. Regional climate projections, especially for precipitation extremes, have higher variance due to limited observational networks and model resolution. Better monitoring of permafrost carbon release and improved representation of cloud processes could reduce these uncertainties.
Common Misconceptions
Misconception: Natural factors are responsible for most warming.
Reality: While natural factors influence short‑term variability, detection‑and‑attribution studies show that they cannot explain the sustained warming trend observed since the 1950s. Human emissions are the primary driver.
Misconception: The percentage is less than 50% because climate has always varied.
Reality: The IPCC reports that more than 99% of the warming since the mid‑20th century is attributable to anthropogenic activities, reflecting a very high confidence level.
Misconception: Reducing personal carbon footprints will stop climate change.
Reality:
Solutions and Limitations
Mitigation strategies target the root causes of emissions. Transitioning to renewable electricity (solar, wind, hydro) can cut CO₂ from power generation, yet intermittency and grid integration require storage and policy support. Improving energy efficiency in buildings and industry reduces demand but may be offset by rebound effects if savings lead to increased consumption. Sustainable agriculture practices—such as precision fertilization and methane‑reducing livestock diets—lower CH₄ and N₂O emissions, though adoption costs and cultural barriers can limit uptake.
Adaptation measures, such as constructing sea walls, developing drought‑resilient crops and enhancing early‑warning systems, reduce vulnerability but do not address the underlying driver of warming. Nature‑based solutions, like restoring wetlands and reforestation, sequester carbon and provide co‑benefits for biodiversity, yet their capacity is limited by land availability and permanence concerns.
What Individuals, Communities, and Governments Can Do
What Individuals Can Do
- Reduce household energy use through insulation, LED lighting and efficient appliances.
- Choose low‑carbon transportation: public transit, cycling, walking, or electric vehicles where feasible.
- Support policies and candidates that prioritize renewable energy and carbon pricing.
- Adopt a plant‑rich diet and minimize food waste to lower agricultural emissions.
What Communities and Organizations Can Do
- Implement district‑level renewable energy projects and community solar programs.
- Develop local climate‑action plans that incorporate vulnerable population needs.
- Promote green building standards for new construction and retrofits.
What Governments Can Do
- Enact and strengthen carbon‑pricing mechanisms to internalize the cost of emissions.
- Set ambitious renewable‑energy targets and phase out coal subsidies.
- Invest in public transit infrastructure and electric‑vehicle charging networks.
- Fund research on climate‑sensitive crops and resilient water management.
Closing Synthesis
The scientific record shows with very high confidence that human activities—principally the combustion of fossil fuels and land‑use change—account for virtually all of the warming observed since the mid‑20th century. This attribution is grounded in multiple, independent lines of evidence, from atmospheric measurements to sophisticated model simulations. While uncertainties remain regarding climate sensitivity and regional projections, they do not undermine the central conclusion of overwhelming anthropogenic influence. Effective response requires a blend of mitigation to curb emissions, adaptation to protect vulnerable communities, and systemic policy action, complemented by informed individual and community choices.
Frequently Asked Questions
What percentage of recent warming is attributed to human activities?
Scientific assessments attribute about 100% of the warming since the mid‑20th century to human‑driven greenhouse‑gas emissions, with a very high confidence level.
How do scientists separate human influence from natural factors?
They use detection‑and‑attribution studies that compare observed temperature trends with climate‑model simulations that include only natural forcings and those that add anthropogenic emissions, showing the human signal matches observations.
Which greenhouse gases contribute most to anthropogenic warming?
Carbon dioxide accounts for roughly 60% of total anthropogenic radiative forcing, methane about 20%, and nitrous oxide around 6%; the remaining forcing comes from fluorinated gases and other minor contributors.
Are there regions where natural variability masks human warming?
Short‑term fluctuations such as volcanic eruptions or El Niño events can temporarily enhance or dampen warming, but the long‑term trend across all regions remains dominated by human emissions.
What actions can individuals take that meaningfully reduce climate change?
While personal choices alone cannot stop global warming, actions like reducing household energy use, choosing low‑carbon transportation, supporting renewable‑energy policies and advocating for systemic change can collectively lower emissions.







Leave a Comment