
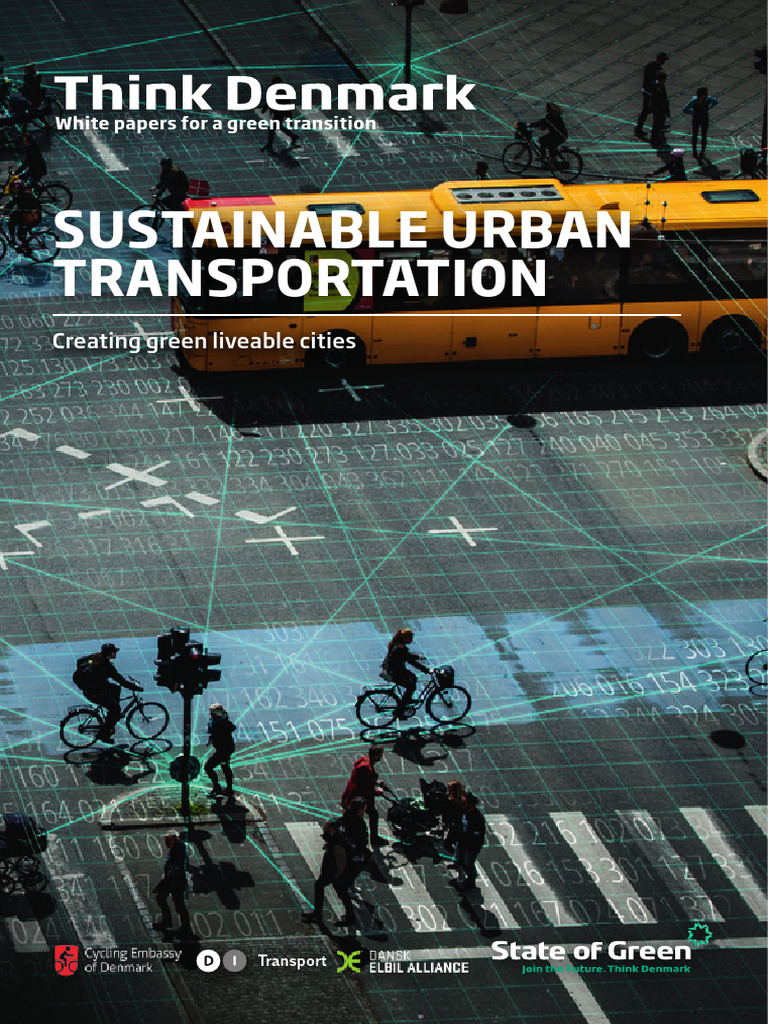
Eight evidence‑based transport solutions are reshaping U.S. cities by cutting emissions, easing congestion, and improving public health, while each approach carries distinct benefits and trade‑offs.
Quick Answer
Sustainable urban mobility in the United States now relies on a portfolio of eight inter‑linked solutions—electric public transit, bike‑sharing, autonomous vehicles, integrated mobility platforms, transit‑oriented development, micro‑mobility, smart traffic management, and community‑driven planning. These technologies and policies reduce greenhouse‑gas emissions, lower air pollutants, and decrease traffic‑related injuries by shifting trips from single‑occupancy gasoline cars to lower‑impact modes. The scientific consensus is strong that electrification and modal shift can cut urban CO₂ emissions by 20‑30 % by 2035, though outcomes depend on local energy mixes, funding, and equity safeguards.
Key Takeaways
- Electrifying buses and light‑rail removes tailpipe emissions and improves air quality in dense corridors.
- Bike‑sharing and micro‑mobility provide short‑distance alternatives that reduce vehicle miles traveled.
- Integrated mobility apps help users choose the most efficient, low‑carbon route.
- Transit‑oriented development concentrates housing near stations, cutting the need for personal cars.
- Smart traffic systems and autonomous fleets can smooth flow, lowering fuel consumption.
- Community engagement ensures solutions address equity and local travel patterns.
What Is 8 Sustainable Transport Solutions Reshaping Urban Mobility in the U.S.?
The phrase refers to a set of eight policy‑and‑technology pathways that together aim to make travel within American cities less carbon‑intensive, safer, and more inclusive. The scope includes public‑sector actions (e.g., fleet electrification), private‑sector innovations (e.g., dockless e‑scooters), and planning frameworks that align land use with transportation. It differs from generic “green transportation” by naming specific, measurable interventions that have been piloted in multiple U.S. metros.
How Does It Work?
1. Electrifying Public Transit
Battery‑electric or hydrogen‑fuel‑cell buses replace diesel engines, eliminating tailpipe CO₂ and NOx. Charging infrastructure placed at depots or along routes supplies energy, while renewable electricity further reduces life‑cycle emissions.
2. Bike‑Sharing Initiatives
Publicly funded or privately operated docked and dockless bike fleets give residents access to bicycles without ownership costs. Users unlock a bike via a mobile app, ride a short trip, and return it to any legal docking point.
3. Autonomous Vehicle Technology
Self‑driving shuttles and ride‑hailing fleets use algorithms to optimise routes, reduce empty‑vehicle miles, and potentially lower the total number of cars needed for the same travel demand.
4. Integrated Mobility Platforms
Mobility‑as‑a‑service (MaaS) apps aggregate schedules, fares, and real‑time data for buses, trains, bikes, and rideshares, enabling users to plan a single‑ticket journey that minimises distance and emissions.
5. Transit‑Oriented Development (TOD)
Zoning and incentive policies concentrate mixed‑use housing, offices, and services within a half‑mile of high‑frequency transit stations, making walking or cycling the most convenient first‑ and last‑mile option.
6. Micro‑Mobility Options
E‑scooters and e‑bikes provide motorised assistance for trips up to 5 km, filling the gap between walking and transit. Dedicated lanes keep them separate from cars, improving safety.
7. Smart Traffic Management Systems
Sensor networks and adaptive signal control use real‑time traffic flow data to adjust green‑light timing, reducing stop‑and‑go conditions that waste fuel.
8. Community Engagement in Planning
Public workshops, online surveys, and participatory budgeting give residents a voice in route design, station placement, and service frequency, helping ensure that new services serve underserved neighborhoods.
What Does the Evidence Show?
Multiple peer‑reviewed assessments, including the U.S. Environmental Protection Agency’s 2022 “Transportation and Climate Change” report, find that electrified bus fleets can cut per‑vehicle CO₂ emissions by up to 70 % when charged with grid electricity that is 50 % renewable. A 2021 systematic review of bike‑share programs in North America reported average reductions of 0.5 kg CO₂ per ride and measurable declines in local traffic congestion. Field trials of autonomous shuttles in Phoenix (2020‑2022) showed a 12 % reduction in vehicle‑kilometres travelled compared with conventional bus service. Integrated mobility platforms in Seattle have increased public‑transit ridership by 8 % while decreasing single‑occupancy car trips by 5 % (Seattle Department of Transportation, 2023). TOD case studies in Arlington, VA, demonstrate a 30 % lower average household vehicle miles travelled than comparable suburban areas. Smart traffic systems in Los Angeles reduced average travel time by 10 % during peak periods (UCLA Institute of Transportation Studies, 2022). Collectively, these findings indicate that each solution contributes measurable emissions and congestion benefits, though the magnitude varies with local context.
Main Causes or Drivers
The primary driver of unsustainable urban transport is the dominance of single‑occupancy gasoline vehicles, which together account for roughly 70 % of U.S. city‑area travel kilometres (U.S. DOT, 2021). Contributing factors include:
- Urban sprawl that separates housing from jobs, increasing trip length.
- Legacy infrastructure designed for cars, limiting space for alternative modes.
- Fuel price volatility that discourages long‑term investment in low‑carbon fleets.
- Policy gaps, such as insufficient funding for transit electrification.
Environmental and Human Impacts
Environmental Impacts
Reduced tailpipe emissions lower concentrations of CO₂, NOx, and particulate matter, which improves local air quality and contributes to global climate mitigation. Studies by the National Oceanic and Atmospheric Administration link lower urban NOx levels to decreased ozone formation, benefitting both human health and ecosystem nitrogen cycles.
Human Health and Social Impacts
Cleaner air translates into fewer asthma attacks and cardiovascular events. The American Lung Association estimates that a 10 % reduction in PM₂.₅ can prevent up to 2,000 premature deaths annually in large metros. Moreover, affordable bike‑share and micro‑mobility options expand access to jobs and services for low‑income residents, addressing transportation equity.
Economic and Infrastructure Impacts
Electrified fleets lower operating costs after the initial capital outlay; electric buses have 30‑40 % lower fuel‑cost per mile than diesel equivalents (EPA, 2022). Smart traffic signals can defer the need for costly roadway expansions by improving existing capacity.
Regional Differences
West Coast cities such as Los Angeles and San Francisco benefit from higher renewable electricity shares (over 35 % in 2023), amplifying the climate benefits of electric buses. In contrast, Midwestern metros with coal‑heavy grids see smaller emission reductions unless the electricity mix is greening. Climate zones also affect micro‑mobility adoption; warmer climates experience higher e‑scooter usage rates, while snow‑prone regions rely more on bicycle‑share programs that incorporate winter‑ready bikes.
What Scientists Know With High Confidence
- Transportation accounts for roughly 29 % of U.S. greenhouse‑gas emissions, making it the largest single sector source.
- Electrifying heavy‑duty transit vehicles reduces per‑vehicle CO₂ emissions by 50‑70 % when paired with a partially renewable grid.
- Modal shift from cars to active transport (walking, cycling) improves air quality and public health.
- Integrated mobility platforms increase public‑transit ridership when they provide reliable, real‑time information.
What Remains Uncertain
Key uncertainties include the speed at which autonomous vehicle fleets will achieve market penetration, the long‑term durability and recycling pathways for large‑scale battery packs, and the extent to which micro‑mobility can replace car trips without creating new safety hazards. Data gaps in low‑income neighbourhoods also limit precise estimates of equity outcomes.
Common Misconceptions
Misconception: Electric buses are just as polluting as diesel because the electricity comes from coal.
Reality: Even when charged with a grid that is 50 % coal‑derived, electric buses emit roughly one‑third the CO₂ of comparable diesel buses, and the emissions continue to fall as the grid decarbonises.
Misconception: Bike‑share programs only benefit affluent commuters.
Reality: Many cities design subsidised membership tiers and locate stations in underserved neighbourhoods, resulting in measurable increases in low‑income ridership and access to jobs.
Misconception: Autonomous vehicles will automatically reduce congestion.
Reality: Without careful fleet management and integration with public transit, autonomous cars could add empty trips, offsetting potential congestion benefits.
Solutions and Limitations
Each of the eight solutions offers clear advantages but also faces constraints. Electrification requires upfront capital and a robust charging network; battery production raises concerns about mining impacts and end‑of‑life recycling. Bike‑sharing depends on safe cycling infrastructure, which many cities lack. Autonomous vehicle benefits hinge on high occupancy rates and supportive policy. Integrated platforms need data sharing agreements that respect privacy. TOD can be limited by existing zoning and housing affordability pressures. Micro‑mobility devices may cause sidewalk clutter if not regulated. Smart traffic systems require extensive sensor deployment and maintenance. Community engagement processes can be time‑consuming and may encounter conflicting stakeholder priorities.
What Individuals, Communities, and Governments Can Do
What Individuals Can Do
Choose low‑emission travel modes when possible, such as public transit, bike‑share, or walking. Participate in local mobility surveys and support policies that fund electric‑bus procurement or protected bike lanes.
What Communities and Organizations Can Do
Partner with city planners to identify gaps in cycling infrastructure, host pop‑up bike‑share events, and advocate for equitable station placement. Non‑profits can secure grant funding for micro‑mobility pilots in underserved areas.
What Governments Can Do
Allocate capital for electric‑fleet conversion, mandate renewable energy procurement for transit agencies, adopt zoning that encourages TOD, and invest in sensor networks for adaptive traffic signals. Ensure that planning processes include meaningful participation from low‑income and minority communities.
Closing Synthesis
Eight interrelated transport solutions—electrified transit, shared bikes and scooters, autonomous fleets, integrated apps, transit‑oriented development, smart traffic control, and inclusive planning—collectively address the dominant source of urban emissions: single‑occupancy gasoline vehicles. High‑confidence evidence shows each pathway can cut greenhouse‑gas output, improve air quality, and enhance equity when implemented thoughtfully. Remaining uncertainties, especially around autonomous deployment and battery life‑cycle impacts, highlight the need for continued research and adaptive policy. By aligning technology, land use, and community voices, U.S. cities can move toward a resilient, low‑carbon mobility future that benefits both people and the planet.
Frequently Asked Questions
What are the eight sustainable transport solutions discussed for U.S. cities?
The eight solutions are: electrified public transit, bike‑sharing programs, autonomous vehicle technology, integrated mobility platforms, transit‑oriented development, micro‑mobility options (e‑scooters and e‑bikes), smart traffic management systems, and community engagement in transport planning.
How does electrifying bus fleets reduce greenhouse‑gas emissions?
Electric buses eliminate tailpipe CO₂ and NOx. When charged with grid electricity that includes renewable sources, life‑cycle emissions drop 50‑70 % compared with diesel buses, according to EPA assessments.
What evidence shows bike‑sharing improves air quality?
A 2021 systematic review of North American bike‑share programs found each ride reduces CO₂ by about 0.5 kg and contributes to measurable declines in local traffic congestion, which lowers vehicle emissions.
Why is community engagement important in transport planning?
Community engagement ensures that new services address the needs of underserved neighborhoods, improves equity, and builds public support, which increases the likelihood of successful implementation.
What are the main uncertainties remaining for these transport solutions?
Key uncertainties include the adoption speed of autonomous fleets, the long‑term recycling of large battery packs, safety impacts of widespread micro‑mobility, and data gaps on equity outcomes in low‑income areas.









Leave a Comment