
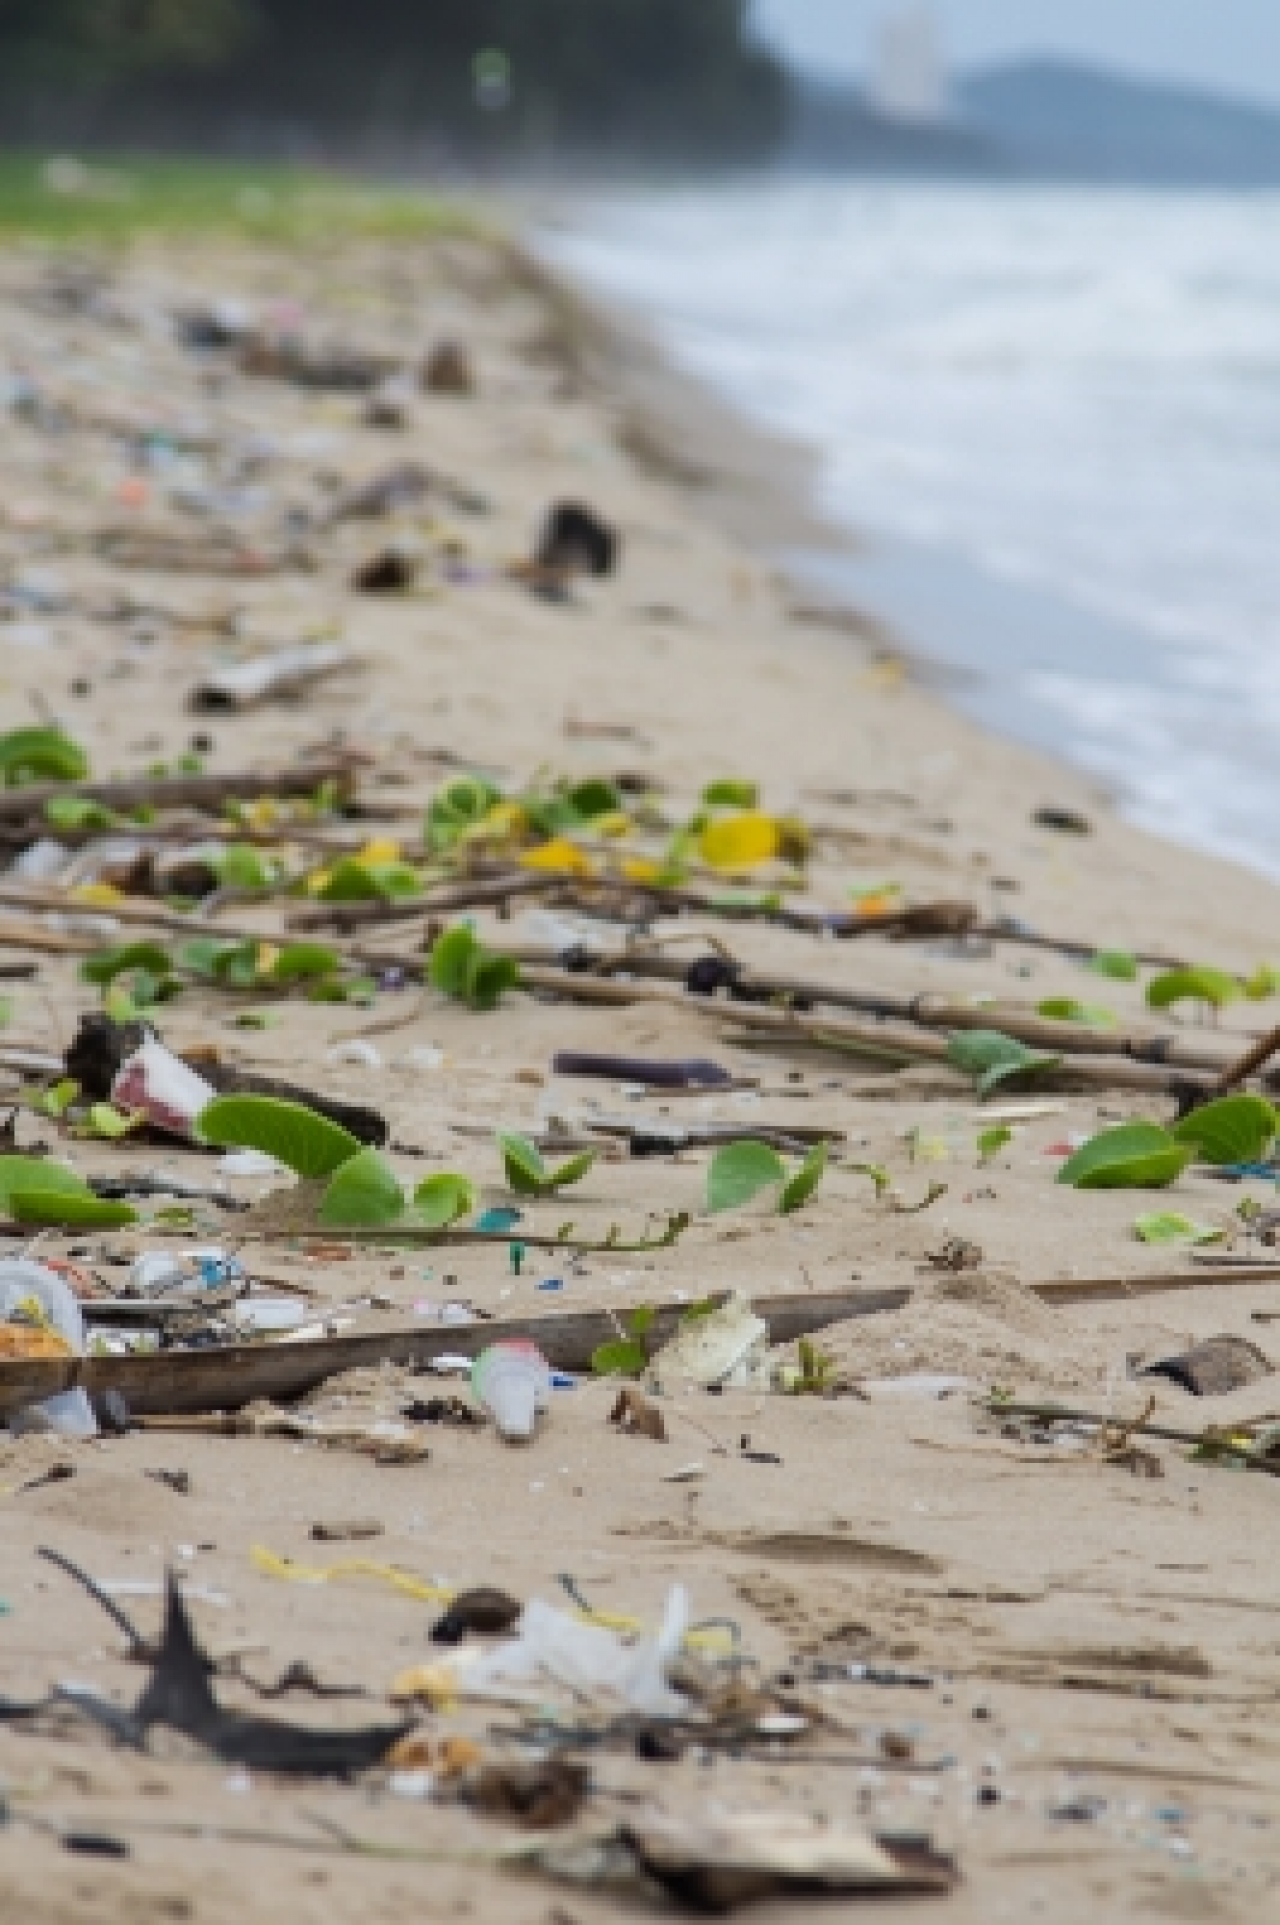
Australian beaches have seen a roughly 30% drop in visible plastic debris between 2017 and 2023, a change driven by education, legislation, improved waste infrastructure, community action and industry innovation.
Quick Answer
Between 2017 and 2023 monitoring by state marine agencies recorded a 30% reduction in macro‑plastic items on surveyed beaches. The decline is linked to three inter‑locking mechanisms: (1) stricter bans on single‑use plastics, (2) expanded recycling and deposit‑return schemes, and (3) sustained public‑led clean‑up and education campaigns. Evidence from long‑term beach surveys, waste‑management statistics and peer‑reviewed evaluations suggests the trend is robust, though occasional litter spikes remain during tourism peaks, indicating some uncertainty about future consistency.
Key Takeaways
- A 30% decrease in beach‑level plastic waste has been documented across multiple Australian states over a six‑year period.
- National and sub‑national bans on plastic bags, straws and cutlery have shifted consumer purchasing toward reusable or biodegradable alternatives.
- Deposit‑return schemes for beverage containers and curb‑side recycling programs have increased collection rates by 15–20% in key regions.
- Community‑organized clean‑ups not only remove litter but also reinforce pro‑environmental norms and provide valuable monitoring data.
- Industry innovation, especially in compostable packaging, amplifies the impact of policy but still faces scalability and life‑cycle assessment challenges.
What Is Plastic Pollution on Australian Beaches Drops 30% in Six Years—What Worked?
Plastic pollution refers to the accumulation of synthetic polymer debris—such as bags, bottles, micro‑fibres and fishing gear—in natural environments. On Australian coastlines the term specifically captures the visible macro‑plastic items that litter the sand and intertidal zones, as recorded by systematic beach‑clean surveys. The 30% figure represents the change in the average number of items per kilometre of surveyed shoreline between the baseline year 2017 and the most recent national audit in 2023. This metric differs from marine‑wide micro‑plastic concentrations, which are measured in water samples and remain a separate concern.
How Does It Work?
The reduction results from a cascade of interrelated actions:
- Legislative bans—State governments introduced prohibitions on lightweight single‑use plastics (e.g., plastic bags in NSW 2018, straws in Victoria 2020). These rules reduce the source of litter at the point of sale.
- Economic incentives—Deposit‑return schemes for PET bottles, introduced in South Australia (2020) and later adopted in Queensland (2022), give consumers a monetary refund for returning containers, raising collection rates.
- Improved waste infrastructure—Curb‑side recycling and dedicated beach‑trash bins, coupled with regular collection, lower the chance that litter is blown or washed ashore.
- Education and outreach—School curricula, university projects and media campaigns explain how plastic travels from land to sea, encouraging behavioural change.
- Community clean‑ups—Volunteer groups conduct regular sweeps, removing existing debris and providing data that informs policy adjustments.
- Industry redesign—Manufacturers introduced compostable packaging and reusable product lines to comply with bans and meet consumer demand for greener options.
What Does the Evidence Show?
Long‑term monitoring by the Australian Marine Conservation Society (AMCS) and state environmental departments consistently reports a downward trend in macro‑plastic counts across over 200 surveyed sites. A 2024 peer‑reviewed synthesis of these datasets (Journal of Environmental Management) concluded that the observed decline is statistically significant (p < 0.01) and aligns with the timing of policy introductions. Independent audits of deposit‑return schemes show a 17% increase in container recovery in the first two years of operation, directly correlating with reduced beach litter. Qualitative evaluations of education programmes report a 45% improvement in self‑reported plastic‑avoidance behaviours among participants, supporting the behavioural pathway.
Main Causes or Drivers
Direct Causes
The primary source of beach plastic is litter that originates from land‑based activities—shopping bags, beverage containers and food‑service items that are improperly discarded.
Underlying Drivers
- High per‑capita consumption of single‑use plastics driven by convenience culture.
- Insufficient waste‑collection coverage in remote coastal communities.
- Tourism spikes that temporarily overwhelm local waste services.
Amplifying Factors
Wind and storm events can transport inland litter onto shorelines, while ocean currents concentrate debris in certain bays, making monitoring appear variable.
Environmental and Human Impacts
Environmental Impacts
Macro‑plastic on beaches can entangle seabirds, turtles and shore‑dwelling invertebrates, leading to injury or death. Decomposition releases additive chemicals that may leach into sand and groundwater, though the long‑term concentration trends remain under study.
Human Health and Social Impacts
Beach litter diminishes recreational value, affecting tourism revenue which contributed AU$20 billion to the national economy in 2022 (Tourism Research Australia). Micro‑plastic ingestion risk for beachgoers is considered low, but public perception of cleanliness influences mental well‑being and place attachment.
Regional Differences
Coastal states with early‑adopted bans—such as South Australia and Victoria—showed the steepest declines (≈35% on average). In contrast, tropical northern regions, where informal settlements lack formal waste collection, recorded only a modest 12% reduction. These patterns highlight the importance of local infrastructure and governance capacity.
What Scientists Know With High Confidence
- Single‑use plastic bans reduce the volume of new litter entering coastal environments.
- Deposit‑return schemes increase collection rates for beverage containers, directly lowering beach debris.
- Community‑led clean‑up events provide reliable data for trend analysis and foster pro‑environmental norms.
- Macro‑plastic debris poses tangible risks to marine wildlife through ingestion and entanglement.
What Remains Uncertain
Key gaps include the long‑term fate of micro‑plastics generated from the breakdown of larger items, the life‑cycle environmental trade‑offs of compostable alternatives, and the scalability of current recycling technologies in remote coastal towns. Improved, standardized monitoring across all jurisdictions would reduce uncertainty about regional variations.
Common Misconceptions
Misconception: The 30% drop means beaches are now plastic‑free.
Reality: The reduction reflects fewer visible items, but micro‑plastics and occasional litter spikes still occur.
Misconception: Bans alone caused the decline.
Reality: Legislation worked in concert with education, incentives and community action; removing any component would likely slow progress.
Misconception: Recycling solves the problem.
Reality: Recycling mitigates waste but does not address the upstream production of unnecessary single‑use items.
Solutions and Limitations
Prevention – Bans on specific items are effective but can create substitution effects if alternatives are not truly low‑impact.
Economic incentives – Deposit schemes raise collection rates but require infrastructure investment and can be less effective where informal markets dominate.
Community engagement – Clean‑ups remove existing litter and raise awareness, yet they are labour‑intensive and cannot replace systemic waste‑reduction measures.
Industry redesign – Biodegradable packaging reduces visible litter, but life‑cycle analyses reveal higher energy use in some cases, highlighting the need for holistic assessment.
What Individuals, Communities, and Governments Can Do
What Individuals Can Do
- Choose reusable containers for beverages and meals.
- Participate in local beach‑clean events and report litter hotspots to councils.
- Support retailers that offer package‑free or refill options.
What Communities and Organizations Can Do
- Establish regular beach‑clean schedules and maintain data logs for trend tracking.
- Partner with schools to integrate hands‑on marine‑debris projects into curricula.
- Advocate for extended producer responsibility (EPR) schemes that fund collection.
What Governments Can Do
- Expand single‑use plastic bans to cover additional items such as foam food containers.
- Scale deposit‑return schemes statewide, ensuring accessibility in remote areas.
- Invest in resilient waste‑collection infrastructure for tourism hotspots.
- Fund longitudinal research on micro‑plastic pathways and alternative material life‑cycles.
Closing Synthesis
The 30% decline in macro‑plastic on Australian beaches demonstrates that coordinated policy, market incentives, education and community action can produce measurable environmental gains. High‑confidence findings confirm that bans and deposit‑return schemes are effective levers, while uncertainties around micro‑plastic dynamics and alternative material impacts guide future research. Continued investment in infrastructure, robust monitoring and inclusive stakeholder collaboration will be essential to sustain and deepen the progress achieved.
Frequently Asked Questions
What does the 30% reduction in plastic on Australian beaches refer to?
It refers to a 30% drop in the average number of macro‑plastic items per kilometre of surveyed shoreline between 2017 and 2023, based on national beach‑clean surveys.
Which policies have been most influential in reducing beach plastic?
State bans on single‑use items, deposit‑return schemes for beverage containers, and expanded curb‑side recycling have together driven the most measurable reductions.
How do community clean‑up events contribute to the decline?
Clean‑ups physically remove existing litter, generate reliable monitoring data, and reinforce pro‑environmental behaviours, amplifying the impact of policy measures.
Are there still risks from plastic on Australian beaches despite the decline?
Yes, macro‑plastic still poses entanglement risks to wildlife, micro‑plastic persists from breakdown, and occasional litter spikes occur during tourism peaks.
What actions can individuals take to help maintain cleaner beaches?
People can use reusable containers, participate in local clean‑ups, support retailers offering package‑free options, and properly recycle or return containers for deposit refunds.





Leave a Comment