
Earth’s polar ice caps have lost a measurable amount of ice over recent decades, driven largely by rising global temperatures, with significant implications for sea level, ecosystems, and human societies.
Quick Answer
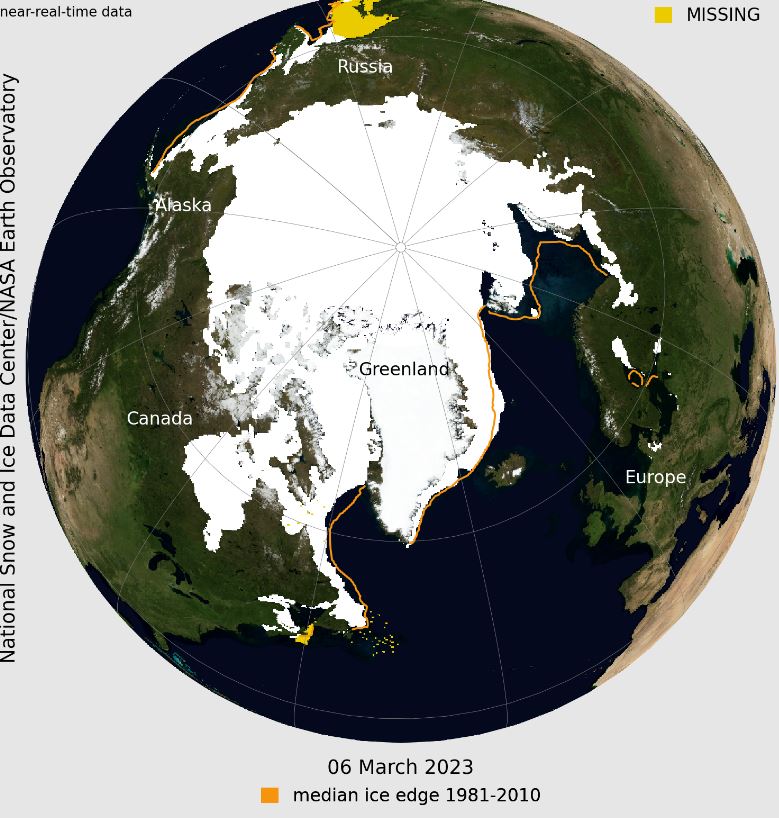
The Arctic sea‑ice extent has fallen from an average of about 7 million km² in the 1980s to roughly 3.4 million km² in summer 2021, while the Greenland Ice Sheet shed an estimated 3,800 Gt of ice between 1992 and 2020, contributing close to 10 mm to global sea‑level rise. The West Antarctic Ice Sheet adds another ~7 mm of sea‑level rise over the past four decades. These observations, documented by satellite monitoring and field studies, indicate that a substantial but still partial melt has occurred, and the trend is expected to continue under ongoing greenhouse‑gas emissions. Uncertainty remains about the exact timing of potential rapid ice‑sheet collapse, especially in Antarctica.
Key Takeaways
- Arctic summer sea‑ice area has declined by more than 50% since the 1980s.
- Greenland lost ~3,800 Gt of ice from 1992‑2020, raising sea level by ~10 mm.
- West Antarctic Ice Sheet contributed ~7 mm of sea‑level rise in the last 40 years.
- Continued warming threatens accelerated melt, especially in Antarctica, with possible multi‑meter sea‑level rise over centuries.
- Mitigation of greenhouse‑gas emissions and adaptive coastal planning are the primary strategies to limit future impacts.
What Is How Much Have Earth’s Ice Caps Already Melted?
The phrase refers to the quantified loss of frozen water stored in the Arctic sea‑ice cover, the Greenland Ice Sheet, and the Antarctic ice sheets since the late 20th century. It is a measurement of mass (in gigatonnes) and area (in square kilometres) change, derived from satellite gravimetry, laser altimetry, and in‑situ observations. Unlike seasonal fluctuations, the long‑term trend reflects a net reduction in ice volume that contributes to global sea‑level rise.
How Does It Work?
Physical Processes Behind Ice‑Cap Melt
- Surface melting and runoff: Higher atmospheric temperatures increase meltwater production on ice surfaces, especially in Greenland and the Antarctic Peninsula.
- Oceanic basal melting: Warmer ocean currents erode the undersides of floating ice shelves, thinning them and reducing buttressing of inland ice.
- Albedo feedback: As ice retreats, darker ocean or land surfaces absorb more solar radiation, further accelerating warming.
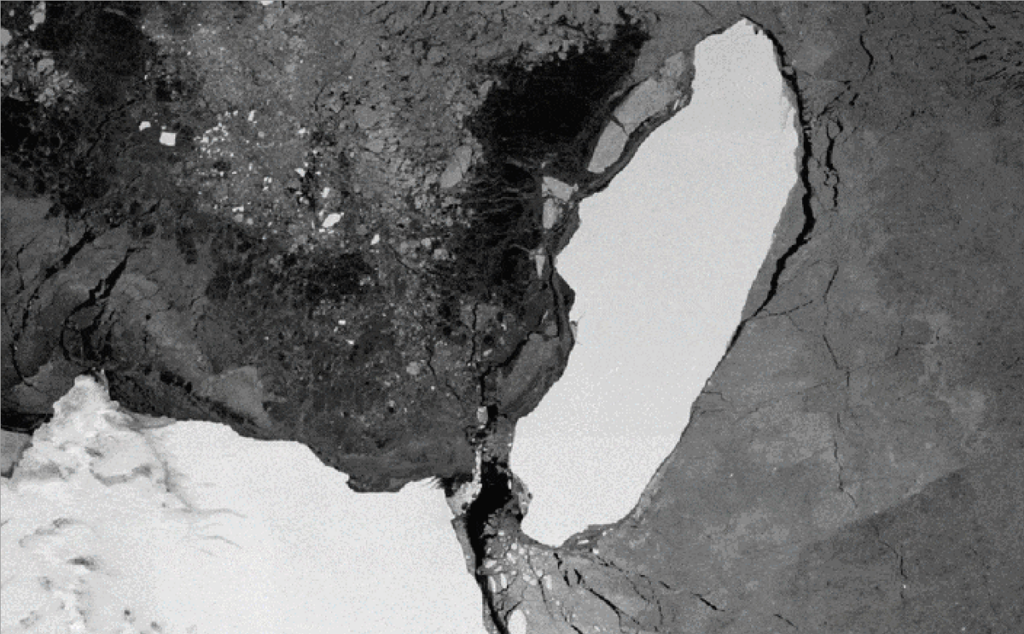
- Dynamic ice discharge: Thinning ice streams flow faster toward the ocean, delivering ice mass as iceberg calving.
Timescales and Thresholds
Surface melt responds on seasonal to decadal scales, while basal melting and ice‑sheet dynamics can involve multi‑decadal to centennial timescales. Climate models suggest that once a critical threshold of warming is passed—approximately 1.5 °C above pre‑industrial levels for the Arctic—feedbacks may amplify loss rates.
What Does the Evidence Show?
Multiple lines of high‑confidence evidence confirm ongoing ice‑cap loss:
- Satellite observations: NASA’s MODIS and ESA’s CryoSat missions record a steady decline in Arctic sea‑ice extent and thickness since the early 1980s.
- GRACE gravimetry: The Gravity Recovery and Climate Experiment (GRACE) satellite pair measured a net loss of ~3,800 Gt from the Greenland Ice Sheet between 1992 and 2020 (IPCC, 2021).
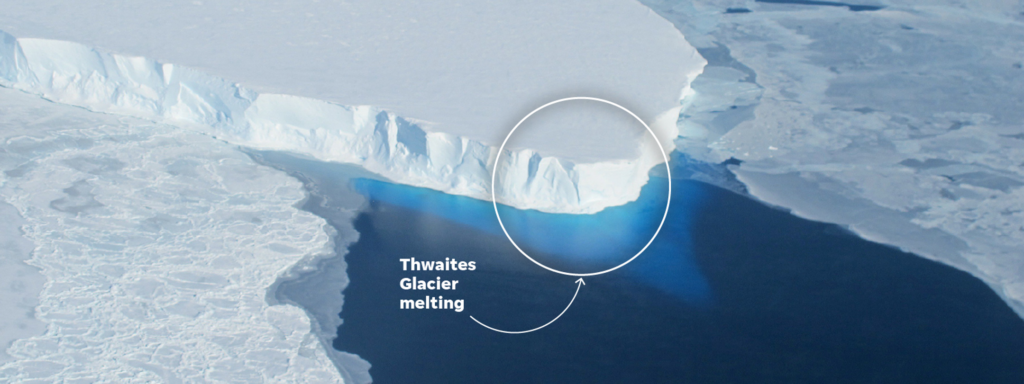
- Field surveys: Ice‑core and GPS measurements in West Antarctica document thinning of the Pine Island and Thwaites glaciers, contributing ~7 mm of sea‑level rise since 1980 (NASA, 2022).
- Sea‑level records: Tide‑gauge and satellite altimetry indicate a global mean sea‑level rise of about 20 cm since 1900, with ~30 % attributable to ice‑cap melt (IPCC, 2021).
These observations are consistent across independent datasets, reinforcing the conclusion that a measurable portion of Earth’s polar ice has already disappeared.
Main Causes or Drivers
Human‑Induced Climate Change
Rising concentrations of carbon dioxide, methane, and other greenhouse gases have increased global average temperatures by ~1.1 °C since pre‑industrial times (IPCC, 2021). This warming directly drives surface melt and oceanic heat transport.
Natural Variability
Phenomena such as the Arctic Oscillation and El Niño influence year‑to‑year ice extent, but the long‑term downward trend exceeds natural variability as shown by statistical attribution studies.
Feedback Mechanisms
Albedo reduction, water‑vapor feedback, and melt‑water lubrication of ice‑sheet bases amplify the primary warming signal, accelerating ice loss beyond the direct temperature response.
Environmental and Human Impacts
Environmental Impacts
- Sea‑level rise: Continued melt could raise global sea level by 0.3–0.6 m by 2100 under high‑emission scenarios, threatening low‑lying coastlines.
- Ocean circulation: Freshwater influx may weaken the Atlantic Meridional Overturning Circulation, potentially altering regional climate patterns.
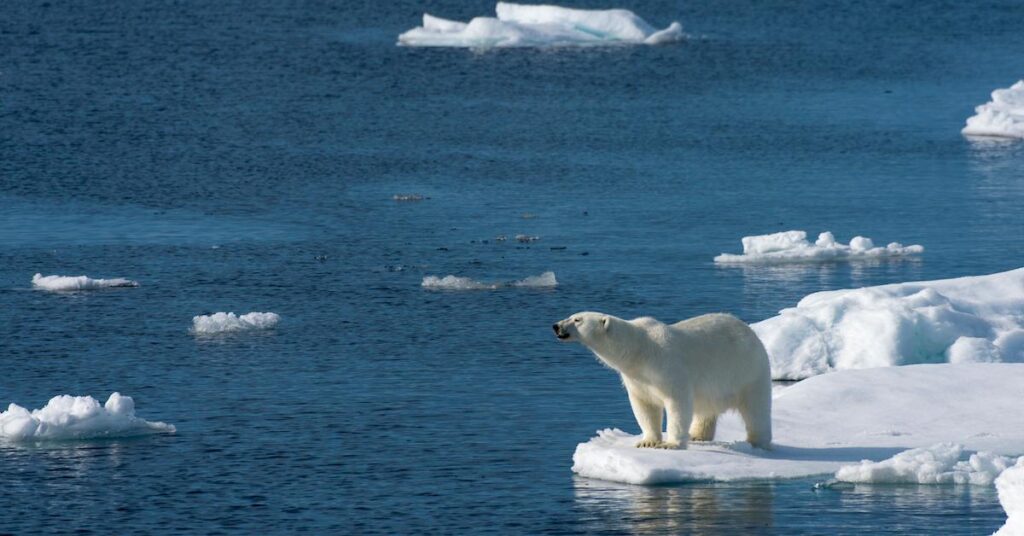
- Biodiversity loss: Species dependent on sea‑ice—such as polar bears, seals, and certain plankton—face habitat shrinkage, leading to population declines.
Human Health and Social Impacts
- Coastal communities confront increased flooding, storm surge, and salinization of freshwater resources.
- Displacement of populations—often termed climate refugees—may intensify social and economic pressures, especially in vulnerable low‑income regions.
- Infrastructure built on permafrost or near coasts (e.g., roads, pipelines, ports) faces higher risk of damage and costly adaptation.
Regional Differences
The magnitude of ice loss and its consequences differ by region:
- Arctic: The greatest relative loss of sea‑ice area, affecting indigenous communities and Arctic shipping routes.
- Greenland: Rapid melt on the southwestern margin influences European sea‑level rise more directly due to proximity.
- West Antarctica: Ice‑shelf destabilization is most pronounced near the Amundsen Sea, with potential global sea‑level implications.
- Tropical islands: Even modest sea‑level rise can inundate atolls, threatening entire nations such as the Maldives and Kiribati.
What Scientists Know With High Confidence
What Scientists Know With High Confidence
- Global temperatures have risen and are the primary driver of observed ice‑cap melt.
- Arctic sea‑ice extent has declined by more than 40 % since the 1980s.
- Greenland Ice Sheet mass loss has accelerated from ~30 Gt yr⁻¹ in the 1990s to >250 Gt yr⁻¹ in the 2010s.
- Ice‑shelf thinning in West Antarctica is linked to warmer circumpolar deep water.
- Sea‑level rise of ~20 cm since 1900 is well documented, with ice‑cap melt accounting for roughly one‑third of that rise.
What Remains Uncertain
What Remains Uncertain
Key uncertainties include the precise timing of a possible rapid collapse of the West Antarctic Ice Sheet, the magnitude of future albedo feedbacks, and how quickly marine‑based ice‑shelf loss may translate into accelerated inland ice discharge. Improved satellite gravimetry and ice‑sheet modeling are expected to narrow these gaps over the next decade.
Common Misconceptions
Common Misconceptions
Misconception: All ice will melt within a few decades.
Reality: While the Arctic sea‑ice cover is projected to become ice‑free in summer within this century under high‑emission pathways, the massive land‑based ice sheets of Greenland and Antarctica will persist for centuries, though they will continue to lose mass.
Misconception: Sea‑level rise is caused only by thermal expansion of water.
Reality: Thermal expansion accounts for about half of observed sea‑level rise; the other half is driven by meltwater from glaciers and ice sheets, as documented by satellite gravimetry.
Misconception: Melting ice caps have no effect on weather.
Reality: Freshwater input can alter ocean circulation patterns, which in turn influence regional climate extremes such as heatwaves and storm tracks.
Solutions and Limitations
Addressing ice‑cap melt requires both mitigation of greenhouse‑gas emissions and adaptation to inevitable changes:
- Mitigation: Rapid decarbonization of energy systems can limit temperature rise, reducing future melt rates. However, the existing inertia in the climate system means some melt will continue even with aggressive cuts.
- Adaptation: Coastal defenses, managed retreat, and resilient infrastructure can reduce vulnerability. These measures are costly and may be socially challenging, especially for low‑income nations.
- Monitoring and Research: Continued satellite observations (e.g., Sentinel‑1, ICESat‑2) improve early warning of rapid ice‑sheet changes, but funding gaps can limit data continuity.
What Individuals, Communities, and Governments Can Do
What Individuals Can Do
- Reduce personal carbon footprints by using energy‑efficient appliances, opting for renewable electricity, and minimizing air travel.
- Support policies and organizations that advocate for strong climate action.
What Communities and Organizations Can Do
- Develop local climate‑resilience plans that address flood risk and infrastructure vulnerability.
- Invest in green infrastructure such as wetlands that buffer sea‑level rise.
What Governments Can Do
- Implement and strengthen nationally determined contributions (NDCs) to achieve net‑zero emissions by mid‑century.
- Fund long‑term monitoring programs for polar ice and sea‑level observations.
- Facilitate equitable relocation strategies for communities at imminent risk.
Synthesis of Key Points
Earth’s ice caps have already lost a measurable amount of ice—over 50 % of Arctic summer sea‑ice area and several thousand gigatonnes from Greenland and West Antarctica—driven primarily by human‑induced warming. The loss contributes directly to sea‑level rise, alters ocean circulation, and threatens ecosystems and coastal societies. High‑confidence science confirms the trend, while uncertainties remain regarding the speed of future collapse, especially in Antarctica. Mitigation of greenhouse gases, robust monitoring, and adaptive planning together offer the most effective path to limit further loss and manage its impacts.
Frequently Asked Questions
How much Arctic sea ice has been lost since the 1980s?
Arctic summer sea‑ice extent has declined from an average of about 7 million square kilometres in the 1980s to roughly 3.4 million square kilometres in 2021, a loss of more than 50 %.
What is the contribution of Greenland’s ice loss to sea‑level rise?
Between 1992 and 2020 Greenland lost an estimated 3,800 gigatonnes of ice, which translates to about 10 millimetres of global sea‑level rise, according to satellite gravimetry data.
Why is West Antarctic ice melt particularly concerning?
The West Antarctic Ice Sheet has contributed roughly 7 mm of sea‑level rise over the past four decades, and its potential rapid collapse could add up to 3.3 metres of sea level over centuries, making it a long‑term risk.
What are the main uncertainties about future ice‑cap melting?
Key uncertainties involve the timing of a possible rapid collapse of the West Antarctic Ice Sheet, the strength of future albedo feedbacks, and how quickly ocean‑driven basal melting will accelerate inland ice discharge.
What actions can governments take to address ice‑cap melt?
Governments can set and meet net‑zero emission targets, fund long‑term polar monitoring programs, and develop equitable coastal‑adaptation and relocation plans to protect vulnerable populations.




Leave a Comment