
Introduction
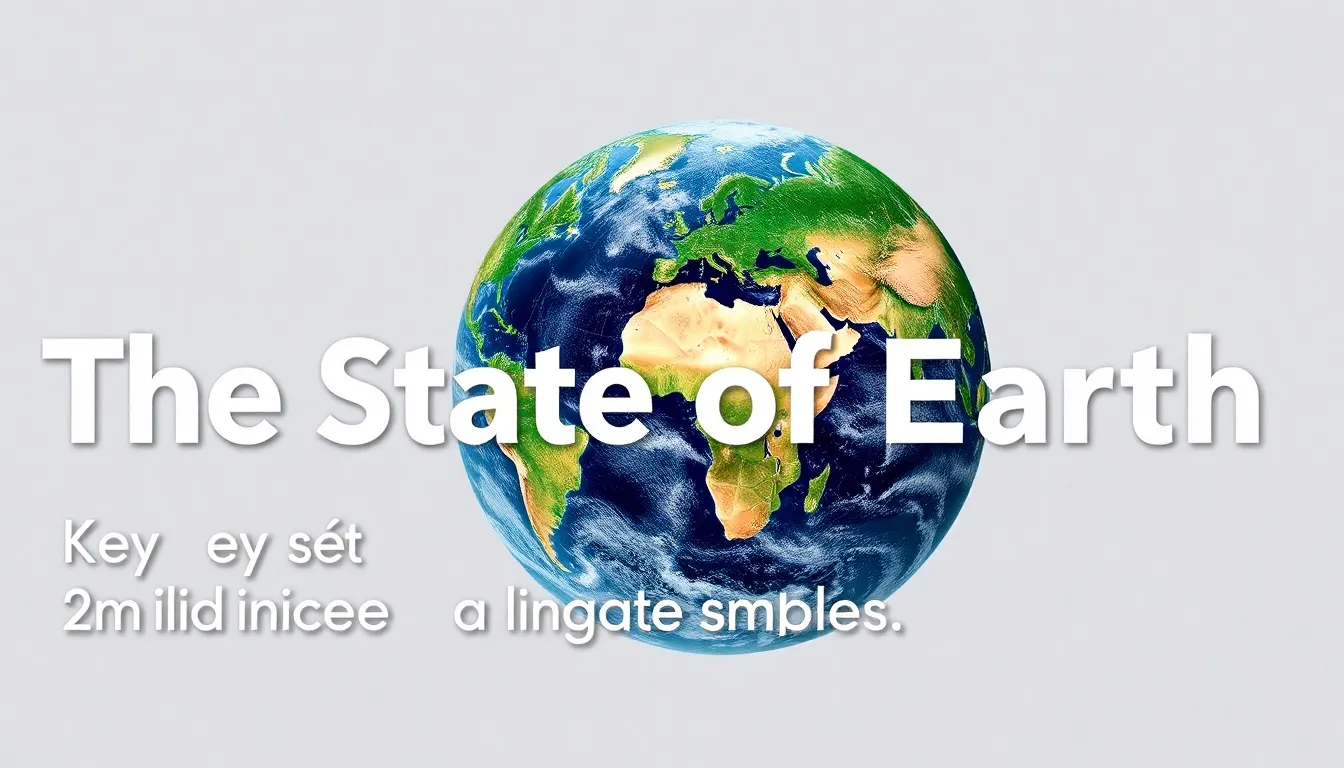
The State of Earth: Key Environmental Indicators Explained offers a clear roadmap for anyone wanting to understand how scientists and policymakers gauge the health of our planet. By tracking measurable signals such as temperature, air quality, water availability, and biodiversity, we can identify trends, assess risks, and design effective interventions. This article unpacks the most widely used indicators, explains why they matter, outlines how they are measured, and highlights both their strengths and limitations. Whether you are a student, activist, or decision‑maker, you will leave with a solid grasp of the metrics that shape global environmental discourse.
What Are Environmental Indicators?
Environmental indicators are quantifiable variables that reflect the condition of natural systems. They translate complex ecological processes into data points that can be monitored over time, compared across regions, and communicated to a broad audience. Indicators are selected for three main reasons:
- Relevance: They directly relate to a specific environmental concern, such as climate change or water scarcity.
- Measurability: Reliable methods exist to collect and verify the data.
- Actionability: The information can inform policy, management decisions, or public behavior.
Because the Earth system is interconnected, a single indicator rarely tells the whole story. Instead, a suite of metrics—often grouped into thematic categories—provides a comprehensive view of planetary health.
Why Monitoring The State of Earth Matters
Understanding the State of Earth is essential for three overlapping audiences:
- Policymakers: Indicators supply the evidence base needed to draft climate legislation, allocate funding for conservation, and meet international commitments such as the Paris Agreement.
- Scientists and Researchers: Consistent data streams enable the detection of long‑term trends, the testing of ecological models, and the identification of emerging threats.
- The General Public: Accessible metrics raise awareness, empower community action, and foster accountability for corporations and governments.
When indicators show deterioration—rising global temperatures, shrinking glaciers, or accelerating species loss—they serve as early warning signals, prompting timely mitigation or adaptation measures.
Core Categories of Key Environmental Indicators
While dozens of specific metrics exist, most assessments focus on six overarching categories. Each category contains several sub‑indicators that together portray the state of a particular Earth system component.
1. Climate Indicators
Climate indicators capture the dynamics of the Earth’s energy balance and greenhouse‑gas concentrations. The most widely cited include:
- Global Mean Surface Temperature: The average temperature across land and ocean surfaces, expressed in degrees Celsius above pre‑industrial levels.
- Atmospheric CO₂ Concentration: Measured in parts per million (ppm) at monitoring stations such as Mauna Loa.
- Sea‑Level Rise: Determined through satellite altimetry and tide‑gauge records, indicating thermal expansion and ice‑sheet melt.
- Extreme Weather Frequency: Trends in heatwaves, hurricanes, and droughts provide insight into climate volatility.
2. Air‑Quality Indicators
Air quality directly affects human health and ecosystem function. Key metrics include:
- Particulate Matter (PM₂.₅ and PM₁₀): Fine particles that penetrate deep into lungs, measured in micrograms per cubic meter (µg/m³).
- Ground‑Level Ozone (O₃): Formed by photochemical reactions, high concentrations can damage crops and respiratory systems.
- NO₂ and SO₂ Levels: Indicators of combustion‑related pollution, often linked to traffic and industrial emissions.
3. Water‑Resource Indicators
Freshwater availability and quality are critical for ecosystems and human societies. Principal indicators are:
- Freshwater Withdrawal vs. Renewable Supply: Expressed as a percentage, highlighting stress on rivers, aquifers, and lakes.
- River Discharge Trends: Changes in flow rates can signal upstream damming or climate‑driven hydrological shifts.
- Water Quality Index (WQI): Composite score based on parameters such as pH, dissolved oxygen, and contaminant concentrations.
4. Land‑Use and Soil Indicators
Land transformation influences carbon storage, biodiversity, and food security. Important metrics include:
- Deforestation Rate: Area of forest loss per year, usually expressed in square kilometres.
- Soil Organic Carbon (SOC): Amount of carbon stored in soil, a key component of the global carbon cycle.
- Urban Expansion Index: Ratio of built‑up area to total land area, reflecting habitat fragmentation.
5. Biodiversity Indicators
These metrics gauge the variety of life on Earth and the resilience of ecosystems:
- Species Richness: Count of distinct species within a defined region.
- Red List Index: Tracks the proportion of species moving toward higher extinction risk.
- Genetic Diversity Measures: Assess variation within populations, often using DNA barcoding.
6. Ocean‑Health Indicators
Oceans regulate climate, provide food, and host immense biodiversity. Core indicators are:
- Ocean Acidification (pH): Declining pH values indicate increased CO₂ absorption, affecting calcifying organisms.
- Sea‑Surface Temperature Anomalies: Deviations from long‑term averages, linked to coral bleaching and fisheries shifts.
- Plastic Pollution Load: Estimated tonnes of macro‑ and micro‑plastics in surface waters.
How Indicators Are Measured and Reported
Reliable measurement hinges on standardized methodologies, extensive monitoring networks, and transparent reporting frameworks.
Data Collection Techniques
- Satellite Remote Sensing: Provides global coverage for temperature, sea‑level, vegetation, and atmospheric gases.
- Ground‑Based Stations: Weather stations, air‑quality monitors, and river gauges deliver high‑frequency local data.
- Field Surveys: Researchers conduct biodiversity inventories, soil sampling, and water testing to capture on‑the‑ground conditions.
- Citizen Science: Public contributions through apps (e.g., iNaturalist) augment professional datasets, especially for species observations.
International Reporting Frameworks
Key platforms compile and disseminate indicator data:
- UN Sustainable Development Goals (SDGs): Indicators such as SDG 13.1 (climate action) and SDG 15.1 (life on land) guide national reporting.
- Intergovernmental Panel on Climate Change (IPCC): Provides assessment reports that synthesize climate indicators for policymakers.
- Global Environment Monitoring System (GEMS): Offers an integrated view of air, water, and land indicators.
Data are typically released annually, with interim updates for fast‑changing metrics like extreme weather events.
Interpreting Indicator Trends
Reading the State of Earth requires more than noting a single number; analysts examine patterns, thresholds, and interconnections.
Trend Analysis
Statistical techniques—such as linear regression, moving averages, and anomaly detection—help distinguish genuine shifts from natural variability. For example, a consistent upward trend in global temperature over three decades signals a climate warming signal that exceeds expected year‑to‑year fluctuations.
Thresholds and Tipping Points
Many indicators have scientifically defined thresholds. Crossing a 1.5 °C temperature rise above pre‑industrial levels, for instance, is associated with heightened risk of irreversible ecosystem damage. Recognizing when an indicator approaches a tipping point enables proactive mitigation.
Cross‑Indicator Correlations
Environmental systems are linked: rising sea temperatures accelerate coral bleaching, which in turn reduces biodiversity and undermines fisheries. Integrated assessment models combine multiple indicators to capture these feedback loops.
Benefits and Limitations of Current Indicator Systems
Indicators are powerful tools, yet they are not without challenges.
Benefits
- Objectivity: Quantitative data reduce reliance on anecdotal evidence.
- Comparability: Standardized metrics allow cross‑regional and temporal comparisons.
- Policy Alignment: Indicators map directly onto international agreements, facilitating compliance tracking.
Limitations
- Data Gaps: Remote regions, especially in the Global South, often lack sufficient monitoring infrastructure.
- Scale Mismatch: Some indicators are measured at global scales, obscuring local nuances.
- Uncertainty: Measurement errors, model assumptions, and natural variability introduce confidence intervals that must be communicated clearly.
- Indicator Overload: Too many metrics can overwhelm decision‑makers, leading to analysis paralysis.
Addressing these limitations involves expanding observation networks, improving data sharing, and developing composite indices that synthesize multiple signals.
Common Misconceptions About Earth Indicators
Misunderstandings can dilute the impact of indicator data.
- “One metric tells the whole story.” In reality, a single indicator—like temperature—captures only part of the planetary picture.
- “Indicators are static numbers.” Indicators evolve; for example, the Red List Index is updated annually to reflect new extinction risk assessments.
- “If an indicator improves, the environment is safe.” Positive trends in one domain (e.g., reduced air‑pollution in a city) may coexist with worsening conditions elsewhere (e.g., rising methane emissions).
- “All countries report data equally.” Reporting capacity varies, leading to uneven data quality across regions.
Clarifying these points helps maintain public trust and ensures that actions are based on a balanced interpretation of the evidence.
Tools and Resources for Tracking the State of Earth
Several reputable platforms allow anyone to explore up‑to‑date indicator data.
- NASA Earth Data: Satellite‑derived visualizations of temperature, vegetation, and sea‑level trends.
- World Bank Climate Data API: Free access to historical climate variables and future projections.
- UNEP Global Environmental Outlook (GEO): Comprehensive reports and downloadable datasets on multiple indicators.
- Global Biodiversity Information Facility (GBIF): Open repository for species occurrence records worldwide.
- European Space Agency Copernicus: Real‑time air‑quality and land‑cover monitoring for Europe and beyond.
These tools often provide interactive dashboards, allowing users to filter by region, time span, or indicator type, making complex data more accessible.
What You Can Do: From Awareness to Action
Understanding the State of Earth empowers individuals and communities to act effectively.
- Stay Informed: Follow reputable indicator dashboards and subscribe to updates from agencies like NOAA or the IPCC.
- Reduce Personal Footprint: Simple steps—energy efficiency, low‑carbon transportation, and waste reduction—contribute to better indicator outcomes.
- Advocate for Better Data: Support policies that fund monitoring infrastructure, especially in under‑served regions.
- Participate in Citizen Science: Contribute observations to platforms such as iNaturalist or local air‑quality networks.
- Engage in Policy Dialogues: Use indicator data to hold elected officials accountable for climate and biodiversity commitments.
Collective action, grounded in reliable data, can shift indicator trajectories toward a healthier planet.
Conclusion
The State of Earth: Key Environmental Indicators Explained provides a vital lens through which we can assess planetary health. By monitoring climate, air, water, land, biodiversity, and ocean metrics, we gain actionable insight into the challenges and opportunities facing humanity. While data gaps and uncertainties remain, the continued refinement of indicator systems and the growing accessibility of open‑source tools ensure that informed decisions become the norm rather than the exception. Understanding these indicators equips every reader to participate meaningfully in the global effort to safeguard our shared home.
Frequently Asked Questions
What are the main categories of environmental indicators used to assess the state of Earth?
The primary categories include climate indicators (temperature, greenhouse gases), air quality (particulate matter, ozone), water resources (freshwater availability, quality), land use (deforestation, soil health), biodiversity (species richness, extinction rates), and ocean health (acidification, sea level).
Why is tracking the state of Earth important for policymakers and citizens?
Indicator data provide a factual basis for climate policies, resource management, and public awareness. They help identify trends, prioritize actions, and evaluate the effectiveness of mitigation and adaptation strategies.
How are greenhouse gas emissions measured and reported globally?
Emissions are calculated using national inventories that follow the Intergovernmental Panel on Climate Change (IPCC) guidelines, combining energy use data, industrial activity, land‑use change, and satellite observations to produce annual totals.
What are common misconceptions about biodiversity loss indicators?
A frequent misconception is that a single species count reflects overall health. In reality, biodiversity indicators consider species richness, genetic diversity, ecosystem function, and trends across multiple taxa to give a fuller picture.
Where can individuals access reliable Earth indicator data for personal research?
Trusted sources include the UN Global Environment Outlook, NASA’s Earth Observing System, the World Bank’s Climate Data API, and open‑source platforms like the Global Biodiversity Information Facility (GBIF).





Leave a Comment