
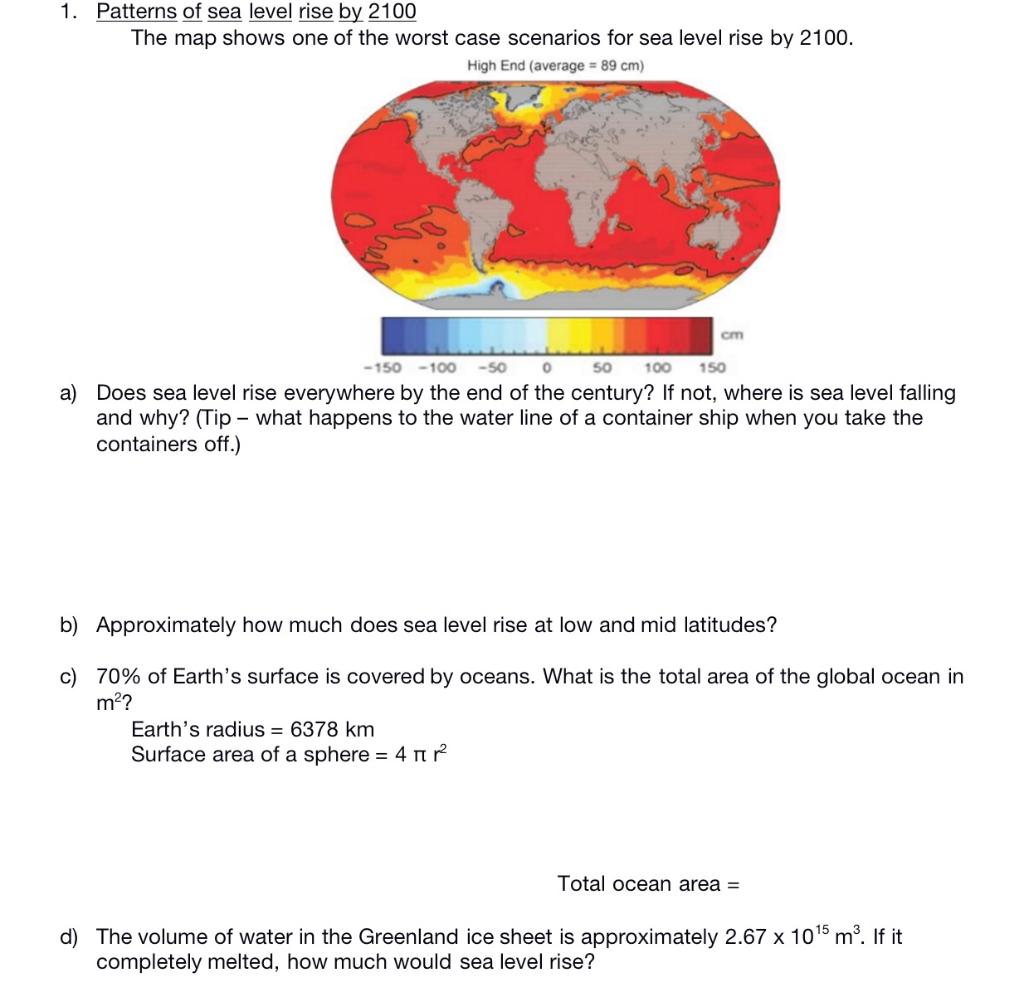
Sea‑level rise by 2100 could range from a few decimetres under aggressive mitigation to over two metres if emissions continue unchecked, shaping coastal ecosystems, economies, and societies.
Quick Answer
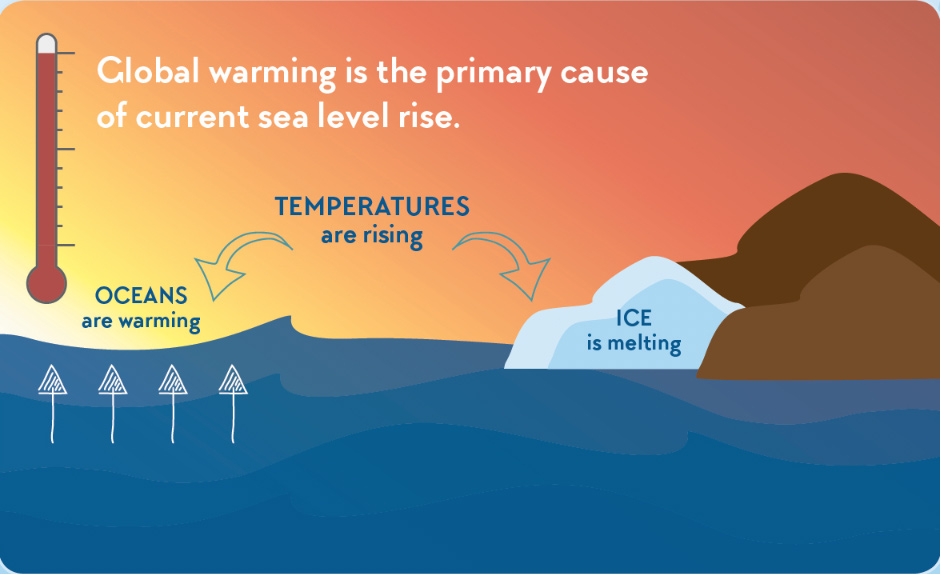
Sea‑level rise (SLR) refers to the increase in the average height of the world’s oceans relative to land. The rise is driven mainly by thermal expansion of warming seawater and the addition of meltwater from glaciers, the Greenland Ice Sheet, and the Antarctic Ice Sheet. The Intergovernmental Panel on Climate Change (IPCC) Sixth Assessment Report (2021) projects a likely range of 0.3–0.6 m (1–2 ft) under stringent mitigation pathways (SSP1‑1.9) and up to 2.5 m (8 ft) or more under high‑emissions scenarios (SSP5‑8.5) by the end of the century. While the exact height remains uncertain, the consensus is that higher emissions will produce substantially larger rises, increasing flood risk, salt‑water intrusion, and displacement of coastal populations.
Key Takeaways
- Thermal expansion and ice‑sheet melt together drive most of the projected sea‑level rise.
- Best‑case (strong mitigation) scenarios estimate 0.3–0.6 m rise by 2100; worst‑case (high emissions) scenarios estimate 2–2.5 m or more.
- Regional factors such as land subsidence, ocean currents, and local uplift can cause deviations of ±0.5 m from the global mean.
- Impacts include heightened coastal flooding, loss of wetlands, infrastructure damage, and large‑scale human displacement.
- Adaptation (e.g., managed retreat, flood barriers) and mitigation (rapid decarbonisation) are both essential; each has limits and trade‑offs.
What Is How High Could Sea Levels Rise by 2100? Best- and Worst-Case Scenarios?
The question asks for a quantitative range of future ocean height under different climate pathways. It is distinct from short‑term sea‑level variability (e.g., tides) and from geological sea‑level change over millennia. The focus is on the anthropogenic contribution to global mean sea level (GMSL) between the present baseline (1995–2014) and the year 2100, expressed in metres or feet.
How Does It Work?
Thermal Expansion
When seawater warms, its volume increases—much like a heated metal rod expands. The IPCC attributes roughly 30–50 % of projected 21st‑century SLR to this process, especially in the upper 700 m of the ocean where heat uptake is greatest.
Ice‑Sheet and Glacier Melt
Glaciers worldwide have been losing mass at an accelerating rate. The Greenland Ice Sheet currently contributes about 0.7 mm yr⁻¹ to GMSL, while the West Antarctic Ice Sheet is a potential source of several metres of rise if a marine‑based instability is triggered.
Feedbacks and Thresholds
Ice‑sheet dynamics involve feedbacks such as surface melt‑induced lubrication of ice flow and ocean‑driven basal melting of marine‑terminating glaciers. Crossing thresholds—like the loss of buttressing ice shelves—could shift the system from a slow response to rapid discharge, amplifying SLR beyond linear projections.
What Does the Evidence Show?
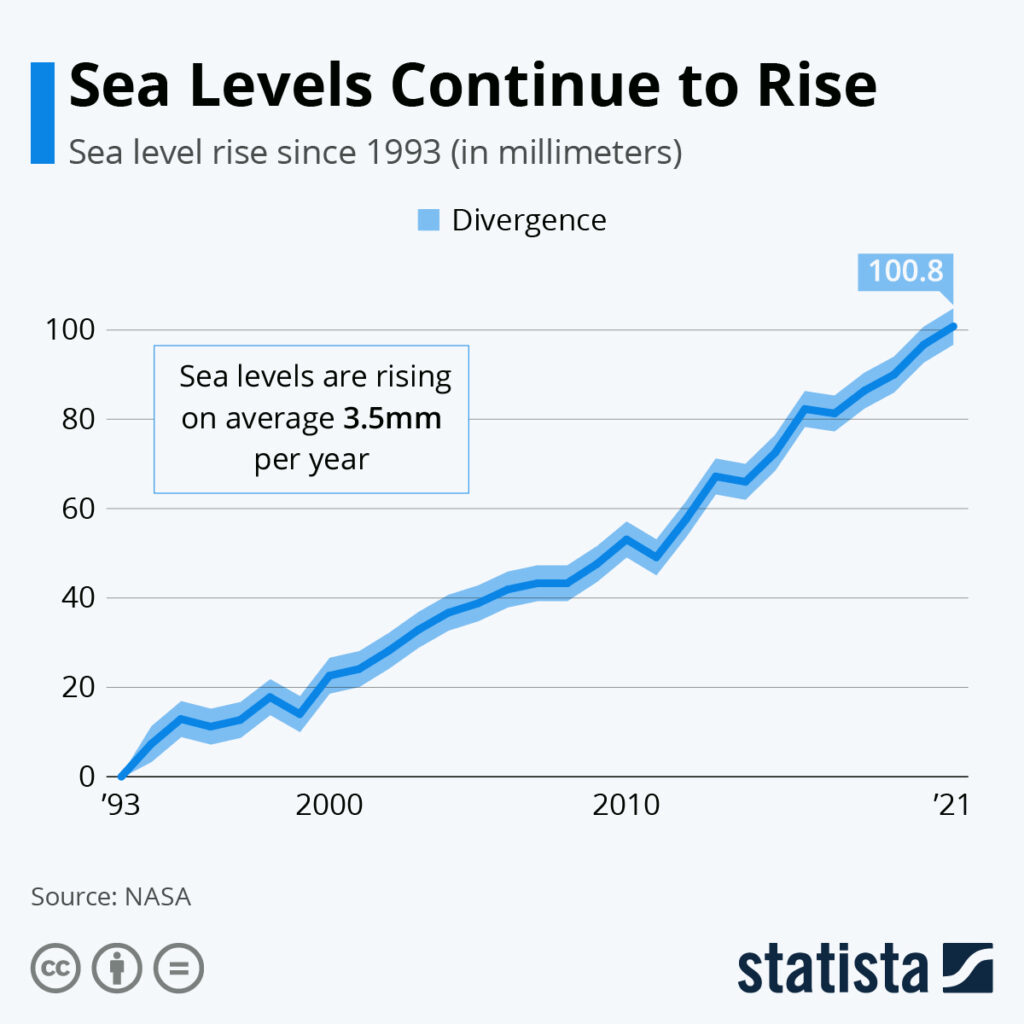
Observations from satellite altimetry (1993‑present) record a global mean rise of about 3.3 mm yr⁻¹, consistent with the combined effects of thermal expansion and meltwater input. Tide‑gauge reconstructions extending back to the 19th century confirm a long‑term acceleration. The IPCC’s probabilistic SLR assessment, which synthesises peer‑reviewed studies, yields a 5‑95 % confidence interval of 0.28–0.98 m for low‑emission pathways and 0.63–2.00 m for high‑emission pathways, not including potential rapid ice‑sheet collapse. Emerging research (e.g., DeConto & Pollard 2021) suggests that if such collapse occurs, additional metres could be added, widening the worst‑case range.
Main Causes or Drivers
Greenhouse‑Gas Emissions
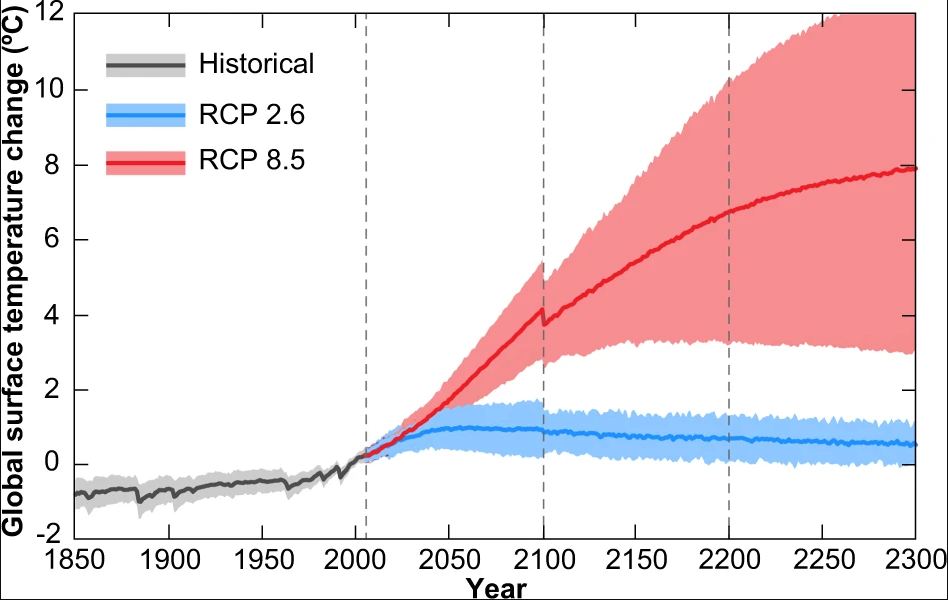
CO₂, methane, and nitrous oxide trap heat, raising global temperatures. The IPCC links a 1 °C increase to roughly 0.2 m of thermal expansion by 2100.
Ocean Warming
Heat absorbed by the ocean is now the dominant energy sink of the climate system, driving expansion and destabilising marine‑terminating glaciers.
Ice‑Sheet Dynamics
Surface melt, basal lubrication, and loss of buttressing ice shelves accelerate ice flow from Greenland and Antarctica, feeding the ocean with fresh water.
Environmental and Human Impacts
Environmental Impacts
Coastal wetlands, which act as carbon sinks and storm buffers, may be submerged or experience salinity stress, reducing biodiversity. Coral reef exposure to deeper, cooler water could be offset by increased sedimentation, harming reef resilience.
Human Health and Social Impacts
Salt‑water intrusion threatens freshwater supplies, raising risks of water‑borne diseases. Displacement of low‑lying communities can create climate‑refugee flows, straining social services and heightening mental‑health stress.
Economic and Infrastructure Impacts
Flood‑prone cities such as New York, Mumbai, and Rotterdam face billions of dollars in adaptation costs. Property loss, insurance premium spikes, and disruptions to ports and supply chains are projected to increase proportionally with SLR magnitude.
Regional Differences
Local sea‑level change can deviate from the global mean due to land subsidence (e.g., the Mekong Delta), glacial isostatic adjustment (e.g., parts of Canada), and ocean‑current shifts (e.g., the Gulf Stream slowdown affecting the U.S. East Coast). Consequently, a 0.5 m global rise could translate to >1 m relative rise in some Asian deltas, while parts of the western Pacific may experience slightly less.
What Scientists Know With High Confidence
- Global mean sea level is rising and the rate has accelerated over the past few decades.
- Thermal expansion and melt from glaciers and the Greenland Ice Sheet are already observable contributors.
- Continued greenhouse‑gas emissions will increase ocean heat content and accelerate ice‑sheet melt.
- Coastal flooding risk grows non‑linearly with sea‑level rise because of compound effects of storm surge and high tides.
What Remains Uncertain
The largest source of uncertainty lies in the potential rapid destabilisation of the West Antarctic Ice Sheet and parts of the East Antarctic interior. Ice‑sheet models differ in how they represent basal lubrication, ice‑shelf buttressing, and ocean‑driven melting, leading to a wide spread in worst‑case projections. Additionally, regional land‑movement data are uneven, making precise local forecasts challenging.
Common Misconceptions
Misconception: Sea‑level rise will be uniform worldwide.
Reality: Local factors such as subsidence, uplift, and ocean‑current changes cause regional variations of up to ±0.5 m around the global mean.
Misconception: Only melting ice sheets matter; thermal expansion is negligible.
Reality: Thermal expansion accounts for roughly a third to half of projected 21st‑century rise, especially in the early decades.
Misconception: A 0.5 m rise is harmless for coastal cities.
Reality: Even modest rises increase the frequency of “nuisance” flooding, strain drainage systems, and raise insurance costs, making adaptation necessary.
Solutions and Limitations
Mitigation
Rapid decarbonisation (e.g., net‑zero targets by 2050) directly limits future heat uptake, reducing both thermal expansion and ice‑sheet melt. However, mitigation alone cannot reverse already committed rise (the so‑called “warming‑in‑the‑pipeline”).
Adaptation
Options include seawalls, surge barriers, elevated building codes, and managed retreat. While engineering solutions can protect specific assets, they are costly, may have ecological side‑effects (e.g., altered sediment transport), and are not feasible everywhere.
Nature‑Based Approaches
Restoring mangroves, salt‑marshes, and oyster reefs provides flood attenuation and carbon sequestration. These habitats can be lost if sea level outpaces sediment supply, so sustained management is required.
Limitations
All strategies involve trade‑offs: high‑cost infrastructure may divert resources from social programs; retreat raises equity concerns; nature‑based solutions need space and may be vulnerable to other stressors like pollution.
What Individuals, Communities, and Governments Can Do
What Individuals Can Do
Support policies that accelerate clean‑energy transitions, reduce personal carbon footprints where possible, and engage in local coastal‑restoration projects. Personal actions alone cannot stop SLR but can build public pressure for systemic change.
What Communities and Organizations Can Do
Develop and implement community‑wide adaptation plans, invest in flood‑resilient infrastructure, and preserve natural buffers. Collaborate with scientists to incorporate up‑to‑date sea‑level projections into zoning and building codes.
What Governments Can Do
Enact ambitious emission‑reduction targets, fund large‑scale renewable‑energy deployment, and allocate resources for coastal risk assessments. Provide financing mechanisms for managed retreat and ensure that vulnerable populations receive equitable support.
Closing Synthesis
Sea‑level rise by 2100 is a projected increase that could span a few decimetres under strong mitigation to several metres under high‑emission pathways. The physics—thermal expansion and ice‑sheet melt—are well‑understood, yet the timing and magnitude of rapid ice‑sheet collapse remain uncertain. Impacts will be uneven, with low‑lying regions and dense coastal cities facing the greatest challenges. High‑confidence findings guide decisive mitigation and adaptation, while ongoing research aims to narrow the biggest uncertainties. Coordinated action across individuals, communities, and governments offers the most robust path to limit future rise and safeguard coastal societies.
Frequently Asked Questions
What is the definition of sea‑level rise?
Sea‑level rise is the increase in the average height of the world’s oceans relative to land, measured against a long‑term baseline, and driven mainly by thermal expansion and meltwater from ice.
Why does sea level rise faster under high‑emission scenarios?
High‑emission scenarios keep greenhouse‑gas concentrations elevated, leading to more ocean warming (thermal expansion) and accelerated melting of glaciers, Greenland, and Antarctic ice sheets, which together add more water to the oceans.
Which regions are most vulnerable to sea‑level rise?
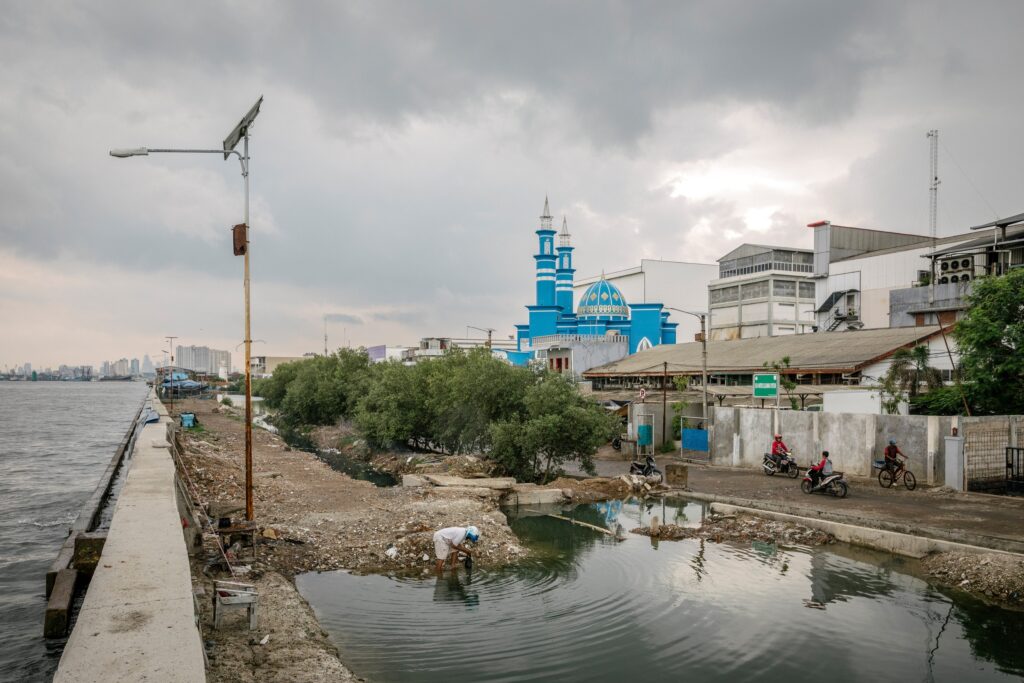
Low‑lying deltas such as the Mekong, Nile, and Ganges‑Brahmaputra, as well as densely populated coastal cities like New York, Mumbai, and Jakarta, are especially vulnerable because even modest rises increase flooding and salt‑water intrusion.
What are the main uncertainties in projecting sea‑level rise by 2100?
The greatest uncertainty stems from the potential rapid destabilisation of the West Antarctic Ice Sheet and parts of East Antarctica, where model differences in ice dynamics lead to a wide spread in worst‑case projections.
How can individuals contribute to limiting sea‑level rise?
Individuals can support strong climate policies, reduce personal carbon footprints, and participate in local coastal restoration projects, helping build public demand for the systemic changes needed to limit future sea‑level rise.





Leave a Comment