
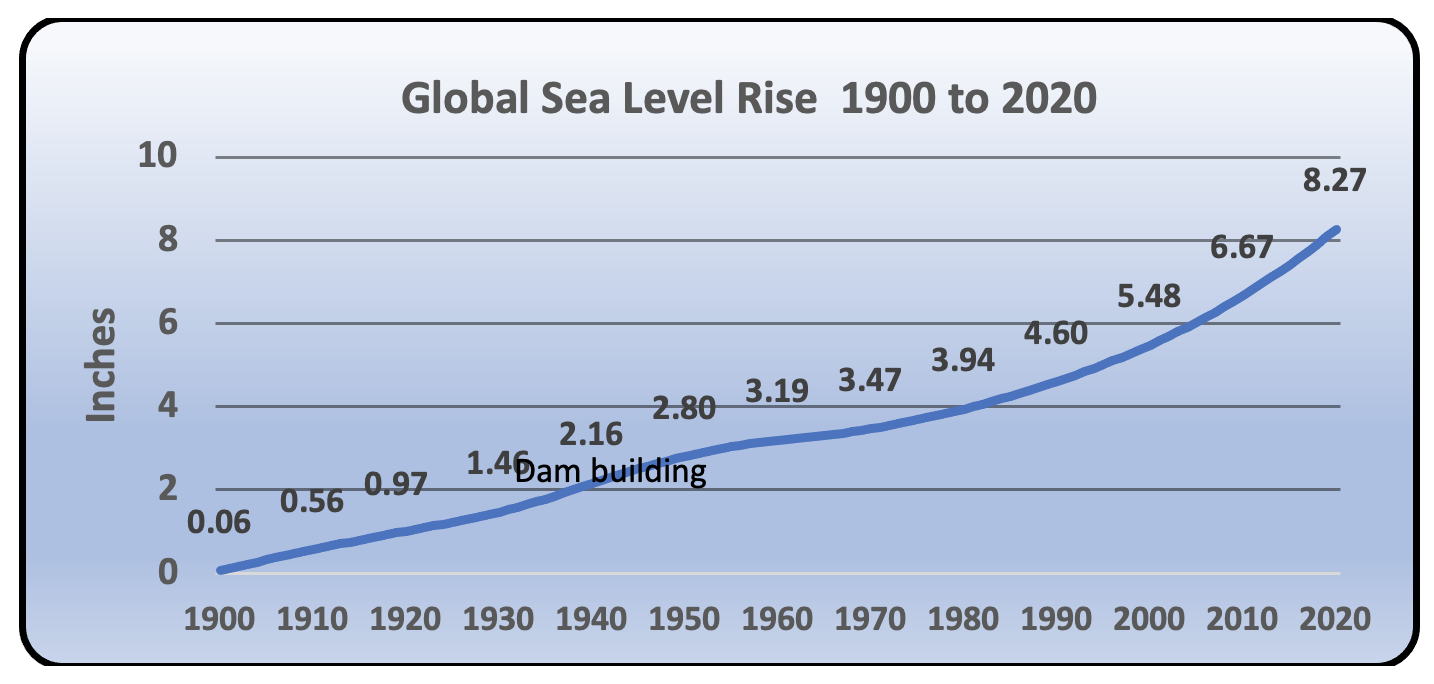
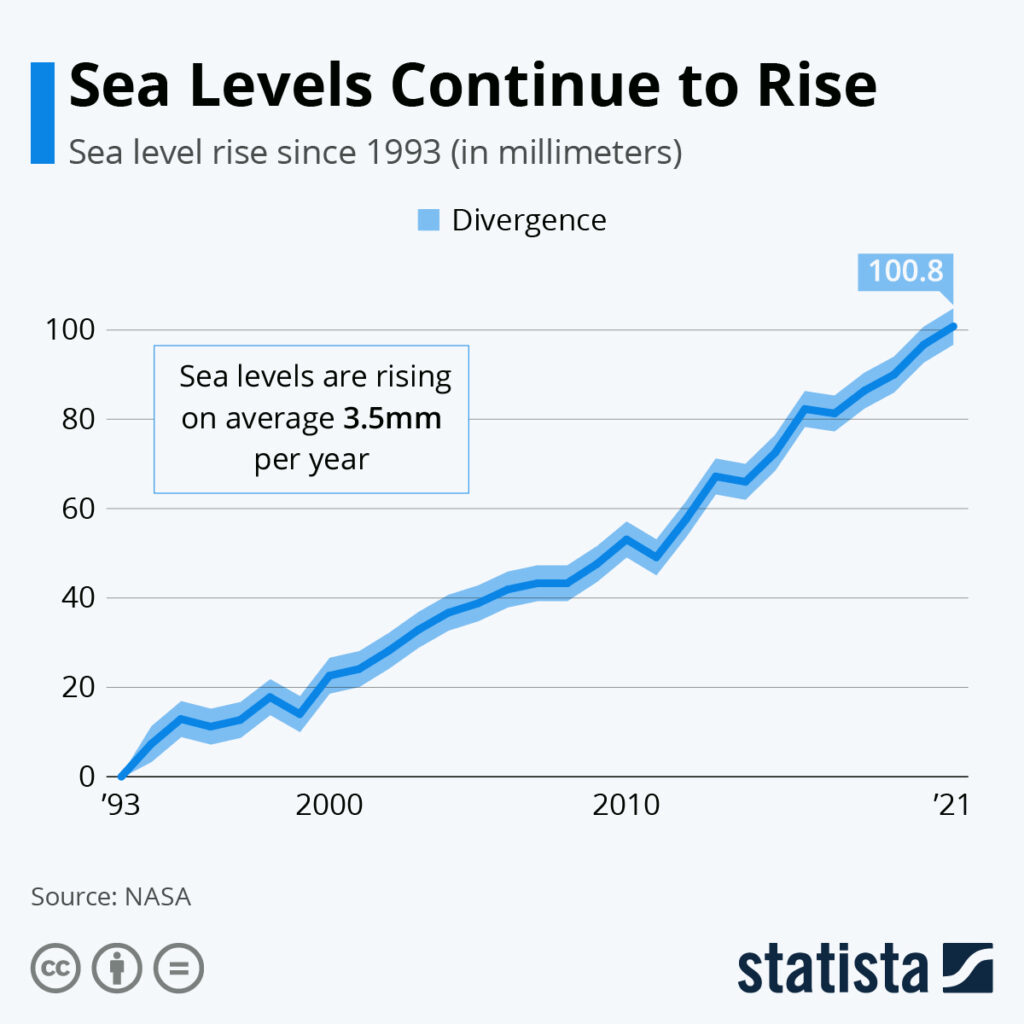
Sea level has risen about 3 mm per year over the past two decades, driven by thermal expansion and ice loss, with measurable impacts on coastlines, ecosystems, and societies worldwide.
\n\n
Quick Answer
\n
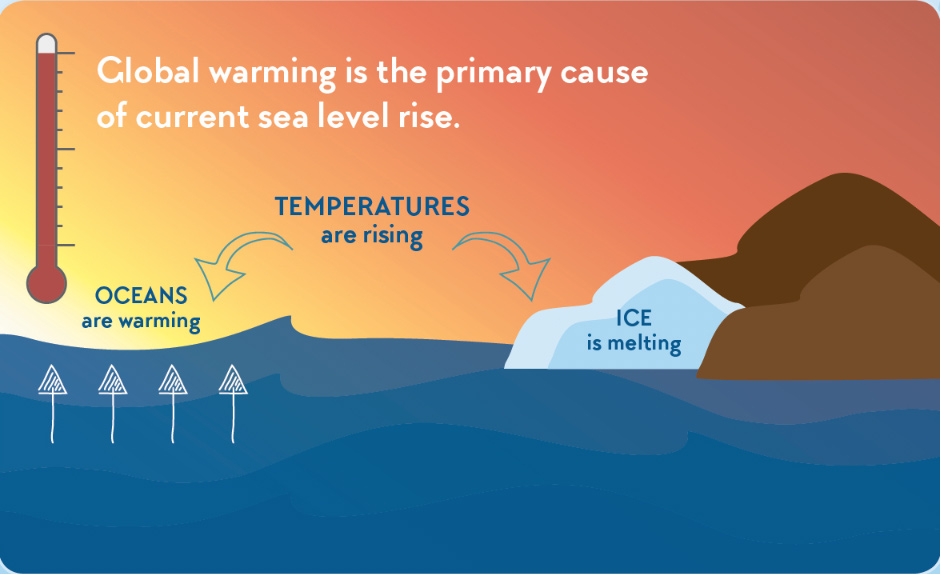
Sea level rise refers to the long‑term increase in the average height of the world’s oceans relative to land. Between 2000 and 2020 global mean sea level rose at an average rate of roughly 3 mm per year, a rate confirmed by satellite altimetry (NASA, NOAA) and tide‑gauge networks. The primary mechanisms are thermal expansion of warming seawater and the addition of meltwater from glaciers, the Greenland Ice Sheet, and the Antarctic Ice Sheet. Consequences include more frequent coastal flooding, saltwater intrusion, and heightened vulnerability of low‑lying cities. While the upward trend is robust, exact future rates depend on greenhouse‑gas emissions, ice‑sheet dynamics, and regional land movements, which introduce moderate uncertainty.
\n
\n\n
Key Takeaways
\n
- \n
- Global mean sea level rose about 3 mm per year from 2000‑2020, a rate faster than the 20th‑century average.
- Thermal expansion and melting of glaciers and polar ice sheets together account for roughly 80 % of the observed rise.
- Coastal regions experience amplified impacts because sea‑level rise combines with tides, storms, and land subsidence.
- High‑confidence findings show the trend will continue, but the magnitude by 2100 varies widely across emissions scenarios.
- Adaptation measures such as nature‑based defenses and upgraded infrastructure can reduce risk, though they require substantial investment and careful planning.
\n
\n
\n
\n
\n
\n
\n\n
What Is Sea Level Rise in the Last 20 Years: What the Data Shows?
\n
Sea level rise is the persistent increase in the average height of the ocean’s surface relative to a fixed land datum. The “last 20 years” refers to the period from 2000 through 2020, for which the most reliable satellite and tide‑gauge records exist. This metric differs from short‑term fluctuations caused by tides, storms, or El Niño events; it captures a climate‑scale signal that persists over decades. Understanding this trend matters because even modest rises can reshape coastlines, alter habitats, and affect billions of people who live near the sea.
\n\n
How Does It Work?
\n
1. Thermal Expansion of Ocean Water
\n
When seawater warms, its molecules move farther apart, causing the water column to expand. The Intergovernmental Panel on Climate Change (IPCC) attributes roughly 30‑40 % of the 2000‑2020 sea‑level increase to this process, which is directly linked to rising atmospheric temperatures.
\n
2. Melting of Glaciers and Ice Sheets
\n
Glaciers worldwide have been losing mass at accelerating rates. The Greenland Ice Sheet contributed about 0.7 mm yr⁻¹ and the Antarctic Ice Sheet about 0.4 mm yr⁻¹ during the same period, according to the IPCC Sixth Assessment Report (2021). Meltwater adds directly to ocean volume.
\n
3. Changes in Land Water Storage
\n
Human activities such as groundwater extraction and reservoir construction shift water between land and ocean. While these effects are smaller than thermal expansion and ice melt, they can locally add up to 0.1‑0.2 mm yr⁻¹.
\n
4. Vertical Land Motion
\n
Land can rise (isostatic rebound) or sink (subsidence) due to tectonics, sediment compaction, or groundwater withdrawal. These movements alter relative sea level and are accounted for in regional analyses.
\n\n
What Does the Evidence Show?
\n
Multiple, independent lines of evidence converge on the same conclusion: sea level has risen steadily over the past two decades.
\n
- \n
- Satellite Altimetry: Since 1993, satellite missions such as TOPEX/Poseidon, Jason‑1/2/3 have measured global sea‑surface height with centimeter‑scale precision, revealing a 3.3 mm yr⁻¹ increase from 2000‑2020 (NASA, NOAA).
- Tide‑Gauge Networks: The Permanent Service for Mean Sea Level (PSMSL) reports a consistent rise of 2.9 mm yr⁻¹ across well‑distributed coastal stations for the same period.
- Gravity‑Satellite Data: The GRACE mission (2002‑2017) detected mass loss from Greenland and Antarctica that matches sea‑level contributions derived from altimetry.
- Ice‑Core and Geological Records: Reconstructions of past sea‑level changes show that the current rate exceeds natural variability over the last several thousand years.
\n
\n
\n
\n
\n
Collectively, these observations provide strong (high‑confidence) evidence that the observed rise is real, global, and primarily driven by anthropogenic warming.
\n\n
Main Causes or Drivers
\n
Direct Causes
\n
Thermal expansion and meltwater input are the immediate sources of added ocean volume.
\n
Underlying Drivers
\n
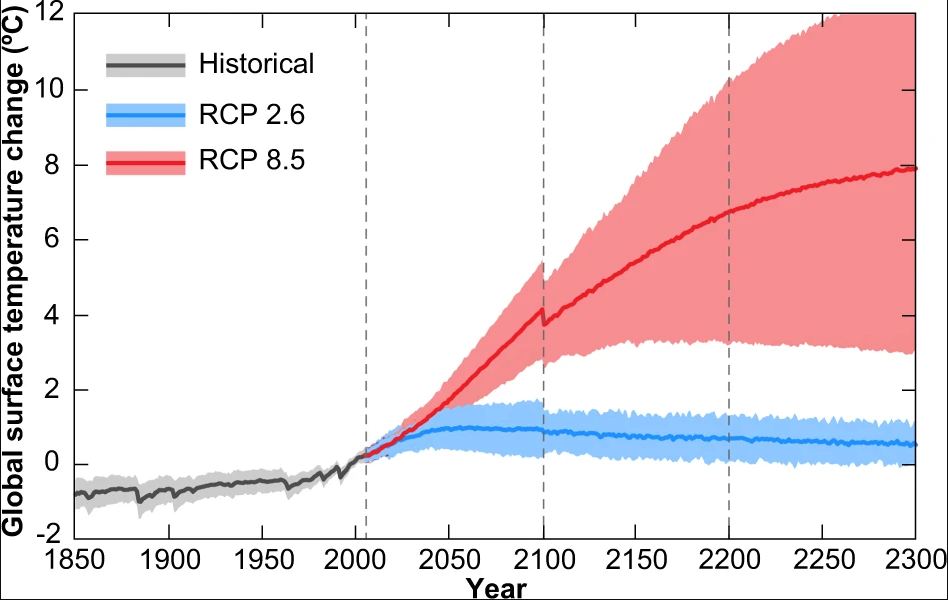
The underlying driver is the increase in greenhouse‑gas concentrations, which raises global mean temperature. Climate‑model attribution studies consistently link the observed thermal expansion and ice‑sheet mass loss to human‑induced warming.
\n
Amplifying Factors
\n
Regional land subsidence, loss of coastal wetlands, and changes in ocean currents can amplify local sea‑level rise, making some areas experience rates higher than the global mean.
\n\n
Environmental and Human Impacts
\n
Environmental Impacts
\n
Rising seas inundate coastal wetlands, erode shorelines, and shift the distribution of mangroves and salt‑marsh habitats. Coral reefs face increased stress from higher water depth and temperature, which can reduce light availability for photosynthesis.
\n
Human Health and Social Impacts
\n
More frequent “nuisance” flooding contaminates drinking water supplies and creates breeding grounds for disease‑carrying mosquitoes. Displacement of residents—often termed “climate‑forced migration”—has already begun in low‑lying island nations and delta regions.
\n
Economic and Infrastructure Impacts
\n
Coastal property values decline as flood risk rises. Municipalities spend billions on flood defenses, storm‑water upgrades, and emergency response. Sectors such as tourism, fisheries, and agriculture can lose revenue when habitats are lost or salinized.
\n\n
Regional Differences
\n
Sea‑level rise is not uniform. Satellite data show that the western Pacific and Indian Ocean experience rates up to 5 mm yr⁻¹, partly because of ocean‑dynamic effects. In contrast, parts of the North Atlantic show rates closer to 2 mm yr⁻¹, where land uplift partially offsets ocean rise. Specific examples include:
\n
- \n
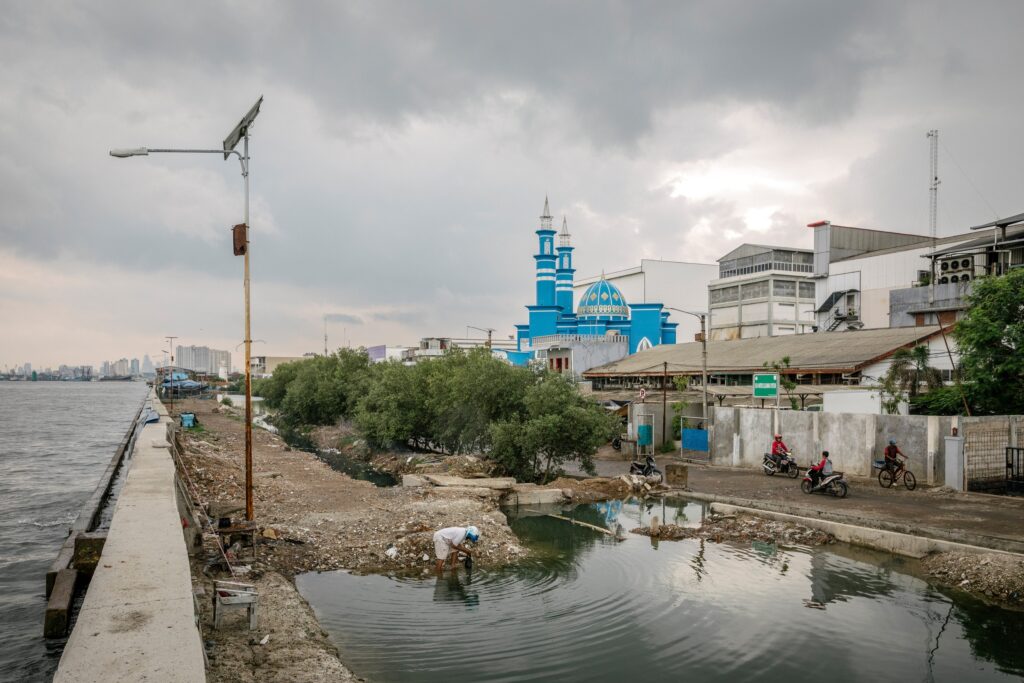
- Southeast Asia: The Mekong Delta faces combined sea‑level rise and land subsidence of up to 10 mm yr⁻¹, threatening rice production.
- United States Gulf Coast: Cities such as New Orleans experience relative sea‑level rise of 4‑5 mm yr⁻¹ due to subsidence.
- Pacific Island Nations: Small island states like Kiribati see sea‑level rise that exceeds the global mean, raising existential concerns.
\n
\n
\n
\n\n
What Scientists Know With High Confidence
\n
- \n
- Global mean sea level has risen by about 3 mm per year from 2000‑2020.
- Thermal expansion and melt from glaciers, Greenland, and Antarctica together explain the majority of the observed rise.
- Human‑induced greenhouse‑gas emissions are the primary driver of the warming that underlies sea‑level rise.
- Coastal flooding frequency has increased in many regions as sea‑level rise combines with tides, storms, and subsidence.
\n
\n
\n
\n
\n
\n\n
What Remains Uncertain
\n
Key uncertainties revolve around the future behavior of the Antarctic Ice Sheet, especially the West Antarctic sector, where ice‑sheet dynamics are complex and modelled responses vary widely. Additionally, regional land‑motion data are sparse in many developing‑country coastlines, limiting precise local projections. Finally, the socioeconomic pathways that determine future greenhouse‑gas emissions introduce a broad range of possible sea‑level outcomes for the end of the 21st century.
\n
\n\n
Common Misconceptions
\n
Misconception: Sea level rise is caused only by melting ice.
\n
Reality: While ice melt is a major contributor, thermal expansion of warming seawater accounts for roughly one‑third of the observed increase.
\n
Misconception: A few millimeters per year is too small to matter.
\n
Reality: Even a 3 mm yr⁻¹ rise compounds over decades, leading to several centimeters of additional water that can turn ordinary high tides into flooding events in vulnerable areas.
\n
Misconception: Sea‑level rise will stop if emissions are reduced.
\n
Reality: Because oceans have large heat capacity, sea level will continue to rise for decades to centuries after emissions peak, though the rate can be slowed.
\n
\n\n
Solutions and Limitations
\n
Responses fall into three broad categories: mitigation, adaptation, and restoration.
\n
- \n
- Mitigation: Reducing CO₂ emissions limits future warming and therefore slows thermal expansion and ice melt. The limitation is that mitigation alone cannot reverse the rise already locked in.
- Adaptation: Building seawalls, elevating infrastructure, and improving drainage can protect communities. These measures are costly, may have environmental side effects, and can create a false sense of security if sea level accelerates faster than anticipated.
- Nature‑Based Solutions: Restoring mangroves, wetlands, and coral reefs provides wave attenuation and sediment trapping. While beneficial for biodiversity, such approaches cannot fully replace hard engineering in high‑risk urban settings.
\n
\n
\n
\n\n
What Individuals, Communities, and Governments Can Do
\n
What Individuals Can Do
\n
Support policies that reduce carbon emissions, choose low‑carbon transportation, and participate in local coastal‑restoration projects. Personal actions alone cannot stop sea‑level rise but contribute to the broader mitigation effort.
\n
What Communities and Organizations Can Do
\n
Develop and implement coastal‑risk assessments, invest in green infrastructure, and adopt zoning that discourages new development in high‑risk flood zones.
\n
What Governments Can Do
\n
Set ambitious national emissions targets, fund large‑scale adaptation programs, and integrate sea‑level projections into urban planning, disaster response, and infrastructure budgeting. International cooperation is essential for sharing data, technology, and financing.
\n\n
Closing Synthesis
\n
Sea level has risen steadily over the last two decades, driven by well‑understood physical processes linked to human‑induced warming. High‑confidence evidence confirms the trend, while uncertainties remain about the pace of Antarctic ice loss and regional land movements. Impacts are already evident in many coastal zones, and future risks will grow unless emissions are curbed and adaptation measures are deployed. By combining mitigation, resilient infrastructure, and nature‑based solutions, societies can manage the rising tide while buying time for longer‑term climate action.
Frequently Asked Questions
What was the average global sea‑level rise rate between 2000 and 2020?
The average global mean sea level rose about 3 mm per year between 2000 and 2020, as measured by satellite altimetry and tide‑gauge networks.
What are the two main physical processes that cause sea‑level rise?
The two primary processes are thermal expansion of warming seawater and the addition of meltwater from glaciers, the Greenland Ice Sheet, and the Antarctic Ice Sheet.
How does sea‑level rise impact coastal communities?
It increases the frequency and severity of coastal flooding, leads to saltwater intrusion into freshwater supplies, threatens infrastructure, and can displace residents, especially in low‑lying cities and island nations.
Which region is experiencing the fastest relative sea‑level rise and why?
Parts of the western Pacific and Indian Ocean show the fastest relative rise, up to 5 mm yr⁻¹, due to a combination of ocean‑dynamic effects and local land subsidence.
What are effective adaptation strategies for sea‑level rise?
Effective strategies include building and upgrading seawalls and drainage systems, restoring mangroves and wetlands for natural protection, elevating critical infrastructure, and implementing land‑use planning that avoids high‑risk zones.





Leave a Comment