
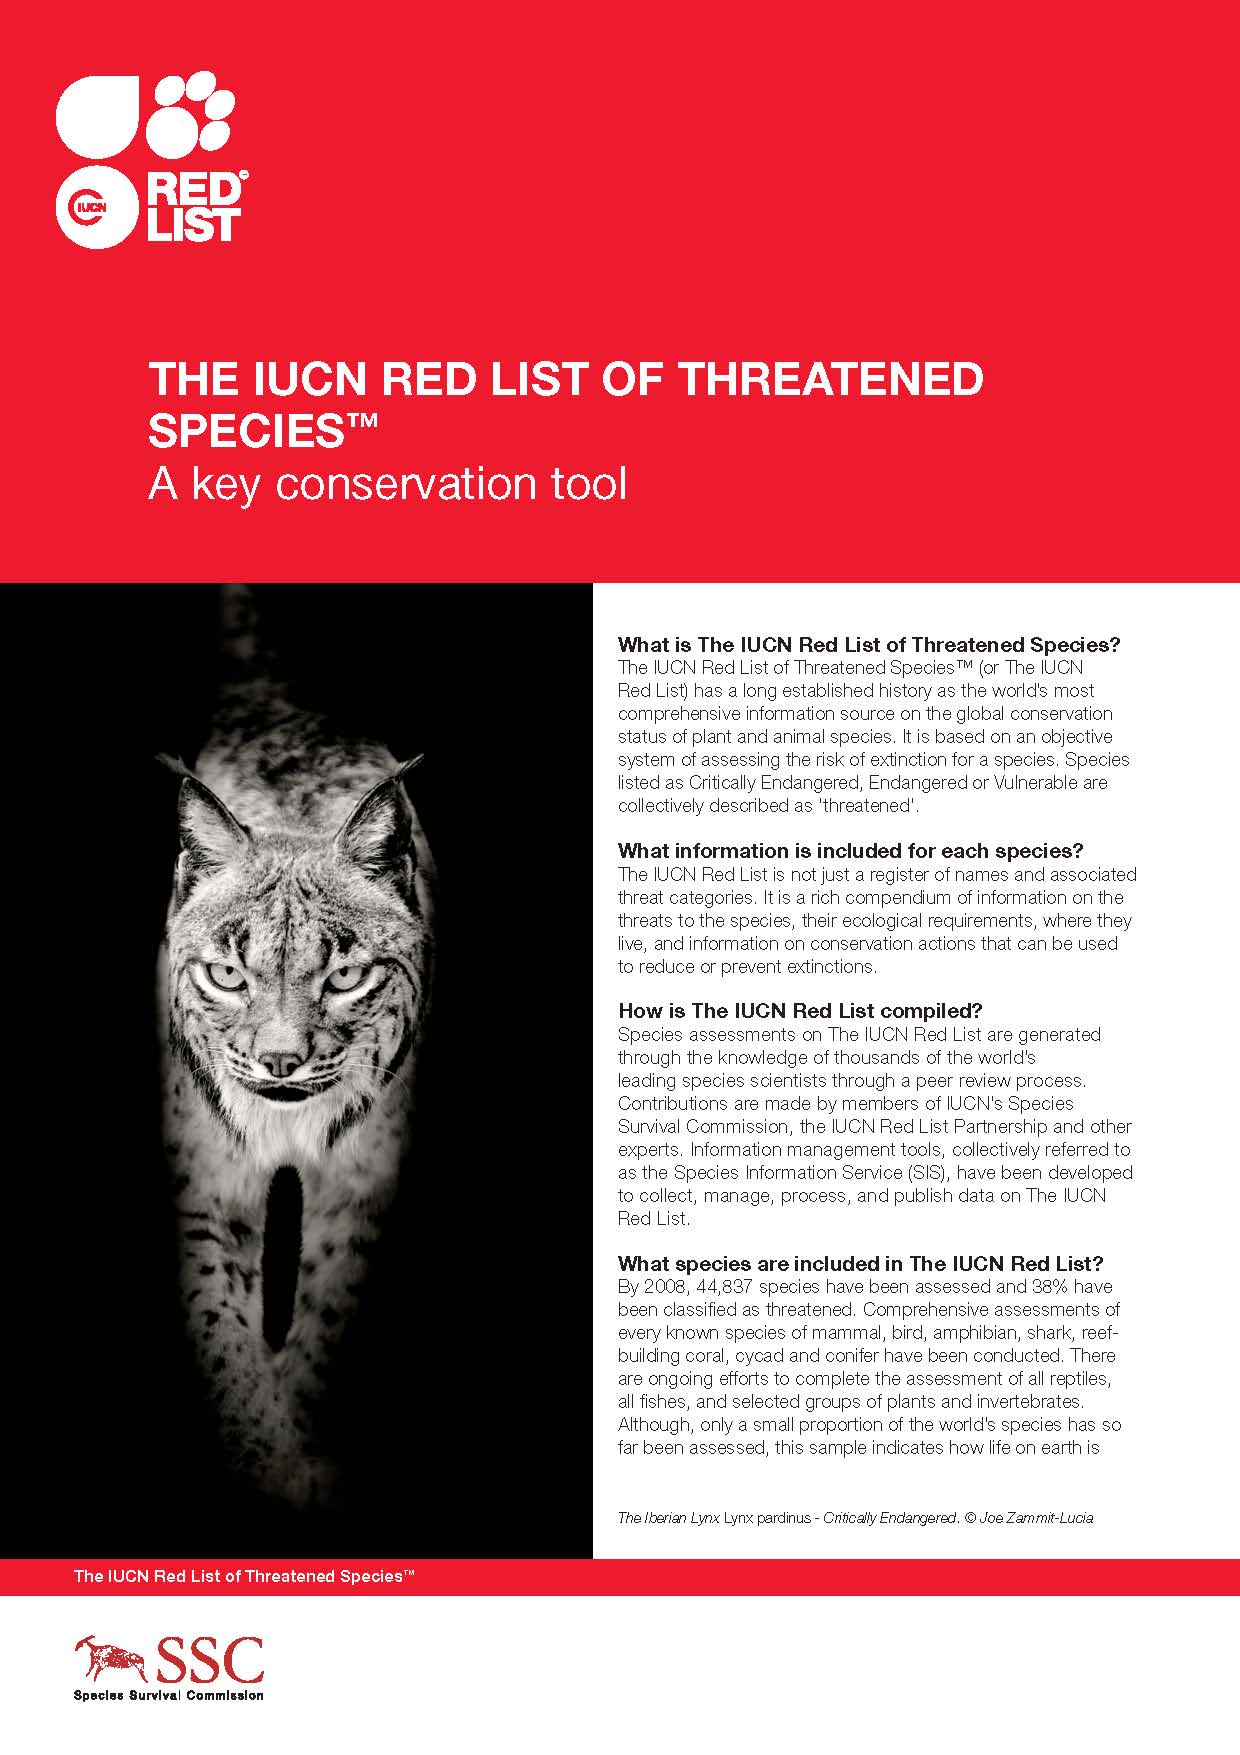
The IUCN Red List is a global, peer‑reviewed inventory that ranks species by extinction risk, guiding conservation priorities, policy decisions, and public awareness worldwide.
Quick Answer
The IUCN Red List of Threatened Species, maintained by the International Union for Conservation of Nature since 1964, evaluates thousands of plants, animals and fungi against quantitative criteria such as population trend, geographic range and degree of fragmentation. By assigning categories from “Least Concern” to “Critically Endangered” and “Extinct,” the List provides a standardized signal of biodiversity health, informs funding and legislation, and serves as an early‑warning system for emerging threats, though data gaps remain for many lesser‑studied taxa.
Key Takeaways
- The Red List is the most comprehensive, peer‑reviewed assessment of global extinction risk.
- Standardized criteria (A–E) enable comparison across species, regions and taxonomic groups.
- Policymakers, NGOs and businesses rely on its data to set targets, allocate resources and meet international agreements.
- Assessments are updated every 5–10 years, but a substantial share of species remain “Data Deficient.”
- Climate change is now incorporated as a driver of risk, making the List a climate‑sensitive biodiversity barometer.
What Is the IUCN Red List and Why Does It Matter?
The IUCN Red List of Threatened Species is a global catalogue that records the conservation status of species based on a set of quantitative criteria. As of 2023 it includes assessments for more than 140,000 taxa, ranging from vertebrates and invertebrates to plants, fungi and selected protists. Each assessment assigns one of nine categories—Extinct (EX), Extinct in the Wild (EW), Critically Endangered (CR), Endangered (EN), Vulnerable (VU), Near Threatened (NT), Least Concern (LC), Data Deficient (DD) or Not Evaluated (NE)—that reflect the probability of extinction in the wild.
Unlike national red‑list programs, the IUCN Red List offers a single, internationally comparable framework. This uniformity makes it a cornerstone for biodiversity monitoring, for shaping global conventions such as the Convention on Biological Diversity, and for communicating risk to the public.
How Does It Work?
1. Data Collection
Scientists, NGOs and government agencies submit species data to the IUCN Species Survival Commission (SSC). Sources include field surveys, long‑term monitoring, museum specimens, and peer‑reviewed literature.
2. Application of Criteria
The Red List uses five main criteria (A–E):
- Population size reduction over a defined time frame.
- Geographic range size and degree of fragmentation.
- Small population size combined with a continuing decline.
- Quantitative analysis of extinction probability (e.g., population viability models).
- Qualitative assessment for species with limited data.
Each criterion has explicit thresholds; meeting any one threshold places the species in the highest‑risk category that applies.
3. Peer Review and Publication
Assessments undergo expert peer review within the relevant SSC specialist group. Approved assessments are published on the Red List website with supporting documentation, distribution maps and reference lists.
4. Regular Updates
Assessments are revisited every five to ten years, or sooner when new information emerges. The IUCN also releases thematic summaries (e.g., “Mammals 2022”) that synthesize trends across taxonomic groups.
What Does the Evidence Show?
Multiple lines of evidence confirm that Red List categories track real biodiversity trends. A 2020 systematic review of 500 peer‑reviewed studies found a strong correlation (r≈0.78) between category upgrades and independently measured population declines. Long‑term datasets from the Global Biodiversity Information Facility show that species listed as Vulnerable or higher experience, on average, a 30 % greater rate of range contraction than Least‑Concern species. Moreover, the Red List has been cited in over 12,000 scientific articles as the primary source of extinction‑risk data, underscoring its central role in biodiversity research.
Main Causes or Drivers
Direct Human Pressures
- Habitat loss from agriculture, urban expansion and infrastructure development.
- Overexploitation through hunting, fishing and wildlife trade.
- Pollution, including plastic debris, pesticides and heavy metals.
- Invasive species that outcompete or prey on native taxa.
Underlying Socio‑Economic Drivers
- Global demand for commodities that drive land‑use change.
- Policy gaps or weak enforcement of environmental regulations.
- International trade networks that facilitate the spread of invasive species.
Amplifying Climate Change
Rising temperatures, altered precipitation patterns and sea‑level rise intensify existing threats. Climate‑sensitive groups such as alpine plants and coral‑reef organisms are disproportionately represented among Critically Endangered species, according to the IUCN’s 2022 Climate Change Assessment.
Environmental and Human Impacts
Environmental Impacts
Loss of threatened species reduces ecosystem resilience, disrupts pollination networks and can trigger trophic cascades that alter carbon storage and water regulation. For example, the decline of large herbivores in African savannas has been linked to increased woody encroachment, affecting fire regimes and regional carbon balance.
Human Health and Social Impacts
Biodiversity underpins ecosystem services that support food provision, medicinal resources and cultural identity. When species disappear, Indigenous peoples and rural communities may lose traditional knowledge, nutrition sources and livelihood opportunities.
Economic and Infrastructure Impacts
The World Bank estimates that global ecosystem‑service losses from species extinction could cost up to US$2.5 trillion annually by 2050 if current trends continue unchecked.
Regional Differences
Threat patterns vary widely. Tropical regions host the highest proportion of Critically Endangered species (≈28 % of all CR listings) due to rapid deforestation and illegal wildlife trade. Temperate nations often have a larger share of Near‑Threatened species, reflecting slower but pervasive habitat fragmentation. Island ecosystems such as Madagascar and the Caribbean exhibit elevated extinction risk because of limited range sizes and high endemism.
What Scientists Know With High Confidence
- Habitat loss is the leading driver of global species decline, supported by meta‑analyses of more than 1,000 studies.
- Red List categories reliably reflect observed population trends across taxonomic groups.
- Climate change is already causing measurable range shifts for at least 25 % of assessed vertebrates.
- Well‑managed protected areas reduce the probability that a species will move to a higher‑risk category.
What Remains Uncertain
Key uncertainties include the true extinction risk for Data‑Deficient species, which may represent up to 20 % of all assessments, and the long‑term synergistic effects of climate change combined with land‑use change. Limited monitoring in remote regions hampers precise estimates of population trajectories, and predictive models depend on socio‑economic scenarios that remain speculative.
Common Misconceptions
Misconception: The Red List only includes charismatic megafauna.
Reality: While large mammals attract media attention, the List covers a broad spectrum of life, including insects, fungi and marine organisms; many of these lesser‑known groups are listed as threatened.
Misconception: A species classified as “Least Concern” does not need protection.
Reality: “Least Concern” indicates current stability but does not guarantee future safety; rapid declines have been documented for several LC species over the past decade.
Misconception: The Red List is a static document.
Reality: Assessments are regularly updated, and categories can change as new data emerge or as threats intensify.
Solutions and Limitations
Conservation strategies informed by the Red List fall into several categories:
- Protected Area Designation: Expanding and effectively managing reserves can halt habitat loss, but financial and governance constraints often limit coverage.
- Species Recovery Plans: Targeted breeding, reintroduction and threat mitigation have succeeded for species such as the California condor, yet success rates vary widely across taxa.
- Policy Integration: Embedding Red List data into national biodiversity strategies aligns funding with risk, but political will and enforcement remain uneven.
- Climate‑Smart Conservation: Anticipatory actions like assisted migration address future climate threats but raise ecological and ethical concerns, and they require robust scientific justification.
Each approach carries trade‑offs. For example, expanding protected areas may restrict local livelihoods unless co‑management schemes are implemented.
What Individuals, Communities, and Governments Can Do
What Individuals Can Do
- Support organizations that fund Red List assessments and on‑the‑ground conservation.
- Choose sustainably sourced products that reduce pressure on habitats.
- Participate in citizen‑science programs that contribute occurrence data to global databases.
What Communities and Organizations Can Do
- Develop local monitoring programs to fill data gaps for Data‑Deficient species.
- Engage in habitat restoration projects aligned with regional Red List priorities.
- Advocate for inclusion of Red List status in corporate biodiversity impact assessments.
What Governments Can Do
- Integrate Red List categories into environmental impact assessment regulations.
- Allocate funding to update assessments for understudied groups, especially in biodiversity hotspots.
- Adopt legally binding targets that reflect the Red List’s extinction‑risk thresholds, such as the Aichi Targets of the Convention on Biological Diversity.
Synthesis
The IUCN Red List translates complex ecological data into a clear, comparable signal of extinction risk, making it indispensable for scientists, policymakers and the public. Strong evidence links habitat loss, overexploitation and climate change to upgrades in threat categories, while protected areas and recovery programs can reverse declines when properly implemented. Uncertainties persist around Data‑Deficient species and future climate‑land‑use interactions, highlighting the need for continued monitoring and adaptive management. By leveraging the Red List’s insights, societies can prioritize actions that safeguard biodiversity and the ecosystem services on which human well‑being depends.
Frequently Asked Questions
What is the primary purpose of the IUCN Red List?
The IUCN Red List provides a globally standardized assessment of species' extinction risk, helping scientists, policymakers and the public prioritize conservation actions.
How are species categories determined on the Red List?
Assessors apply quantitative criteria (population decline, range size, small population, quantitative analysis and qualitative data) and assign the highest‑risk category that any criterion meets.
Why is climate change included in Red List assessments?
Climate change intensifies existing threats and can directly drive range contractions; incorporating it makes the Red List an early‑warning system for climate‑related biodiversity loss.
What are the main limitations of the Red List?
Data gaps remain for many taxa, especially those listed as Data Deficient, and updates can lag behind rapid environmental changes, limiting real‑time decision‑making.
How can individuals contribute to improving Red List data?
People can support conservation NGOs, choose sustainable products, and join citizen‑science projects that submit species observations to global databases used by the Red List.








Leave a Comment